The Hard Number Index (HNI): The foot comes off the accelerator

Our Hard Number Index (HNI) of the current state of the SA economy indicates that economic activity in SA continues to grow but its rate of acceleration (that is, the forward momentum or speed of the economy) appears to be slowing down and may slow down further if current trends persist. In other words, while the SA economy continues to move ahead it appears to be be doing so a slower speed.

Our HNI is based on two equally weighted, very up to date hard numbers, namely: new vehicle sales released by the motor manufacturers (Naamsa) for May earlier this week and the real value of the notes in circulation at May month end. The notes in circulation figure was released yesterday in the updated Reserve Bank Balance Sheet.

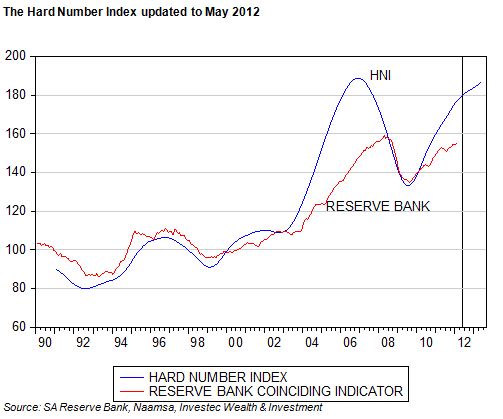
This series we then convert into the Real Money Base by deflating it by the CPI (extrapolated one month ahead). The current level of the HNI and a time series forecast of it is shown below where it is also compared with the Reserve Bank’s business cycle indicator – only updated to February 2012.

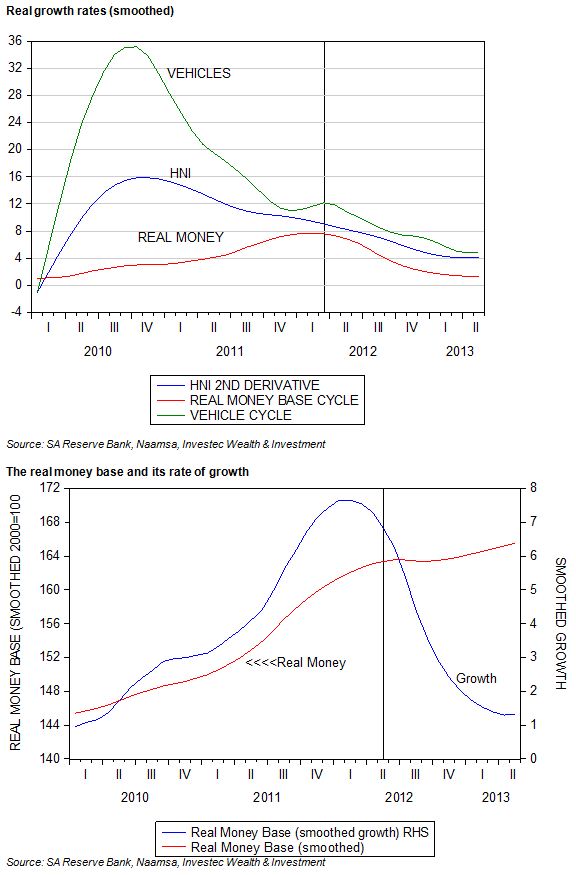
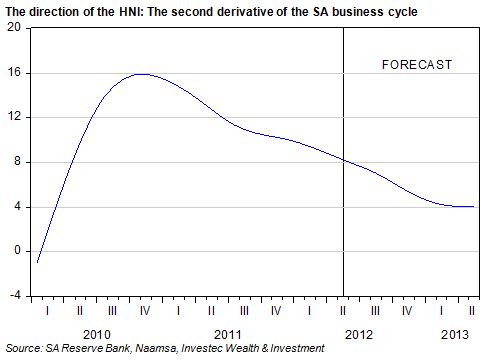
In the figure below we show the change in the forward speed of the economy by measuring the rate of annual change in the HNI. This may be regarded as the speedometer of the economy. The fastest forward speed registered recently by the HNI was in late 2010. The foot has come off the accelerator gradually since then, with a further slowdown in forward momentum predicted.

As we show below, it is the decline in the growth of the supply of and demand for notes by the public and banks (adjusted for the CPI) that is slowing the forward momentum of the HNI, more than the direction of the new vehicle growth cycle, which is also trending lower. Growth in new vehicle sales has peaked, but growth is holding up rather well. May 2012 was a better month for the motor dealers than April 2012, even when seasonal factors like number of trading days are taken into account.

However the underlying growth trends are clearly pointing down, as are broader measures of money supply and bank credit growth. This is the case even though the economy may be regarded as growing slower than its potential growth. The Reserve Bank has suggested this will occur in late 2013. The money market has come to predict that the economy may take much longer to realise its potential growth. Decreases, not increases in short term interest rates are now being predicted to help the economy along. Our direction of our HNI supports such a view. Brian Kantor


An explanation of the numbers

The HNI and the Reserve Bank Indicator may be regarded as a proxy for the underlying state of the economy. When the indicator registers above a real base value of 100, the economy is producing more goods and services, it is growing, and when below 100 the economy is shrinking. Growth will then have turned negative. As may be seen from the HNI and the Reserve Bank Coinciding Business Cycle Indicator, that hovered around 100 between 1990 and 2002, economic activity did not appear to have expanded at all in SA over these years. Since then the index numbers have remained well above 100.

In 2006 -07 the HNI Index turned lower but still remained well above 100. This indicates that while economic activity was still expanding in 2008-09 it was doing so at a slower rate and that the upper point in the Business Cycle, the period of maximum growth or forward economic speed had passed. The HNI Index turned down before the Reserve Bank Indicator and then picked up forward momentum in late 2009 at exactly the same time as the Reserve Bank Index. This indicated that faster rather than slower growth was under way: the HNI more timeously and usefully than the Coinciding Indicator.

GDP provides another much more comprehensive estimate of the level of economic output and its rate of growth. But based, as it must be, on a large number of sample surveys of activity across the economy, and not on hard numbers, these GDP estimates lag well behind economic events. This is true even of the initial estimates of GDP that capture the headlines but that will be subject to significant revisions. We are already in June and national income estimates for the first quarter of 2012 still are only partly released. These lagging indicators of economic outcomes call for more up to date estimates – hence our HNI. But one does wonder about the usefulness of the Reserve Bank’s Coinciding Business Cycle Indicator, or even its leading economic indicator, that even lags behind the lagging GDP estimates themselves.
The rand: Foundations still to be laid

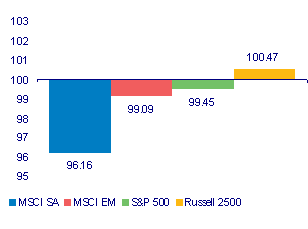
This past month has not been a particularly good one for the rand. The rand lost about 7% against the Aussie dollar in May 2011 to date, while losing less about three per cent Vs the Brazilian real and the US dollar.

We have long watched the relationship between the rand and the Aussie dollar for signs of South African specific risks influencing the value of the rand rather than commodity prices that are common to both currencies. A combination of commodity price strength and rand weakness is a heady one for investors in Resource companies, quoted in rands, on the JSE.

However the current modest rand weakness would appear to have more to do with favourable Australian, rather than less favourable South African specifics. This view is supported by the better performance of the rand against the US dollar and the Brazilian currency.

The rand is more than a commodity currency. It is also very much an emerging market currency and actively traded as a proxy for other less liquid emerging market currencies. The beat to which the rand is moving this month has been day to day volatility on emerging equity markets. The rand has been getting weaker or stronger as emerging equity markets have been going down or up in a highly synchronised way. And the JSE remains a highly representative emerging equity market.

It would appear that it is very much emerging market business as usual in the market for rands. If we run a model that uses the EM equity market Index to explain the rand/US dollar exchange rate using daily data since January 2008, the rand is trading almost exactly as the model predicts.

In the large market for the rand, with daily turnover of about US$20bn making it about the tenth largest foreign exchange market, three quarters of the transactions reported to the SA Reserve Bank are conducted between third parties with no direct link to SA foreign trade or capital movements. They trade the rand because they can trade the rand to hedge emerging market exposures.

The notion that the SA Reserve Bank could intervene effectively in such a market to move the exchange value of the rand in some preferred direction would seem a false premise. The Reserve Bank can buy foreign currency in this market to add to its reserves, as it has been doing, but such interventions could not easily be seen as market moving. The value of the rand continues to be dominated by global forces, particularly those that influence the outlook for the global economy and so emerging equity and bond markets. South African specifics seem to have had little influence on the exchange value of the rand in recent years and we expect global forces to continue to dominate the rand exchange rates.

The rand began the year at R6.61 per US dollar. It lost about 10% of this value by early February 2011 and then reclaimed its beginning of the year value in late April 2011. It has by now lost about 4% of its January 2011 value against the US dollar this year, while the Aussie and the real are about three percent stronger than they were at the beginning of the year.

While the volatility in the market for rands this year may be regarded as moderate by its own standards, the still unusual volatility in the rand must remain of concern to the authorities in SA. Without rand stability, predicting inflation and interest rates more than six months ahead with any degree of accuracy or confidence, remains a near impossible task. The foundations for genuinely stabilising monetary policy and interest rate settings in the form of a stable and predictable rand have still to be laid.

To view the graphs and tables referred to in the article, see Daily Ideas in todays Daily View:

Daily View 27 May: The rand: Foundations still to be laid

Hard Number Index: Maintaining speed

The February 2011 reports on new unit vehicle sales and the Reserve Bank note issue have been released and we are able to update our Hard Number Index (HNI) of the current state of the SA economy. As may be seen below, the economy continued to pick up momentum in February 2011.
 
The very up to date HNI is proving a reliable leading indicator of both the Coinciding Business Cycle Indicator of the Reserve Bank (updated to November 2010) and the Reserve Bank Leading Indicator of the SA Business cycle (updated to December 2010).  
  Continue reading Hard Number Index: Maintaining speed

2011-2012 Budget: Getting value for government money

The first impression one has of the Budget proposals is just how strongly government revenues have grown over the past fiscal year, something around 13%. Also, how strongly tax revenues (not tax rates) are expected to increase over the next few years. At around a 10% per annum rate, or in real terms by about 5%, government expenditure is planned to grow at around an 8% rate or around equivalent to a 3% rate in expected inflation adjusted terms.

Read the full story in the Daily View here: 2011-2012 Budget: Getting value for government money

The Hard Number Index: Recovery remains well on course

The Reserve Bank announced its note issue for January this morning. This enables us to complete our Hard Number Index (HNI) of the immediate state of the SA economy. Our HNI combines unit vehicle sales with the note issue (adjusted for inflation in equal weights) to provide a very up to date indicator. We compare trends in the HNI with the Reserve Bank coinciding indicator of the state of the business cycle, although this has only been updated to October 2010. Three months can be a very long time in economic life. Continue reading The Hard Number Index: Recovery remains well on course

New vehicle sales: A bright start to the year

The first bit of news about the SA economy in 2011 has been released by NAAMSA in the form of new vehicle sales in January. 45 135 new units were sold in January 2011, up from 39 504 in December 2010. But this does not tell the full story of very robust sales. January and December are usually well below par months for selling new vehicles. Holiday makers are more likely to buying Christmas presents for others than new toys for themselves.

On a seasonally adjusted basis new vehicle sales were up from 45 404 units in December to 45 758 units in January, an increase of 7.4%. This followed a very strong November. If these trends are sustained, sales in 2011 will approximate 585 000 units, up 18% from the 494 340 units sold in 2010. Continue reading New vehicle sales: A bright start to the year

Value for money and value add at the GSB Cape Town

Our readers may not have noticed but the Financial Times ranking of Business Schools around the world was published yesterday. The top schools as estimated by the schools themselves and by the opinions of their alumni were jointly the London Business School and the Wharton School at the University of Pennsylvania. Third was Harvard and joint fourth, Insead and Stanford Business School.

In 60th place up from 89 in 2010 was the GSB at the University of Cape Town. It is the only business school in Africa that is ranked in the FT top 100. Most interestingly the Cape Town GSB ranked first in the Value for Money Category. This has a low three per cent weight in the overall score and so could not have made a great difference to the ranking order. Much more important for the ranking Measure are the categories Weighted Salary with a 20% weight (the average alumnus salary today with adjustment for salary variations between industry sectors. Includes data for the current year and the one or two preceding years where available) and the Salary Percentage Increase with another 20% weight (The percentage increase in average alumnus salary from before the MBA to today as a percentage of the pre-MBA salary). Continue reading Value for money and value add at the GSB Cape Town

The global forces that drive SA’s Financial markets from day to day

This study demonstrates with the aid of single equation regression analysis the role global capital markets play in determining the behaviour of the Johannesburg Stock Exchange(JSE ALSI) the Rand/ US dollar exchange rate (ZAR) and long term interest rates in South Africa on a daily basis represented by the All Bond Index (ALBI) or long term government bond yields represented by the R157. It will be shown that since 2005 the state of global equity markets, represented in the study bythe MSCI Emerging Market Index (EM) has had a very powerful influence on the JSE. The EM Index is shown to have had a less powerful yet statistically significant influence on the ZAR while it is also demonstrated and that conditions in global capital markets, and the ZAR have had some weak but statistically significant influence on the direction of long term interest rates in South Africa. It will be demonstrated that movements in  policy influenced short term interest rates, have had very little predictable influence on share prices, the ZAR or long termbond yields. The causes as well as the consequences of the ineffectiveness of policy determined interest rates for monetarypolicy are further analysed.

Turbulence on the Nile – ripples elsewhere

The likely fall of an Egyptian Pharaoh, after a very long reign, added uncertainty to global markets last week. Exposure to equities was reduced and share markets retreated with most of the weakness experienced on the Friday. A weaker rand made the JSE an underperforming Emerging Market in USD. The weak rand furthermore did not spare the Resource stocks that are regarded as riskier than most. (See below)

Global Equity markets Weekly USD returns; January 23rd= 100

Source; Bloomberg and Investec Securities, Investec Wealth and Investment


JSE Weekly Rand returns; January 23rd= 100

Source; Bloomberg and Investec Securities, Investec Wealth and Investment

Continue reading Turbulence on the Nile – ripples elsewhere

Earnings: The trend is your friend – but which trend?

JSE All share index earnings are highly cyclical. And the cycle is one of high peaks and deep troughs in the growth rate ofearnings, as the illustration of the cycle of inflation adjusted or real earnings growth for the JSE since 1961 shows.The cycle has been particularly vicious lately. After a surge in earnings growth after 2004, which was sustained until 2008, thegrowth cycle turned very negative in 2009-2010. Real earnings at the bottom of the trough in late 2009 were some 40% lower thana year before. This represented the deepest trough in the JSE earnings cycle since 1960. Real JSE earnings growth turnedpositive again late in 2010 and consensus forecasts would have them grow by about 25% in 2011.

Continue reading today’s Daily View here: Daily View 26 January 2011

The building cycle: When a plan comes together

There are increasing signs that the global economic recovery is building momentum, and is very strong in many instances. We saw this last week with Chinese GDP numbers for the fourth quarter, which grew at an annualised 12.7%. But even in the developed world the signs are looking promising, with good business activity survey numbers out of Japan and Germany, and a promising set of jobless claims numbers out of the US last week.

Continue reading the Daily View here: Daily View 24 January 2011

Minding the Gap

The Monetary Policy Committee (MPC) of the Reserve Bank opted to keep the repo rate unchanged at 5.5% yesterday, in a move entirely in line with market expectations. Perhaps of more interest was the MPC’s outlook for inflation, which it upped to 4.6% for 2011 (from 4.3%) and 5.3% for 2012 (from 5.8%). We discuss the monetary stance of the MPC elsewhere in Daily View, but there has certainly been more talk in recent weeks of higher inflation later this year, as a weaker rand and rising commodity prices take their toll.

Continue reading the Daily View here: Daily View 21 January 2011