https://www.youtube.com/watch?v=oxBSmb5ef24&feature=youtu.be
Money matters – also in SA
Central Banks have more to offer a distressed economy than lower interest rates. They can supply their economy with much more of their money in the form of the deposits they supply to their private banks. They can add as much money to the economy as they deem necessary, by lending more to their governments, private banks and businesses.
If the banks and their borrowers respond favourably to these monetary injections, the supply of private bank deposits and of bank credit will increase by some multiple of any additional central bank money. The extra money and credit created will then be exchanged for goods and services, the labour to help produce them and exchanged for other assets. Higher share prices, more valuable long dated debt, and real estate, translates into more private wealth, leading to less income saved and more spent. Helping to relieve distress.
Lockdowns have disrupted output and sacrificed the incomes of businesses and the households and governments on a large scale. Getting back to an economic normal requires a mixture of increasing freedom and willingness to supply goods services and labour. It also needs more spending to encourage firms to wish to produce more and hire more workers and managers. Money creation on a very large and urgent scale is helping to stimulate demand almost everywhere. M2 (that is bank deposits) in the US have grown by nearly 25% over the past twelve months. QE is working very rapidly this time round.
The SA Reserve Bank has adopted a very different strategy and rhetoric. It has decided that it has done all it can for the economy by cutting its repo rate by 3 percentage points to 3.5%. It has rejected any QE that might have reduced pressure on interest rates at the long end of the yield curve. It argues that a structural inability to supply over which it has limited influence, is the cause of our economic distress, not the weak state of demand. Go figure as they would say in New York
Yet perhaps all is not lost on the SA monetary front. The deposit liabilities of the banks (M3) had grown by about 11% by August and the supply of Reserve Bank money is up by 12.5% p.a. in September compared to the year before. This represents a marked acceleration. Much less helpfully bank lending to the private sector was up by only 3.9% p.a. in August. The difference between the growth in bank deposit liabilities, up 11% and assets up by about 4%, is accounted for by a large increase in the free cash reserves of the banks, of about a net R60b in 2020. That is the cash on their books less all their repurchase agreements with the Reserve Bank and others have become less negative.
The banks have been provisioning against loan defaults on a large scale. These provisions reduce their reported earnings and therefore dividends. It therefore increases their cash and free reserves that are reflected as an increase in equity reserves. A process that is reversed should the bad debts materialize.
The banks invested a further and significant R110b in additional government debt between January and June 2020. Very helpful to a very hard pressed fiscus, but also crowding out lending to the private sector. The currently very steep slope of the yield curve adds to the attraction of borrowing short to lend long to the government. It also implies that short rates are expected to increase very dramatically over the next five years. Unless inflation or real growth picks up very surprisingly, the very much higher short rates implied by the yield curve seem unlikely. Borrowing short to lend long seems like a very good and profitable strategy for SA banks and others. Borrowing short and rolling over short term debt rather than borrowing long, at much higher rates seems like a good idea for the RSA.
This all leads to an undeniable conclusion. Any revival of the SA economy will depend on realizing lower real long-term interest rates and flattening the yield curve. It will bring lower real required returns for any business that might invest more in the SA economy, essential if the economy is to pick up any sustainable momentum. Only a credible commitment to restraining government spending over the longer run can lead SA out of the stultifying burden of very expensive capital.
A call for realism in economic and monetary policy
What permanent shape will the global economy take after the lock downs are fully relieved? How fast can the global economy grow when something like normality resumes? There are those who argue that the major economies have entered an extended period of economic stagnation. Some even argue that demand will have difficulty in keeping up with minimal extra supplies of goods services and labour. That monetary policy has shot its bolt because interest rates cannot go much below zero.
We should dismiss such underconsumption theories. Monetary stimulus comes not only from lower interest rates but also occurs directly as excess supplies of money are converted into demands for other goods or services and for other assets. Higher asset prices and greater wealth also have positive effects on spending. There is no technical limit to the amount of money central banks can create to stimulate more spending. The only limit is their own judgment as to how much extra is necessary to the purpose of getting an economy up and running again.
Stagnation will be for a want of willingness to supply goods services and labour. If demand remains weak we should expect ever more injections of central bank cash until demand increases enough to make inflation rather than growth the problem for central banks. This is unlikely any time soon and global interest rates will remain low until then. Such policies can be reversed when the time is right to do so.
These low interest rates encourage a flow of capital to those parts of the world where real interest rates are much higher. As in South Africa where the market still rules the determination of long-term interest rates given the clear unwillingness of the SA Reserve Bank to monetize government debt on any significant scale. The SA government has to offer nearly 10% for ten-year money. Adjusted for expected inflation of around 5% this provides a very attractive expected real return of around 5% per annum over the next ten years.
The average private firm contemplating investing in plant and equipment in SA would have to add a risk premium of another five per cent to establish the returns required to justify such an investment. These expected returns would therefore have to be of the order of an expected 10% p.a. after inflation. A requirement that is prohibitively high and explains in large measure the lack of capital expenditure in SA. And reinforces the prospect of a permanently stagnant economy. It also explains the depressed value of SA facing companies on the JSE regarded as without good prospects for growth. For faster growth in capex, interest rates have to come down or, less happily, inflation must go up to reduce required returns on capex.
Improving our growth prospects requires a steely economic realism in response to current very difficult circumstances. It necessitates more central bank intervention to lower long-term interest rates and much more reliance on short term borrowing that will be much less expensive for taxpayers. It calls for still lower interest rates at the short end. It calls for money creation and debt management of the kind practiced almost everywhere else as a temporary, post lock-down stimulus to more spending and growth- but alas not here.
The blow out in the borrowing requirement of the government –because revenue has collapsed with incomes – is a best regarded as unavoidable. Realism means no increases in tax rates on expenditure or incomes. Doing so would further slow-down the economy and revenue collections with it. Higher expenditure taxes and charges would also raise headline inflation, depress spending on other goods and services and raise demands from public sector unions for better pay. These now pressing demands for improved employment benefits for comparatively well paid and protected public sector employees must be strongly resisted. This will help demonstrate that the SA government can spend within its capacity to raise revenue over the longer term. The debt trap is avoidable.
It calls for policy responses that would best serve the economy now in crisis and act as a bridge to permanently sound policies of a market friendly nature. So providing a signal of improving prospects that would justify significant inflows of capital to lower interest rates and required returns. That in turn would lead to much higher levels of capital expenditure necessary for permanently faster growth.
PSG and Capitec – Shareholders’ (un)bundle of joy
The PSG holding in Capitec had accounted for a very important 70% of the net asset value (NAV) or the sum of parts of PSG. Before the unbundling cautionary was issued in April 2020, the difference between the NAV and market value of PSG, the discount to NAV, had risen to well over 30%. The difference in NAV and market value of PSG was then approximately R20bn in absolute terms. The discount to NAV then narrowed to about 18% when the decision to proceed with the unbundling was confirmed.
Now with the unbundling complete, PSG again trades at a much wider discount of 40% or so to its much-reduced NAV.
Capitec and PSG delivered well above market returns after 2010. By the end of 2019, the Capitec share price was up over 18 times compared to its 2010 value. By comparison, the PSG share price was then 10 times its 2010 value, and the JSE 2.1 times. The Capitec share price strongly outpaced that of PSG only after 2017.
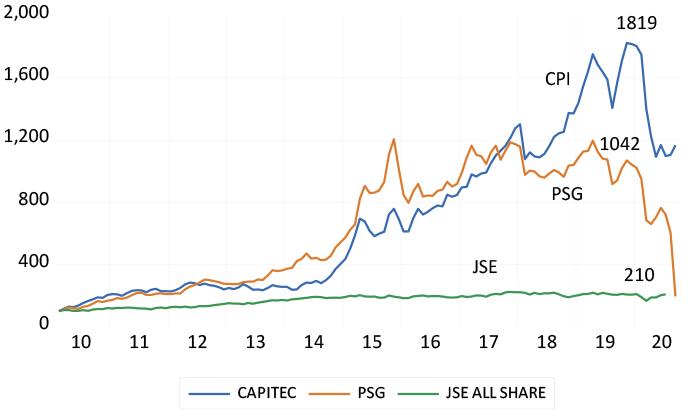
The better the established assets of a holding company perform, as in the case of a Capitec held by PSG or a Tencent held by Naspers, the more valuable will be the holding company. Its NAV and market value will rise together but the gap between them may remain wide. Investors will do more than count the value of the listed and unlisted assets reported by the holding company. They will estimate the future cost of running the head office, including the cost of share options and other benefits provided to managers of the holding company. They will deduct any negative estimate of the present value of head office from its market value. They may attach a lower value to unlisted assets than that reported by the company and included in its NAV.
Investors will also attempt to value the potential pipeline of investments the holding company is expected to undertake. These investments may well be expected to earn less than their cost of capital, in other words, deliver lower returns than shareholders could expect from the wider market. These investments would therefore be expected to diminish the value of the company rather than add to it. They are thus expected to be worth less than the cash allocated to them.
To illustrate this point, assume a company is expected to invest R100 of its cash in a new venture (it may even borrow the cash to be invested or sell shares in its holdings to do so). But the prospects for the investments or acquisitions are not regarded as promising at all. Assume further that the investment programme is expected to realise a rate of return only half of that expected from the market place for similarly risky companies. In that case, an investment that costs R100 can only be worth half as much to its shareholders. Hence half of the cash allocated to the investment programme or R50 would have to be deducted from its current market value.
All that value that is expected to be lost in holding company activity will then be offset by a lower share price and market value for the holding company – low enough to provide competitive returns with the market. This leads to a market value for the company that is less than its NAV. This value loss, the difference between what the holding company is worth to its shareholders and what it would be worth if the company would be unwound, calls for action from the holding company of the sort taken by PSG. It calls for more disciplined allocations of shareholder capital and a much less ambitious investment programme. The company should rather shrink, through share buy backs and dividends, and unbundling its listed assets, rather than attempt to grow. It calls for unbundling and a lean head office and incentives for managers linked directly to adding value for shareholders by narrowing the absolute difference between NAV and market value. Management incentives, for that matter, should not be related to the performance of the shares in successful companies owned by the holding company, to which little or no management contribution is made.
On that score, a final point directed towards Naspers and its management: the gap between your NAV and market value runs into not billions, but trillions of rands. This gap represents an extremely negative judgment by investors. It reflects the likelihood of value-destroying capital allocations that are expected to continue on a gargantuan scale. It also reflects the cost of what is expected to remain an indulgent and expensive head office.
The case for funding with equity, not debt
Two recent cases of JSE-listed companies reveal the advantages of equity funding over debt funding.
While issuing debt can be more dangerous than issuing equity, it receives more encouragement from shareholders and the regulators. Debt has more upside potential: if a borrower can return more than the costs of funding the debt (return on equity improves) and there is less to be shared with fellow shareholders.
But this upside comes with the extra risk that shareholders will bear should the transactions funded with debt turn out poorly. Any increase in the risk of default will reduce the value of the equity in the firm – perhaps significantly so.
The accounting model of the firm regards equity finance as incurring no charge against earnings. You might think it would help the argument for raising permanent equity capital rather than temporary debt capital. But this is clearly not the case, with the rules and regulations and laws that govern the capital structure of companies. It is also represented in the attitude of shareholders to the issuing of additional equity. They have come to grant ever less discretion to company boards to issue equity. Less so with risky debt.
(Note: I am grateful to Paul Theodosiou for the following explanation of the different treatment of debt and equity capital raising. Paul was until recently non-executive chairman of JSE-listed REIT, Self Storage (SSS), and previously MD of the now de-listed Accucap of which I was the non-executive chairman).
Typically at the AGM, a company will seek two approvals in respect of shares – a general approval to issue shares for cash (which these days is very limited – 5% of shares in issue is the norm) and an approval to place unissued shares under the control of directors (to be utilised for specific transactions that will require shareholder approval). These need 75% approval. So shareholders keep a fairly tight rein on the issue of shares.
Taking on or issuing debt, on the other hand, leaves management with far more discretion. Debt instruments can be listed on the JSE without shareholder approval, and bank debt can be taken on at management’s discretion. The checks and balances are more broad and general when it comes to debt. Firstly, the memorandum of incorporation will normally have a limit of some kind (for REITs, the loan to value ratio limits the amount of debt relative to the value of the assets). If the company is nominally within its self-imposed limits, shareholders have no say. Secondly, the JSE rules provide for transactions to be categorised, and above a certain size relative to market cap, shareholders must be given the right to approve by way of a circular issued and a meeting called. The circular will spell out how much debt and equity will be used to finance the transaction, and here the shareholders will have discretion to vote for or against the deal. If they don’t approve of the company taking on debt, they can vote at this stage. Thirdly, shareholders can reward or punish management for the way they manage the company’s capital structure – but this is a weak control that involves engaging with management in the first instance to try and persuade, and disinvesting if there isn’t a satisfactory response.)
Perhaps the implicit value of the debt shield – taxes saved by expensing interest payments – without regard to the increase in default risk, confuses the issues for investors and regulators. It is better practice however to separate the investment and financing decisions to be made by a firm. The first step is to establish that an investment can be expected to beat its cost of capital, whatever the source of capital, including internally generated cash that could be given back to shareholders for want of profitable opportunities. When this condition is satisfied, the best (risk adjusted) method of funding the investment can be given attention.
The apparent aversion to issuing equity capital to fund potentially profitable investments seems therefore illogical. Or maybe it represents risk-loving rather than risk-averse behaviour. Debt provides potentially more upside for established shareholders and especially managers, who may benefit most from incentives linked to the upside.
Raising additional equity capital from external sources to supplement internal sources of equity capital is what the true growth companies are able to do. And true growth companies do not pay cash dividends, they reinvest them, earning economic value added (EVA) for their shareholders. A smaller share of a larger cake is clearly worth more to all shareholders.
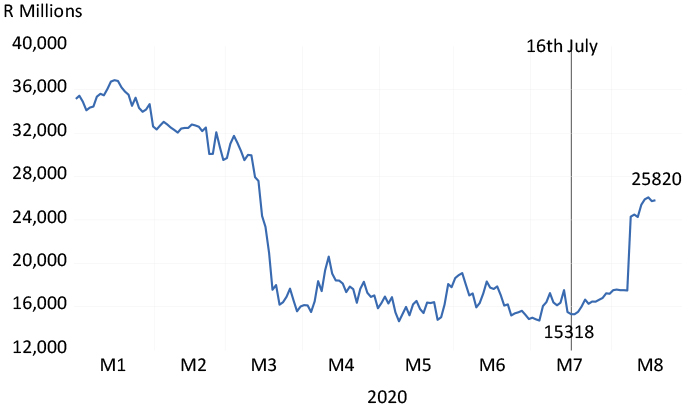
There are two recent JSE cases worthy of notice. Foschini shareholders approved the subscription of an extra R3.95bn of capital on 16 July to add about 20% to the number of shares in issue. By 19 August, the company was worth R25.8bn, or R10.5bn more than its market value on 16 July, or R6.5bn more than the extra capital raised. The higher share price therefore has already more than compensated for the additional shares in issue.
The Foschini Group – market value to 19 August 2020
Source: Bloomberg, Investec Wealth & Investment
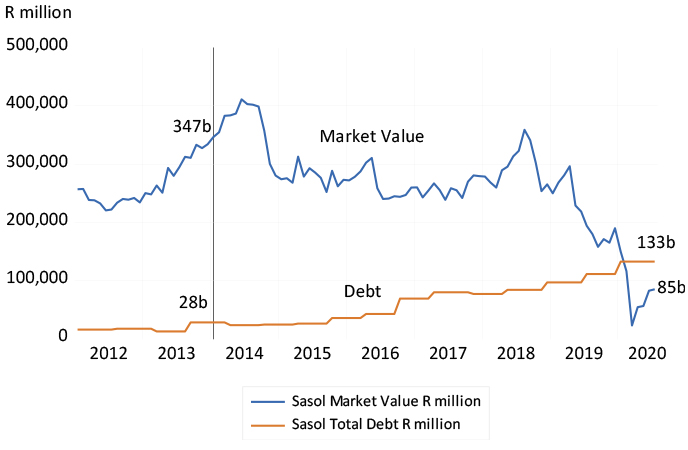
The other example is Sasol, now with a market value of about R87bn, heavily depressed by about R110bn of outstanding debt. The extra debt was mostly incurred funding the Lake Charles refinery that ran far over its planned cost and called for extra debt. Sasol was worth over R400bn in early 2014, with debts then of a mere R28bn. The recent market value, now less than the value of its debts, is clearly being supported by the prospect of asset sales and a potential capital raise.
The company would surely be much stronger had the original investment in Lake Charles been covered more fully by additional equity capital, capital they might have been able to raise with much less dilution. It might also have prevented the new management team from having to sell off what might yet prove to be valuable family silver – assets capable of earning a return above their cost of capital. In this case, a large rights issue could still be justified to bring down the debt to a manageable level and, as with the Foschini increase, the value of its shares by more (proportionately) than the number of extra shares issued.
Sasol – market value and total debt, 2012 to July 2020
Executive remuneration and real value creation in the time of Covid
Foresight not only hindsight may well justify equity over debt
While issuing debt is more dangerous than issuing equity it receives more encouragement from shareholders and the regulators [1]. Clearly debt has more upside potential. If a borrower can return more than the costs of funding the debt- return on equity improves- and there is less to be shared with fellow shareholders. But clearly the upside comes with extra risks that shareholders will bear should the transactions funded with debt turn out poorly. Any increase in the risks of default will reduce the value of the equity in the firm – perhaps very significantly so.
The accounting model of the firm regards equity finance as incurring no charge against earnings. Hence you might think would help the argument for raising permanent equity capital rather than temporary debt capital. But this is clearly not the case with the rules and regulations and laws that govern the capital structure of companies. It is also represented in the attitude of shareholders to the issuing of additional equity. They have come to grant ever less discretion to the company boards and their managers to issue equity. Less so with risky debt.
Perhaps the implicit value of the debt shield – taxes saved expensing interest payments – without regard to the increase in default risk- confuses the issues for investors and regulators. It is better practice to separate the investment and financing decisions to be made by a firm. First establish that an investment can be expected to beat its cost of capital,-. Cost of capital being the required risk adjusted return on capital invested whatever itsthe source including investing the cash generated by the company itself. Somethingof capital, including internally generated cash that could be given back to shareholders for want of profitable opportunities. When this condition is satisfied the best (risk adjusted) method of funding the investment can be given attention.
The apparent aversion to issuing equity capital to fund potentially profitable capes or acquisitions seems therefore illogical. Or maybe it represents risk loving rather than risk averse behaviour. Debt provides potentially more upside for established shareholders and especially managers who may benefit most from incentives linked to the upside.
Raising additional equity capital from external sources to supplement internal sources of equity capital is what the true growth companies are able to do. And true growth companies do not pay cash dividends, they reinvest them earning Economic Value Added (EVA) for their shareholders. A smaller share of a larger cake is clearly worth more to all shareholders
There are two recent JSE cases worth notice. TFG shareholders approved the subscription of an extra R3.95b of capital on July 16th to add about 20% to the number of shares in issue. The company on August 19th was worth R25.8b or R10.5b more than its market value of the 16th July. Or worth some R6.5b more than the extra capital raised. The higher share price therefore has already more than compensated for the additional shares in issue. ( see below)
The Foschini Group (TFG) Market Value R millions (Daily Data to August 19th 2020)
Source; Bloomberg, Investec Wealth and Investment
The other example is Sasol (SOL) now with a market value of about R80 billion so heavily depressed by about R110b of outstanding debt. The extra debt was mostly incurred funding the Lake Charles refinery that ran so far over its planned cost and called for extra debt. SOL was worth over R400b in early 2014 with debts then of a mere R28b. The market value of SOL (R86b) now less than the value of its debts, is clearly being supported by the prospect of asset sales and a potential capital raise. The company would surely be much stronger had the original investment in Lake Charles been covered more fully by additional equity capital. Capital they might have been able to raise with much less dilution. It might also have prevented the new management team from having to sell off what might yet prove to be valuable family silver that they intend to do. That is assets capable of earning a return above their cost of capital. If so a very large rights issue could still be justified to bring down the debt to a manageable level and as with TFG increase the value of its shares by more (proportionately) than the number of extra shares issued. (see chart below)
Source; Bloomberg, Investec Wealth and Investment
[1] Paul Theodosiou until recently non-executive chairman of JSE listed Reit Self Storage (SSS) and previously MD of now de-listed Acucap (ACP) of which I was the non-executive chairman repoded to my enquiry about the differential treatment of debt and equity capital raising as follows
Typically at the AGM a company will seek two approvals in respect of shares – a general approval to issue shares for cash (which these days is very limited – 5% of shares in issue is the norm) and an approval to place unissued shares under the control of directors (to be utilized for specific transactions that will require shareholder approval). These need 75% approval. So shareholders keep a fairly tight rein on the issue of shares.
Taking on or issuing debt, on the other hand, leaves management with far more discretion. Debt instruments can be listed in the JSE without shareholder approval, and bank debt can be taken on at managements discretion. The checks and balances are more broad and general when it comes to debt. Firstly, the MOI will normally have a limit of some kind (for Reits, the loan to value ratio limits the amount of debt relative to the value of the assets). If the company is nominally within its self-imposed limits, shareholders have no say. Secondly, the JSE rules provide for transactions to be categorised, and above a certain size relative to market cap, shareholders must be given the right to approve by way of a circular issued and a meeting called. The circular will spell out how much debt and equity will be used to finance the transaction, and here the shareholders will have discretion to vote for or against the deal. If they don’t approve of the company taking on debt, they can vote at this stage. Thirdly, shareholders can reward or punish management for the way they manage the company’s capital structure – but this is a weak control that involves engaging with management in the first instance to try and persuade, and disinvesting if there isn’t a satisfactory response.
How to build the confidence needed to borrow and lend
An economic recovery programme for South Africa demands the kind of business and political leadership that now appears to be lacking.
These are truly unprecedented economic times. Never before have large sectors of our own and most other economies been told to stop working. Large numbers of potential participants in the economy are being forced to stay at home. The impact on the supply of goods and services, the demand for them and the incomes normally earned producing and distributing them, has been devastating. Perhaps up to 20% of potential output, or GDP in a normal year, will have been sacrificed globally to the cause. We will know how much has been sacrificed only when we look back and are able to do the calculations.
In South Africa’s case this one fifth of GDP would amount to about R1 trillion of income permanently lost. These are extraordinary declines in output and income. Ordinary recessions, when GDP declines by 2% or 3% in a quarter or a year, are much less severe than this.
Compensation however can be paid to the households and business owners who, through no fault of their own, have lost income and wealth. It is being provided on different scales of generosity across the globe. The richer countries are noticeably more generous than their poorer cousins. South Africa, alas, is among the more parsimonious, at least to date in practice.
There is however no way to recover what has been lost in production. All that can be hoped for is a speedy recovery of the economy when businesses and their employees are allowed to get back to normal. But getting back to producing as much as before the lockdowns means not only more output and jobs becoming available. Any recovery in output will have to be accompanied by more demand for the goods and services that the surviving business enterprises can supply. Without additional spending during the recovery process, there will not be additional supplies of goods, services, jobs and incomes.
Providing unemployment benefits and other benefits paid in cash to the victims of the lockdowns will help to stimulate spending. In the US, every household received a cheque in the post of over $1000 and temporary unemployment benefits of $600 per week were more than many would have earned. The average US household will come out of the crisis with more cash than they had before. And more may be on the way. Spending the cash will help the pace of recovery.
The US and many other countries will be doing what it takes to get back to normal. They will also be learning along the way just how much spending by governments it will take before they can take their feet off the accelerators. They are not being constrained by the monetary cost of such spending programmes. The cheapest way for a government to fund spending is by printing money and redeeming the money issued with more money.
The central banks of developed economies are supplying large extra amounts of cash to their economies in a process of money creation also known as quantitative easing or bond purchasing programmes. The supply of central bank cash in the largest economies has grown 30% this year. Central banks have been buying financial securities, mostly issued by their governments in exchange for their cash that is so willingly accepted in exchange. By so doing, they have helped force down the interest rates their governments pay lenders to very low levels – sometimes even below zero for all government debt, short and long dated. This is an outcome that has made issuing government debt even for 10 years or more even cheaper than issuing money.
These governments have also arranged on an even larger scale (relative to GDP) loan guarantee schemes for their banks to encourage bank lending that will enable businesses that have bled cash during the lockdowns to recapitalise, on favourable terms. Central banks, secured by funds committed by their governments, are covering up to 95% of any losses the banks might suffer if the loans are not repaid. The take-up of such loans by businesses in the US has been very brisk.
South Africa, as mentioned, has not adopted any do-what-it-takes approach to our crisis of perhaps larger relative dimensions. I have argued that we should practise the same logic as the developed economies and rely in the same way on our central bank to create money to hold down the interest cost of funding higher government spending and the accompanying debt. This would be a similarly temporary exercise in economic relief – one well-explained and understood as such – for only as long as it takes.
South Africa has moreover introduced a potentially significant loan guarantee scheme for our banks, with a potential value of up to R200bn. Sadly, little use of the credit lines has so far been made: only R14bn appears as taken up. Every effort should be made to encourage businesses to demand more credit and for the banks to lend more, since they are exposed potentially to only 6% of the loans they make. Working capital, which is necessary to restart SA businesses, is therefore available. The confidence to re-tool seems to be lacking, as is the determination of the banks to find customers willing to invest in the future, from which they will benefit permanently, should they succeed.
The recovery programme demands a business and political leadership that now appears to be lacking. Leadership should want large and small businesses to believe in their prospects after the lockdown and to act accordingly. Economic recovery – getting back to normal as quickly as possible – demands no less.
The Reserve Bank can put its reputation for inflation fighting to good use – reviving our economy after lock-down.
How much income will be sacrificed for the lock downs will depend upon how quickly production (supply) and spending (demand) can be resumed. As always supply and demand will depend on each other and respond together. The more an economy is stimulated by way of government spending on relief and by monetary policy – lower interest rates and more money and credit supplied – the more demand will be exercised and be expected from the customers of businesses. And the greater will be their willingness to tool up and hire workers and managers to satisfy demands.
So much is almost common cause globally. Learning about how well the recovery is going and when the foot can best be taken off the accelerator will be necessary. But surely not until it becomes very clear that an economy is back to normal. That is producing as much output and income as it is capable of- without inflation. When and if inflation comes back, stimulus should and can be reversed.
And the steeper the path back to normal the less the lockdown will have cost in real terms- in income sacrificed. And the cheaper the government can borrow to fund its growing deficits, the less will the future interest bill on much increased issues of government debt.
Hence massive reliance has been placed on central banks in the developed world to print more money. Cash created by central banks in the form of the note issue and bank deposits with the central bank is government debt that does not ordinarily bear interest. Hence extra money issued by central banks has been used on a vast scale to buy government and corporate debt in the market-place in order to hold down all interest rates and to fund government spending directly. Now called politely quantitative easing – but money creation by another name. And to supply their banks with additional cash reserves so that they might provide additional credit on favourable terms to the private and government sectors.
Extra central bank purchases of government debt in the developed have even exceeded this year the vastly increased issues of government debt by the major economies. Hence we observe low even negative interest rates across the entire term structure of interest rates. Making issuing debt for some governments even cheaper than money. The future tax-payer in the developed world has not been made not hostage to a spending and borrowing surge of unprecedented proportions, outside of war time.
The self-same approach is called for in SA and for any economy with its own currency and central bank and for the same very good reasons. And with the same recognition that stimulus can be reversed when the time is right. Unfortunately, the SA Reserve Bank does not agree. It has consistently argued against the case for buying government bonds on an aggressive scale to hold down interest rates. Most recently it has suggested that QE is not only undesirable but impractical, until interest rates are at zero and deflation beckons.
The argument made is that bond purchases (or for that matter increases in Foreign Assets held by the Reserve Bank or declines in their government deposits liabilities) adds to the supply of cash in the system and would have to be fully sterilized by equivalent sales of securities by the Reserve Bank.
However there is never any compulsion to sterilize all such purchases nor any logic in doing so. The object of any bond buying would be to add to the money base by some well-designed amount to encourage the private banks to lend more. The banks might prefer to hold more cash supplied to them in reserve and if so would not have to borrow from the Reserve Bank making the repo rate possibly irrelevant. But this might call for still more cash to be injected and for interest rates to go to zero -helpfully in the circumstances of depressed demand.
Ideally the extra cash supplied to the banks would better be used to fund additional lending to the private and public sectors to encourage spending. The much fuller adoption of the loan guarantee scheme (potentially R200bn of extra bank lending) would reduce any potential demand from our banks for excess cash reserves. The scheme should provide the extra capital and as important the confidence to reboot the SA economy. It urgently needs a champion in the Reserve Bank.
Should the economy recover enough to threaten inflation targets the Governor could be providing good reasons why the monetary taps can be tightened as easily as they were loosened. Given his hard-won inflation fighting credentials these could be used to save the economy from avoidable distress – without prejudicing long term stability.
War and peace – Making sense of the biggest spending splurge in peacetime
Only the arrival of inflation is likely to put an end to the biggest round of government spending seen in in times of peace.
The extent of the surge in government spending and borrowing and money creation currently under way, especially in the richer nations, has no precedent in peacetime. Perhaps that’s because we are not really at peace. We are at war with a virus and, as in most wars, this is accompanied by warlike amounts of impenetrable fog, multiple chaotic situations and much wealth destruction.
Yet there is no sign of any taxpayer revolt to the spending propensities of governments. The current spat between Republicans and Democrats over additional spending is by no means asymptomatic. As I write these words, Congress and the President have already approved extra spending of US$3.2 trillion. The Democrats have now proposed an extra US$3.4 trillion of relief divided up their way. The Republican offer is of an extra US$1.1 trillion spent very differently. For a US$20 trillion economy, either set of spending proposals is formidable.
The global outlook for government debt is truly astonishing. The US fiscal deficit is predicted to approach 25% of GDP shortly, much larger than it has ever been, but for World War 2. In the UK, the debt/GDP ratio was below 60% in 2015 and forecast by the Office for Responsible Budget to fall marginally by 2050. The latest forecast is for a debt/GDP ratio, currently at 100%, to double by 2030. Managing government debt with the aid of central banks and their power to create money, usually the cheapest non-interest bearing form of government debt, is characteristic of all funding arrangements in and after wartime. But if this is war, then it is one without more inflation, either now or expected in the future. 90% of all developed market debt now yields less than 1% a year, of which 10% offers negative returns. It is therefore an inexpensive war for taxpayers to fund.
The recent growth in the size of developed market central banks is equally and consistently awesome. Or is it awful? It could not have happened without them. And there is every prospect of further growth in their assets to come. The balance sheets of four of the largest economies (US, Japan, the European Union and the UK) have increased by the equivalent of US$5.7 trillion (16% of GDP) since February, in other words, by about 30% in five months. Further purchases of securities, mostly issued by their governments, combined with support for extra private bank lending, can be expected to take their balance sheets to about US$27 trillion by 2021, the equivalent of 67% of GDP.
They have similarly increased their liabilities, in the form of extra deposits held by private sector banks at the central bank. These and other central banks have been exchanging their cash for government and other debt on a scale that has made them completely dominant in the market for government debt. They dominate over all maturities that are the benchmarks for all other yields, including earnings and dividend yields in the share market.
The US Fed will soon own 25% of US debt. The number was 10% in 2009. The Bank of Japan has grown its share of government debt from 5% in 2012 to over 40%. The European Central Bank held no European government debt in 2015. It now holds 25% of such debt. The Bank of England now holds 27% of UK government debt. Thus it would be incorrect to describe the low rates of interest on debt as market determined. The flat slope of the yield curve is under central bank control and they are likely to want to keep it that way, because there is no inflation or higher interest rates in sight. Economic revival is their priority.
When will the splurge of (always popular) spending end, while it can still be financed so cheaply? Only when and if inflation rears its ugly head again. And politicians and central banks may then do what their electorates have demanded in the past from post-war regimes: bring inflation down by raising interest rates and reducing money and credit growth (especially by governments) to better balance supply and demand in the economy. Inflation therefore will have to rise, surprisingly and sustainably so, before interest rates do, as the Fed has clearly indicated this week. Asset price inflation in such circumstances should not come as a surprise.
Relative and real – the price of goods, services and the rand
In goods and services as well as in currencies, it’s the relative price that matters
When it comes to prices, what matters is whether a good or service has become relatively more or less expensive, rather than the absolute price. Relative prices can change a great deal even as prices in general rise consistently or remain largely unchanged.
For example, the prices of food and non-alcoholic beverages in SA have risen much faster than the price of clothing. Since 1980, the prices of the goods and services bought by consumers have risen on average (weighted by their importance to household budget) by 31 times. Clothing and footwear prices are up a mere 8 times over the same 40 years. And food prices have increased 43 times since 1980, making food about 5.4 times more expensive than clothes.
Consumption of goods and services
LHS: Deflators for different categories (1980 = 100)
RHS: Multiple increases (1980 – 2019)

Source: SA Reserve Bank Quarterly Bulletin, Investec Wealth & Investment
Inflation rates: All consumption goods and services, food and beverages, clothing and footwear (2010 – 2019)

Source: SA Reserve Bank Quarterly Bulletin, Investec Wealth & Investment
Other relative price movements are worth noting. Over the 10 years 2010 to 2019, furnishings and household equipment became 20% cheaper in a relative sense, while education has become 25% more expensive. Utilities consumed by households (water, electricity) have increased by only 6% more than the average consumer good. Health services (surprisingly perhaps) have only become 3% more costly in a relative sense. More powerful pharmaceuticals and less invasive surgical procedures may well have compensated for these above average charges. Communication services have become about 37% cheaper in a relative sense, helped of course by the price of many a phone call falling to zero.
Relative prices (individual price deflators / consumption goods deflator) (2010 = 1)

Source: SA Reserve Bank Quarterly Bulletin, Investec Wealth & Investment
Businesses that serve consumers (retailers and service providers) are likely to flourish when passing on declining real prices. Producers are likely to suffer declining profitability as the prices they are able to charge decline, relative to the costs they incur.
It will be the changing supply side forces that will dominate real price trends. Temporary surges of demand in response to changes in tastes that force real prices higher will tend to be competed away. Constantly improving intellectual property or technology can give producers the opportunity to consistently offer competitive real prices, yet sustain profit margins and returns on capital to fund their growth.
The dominance of China in manufacturing has been an important supply side force acting on real prices, for example on the real prices of clothing, household furnishings, equipment and communication hardware. Having to compete with lower real prices has decimated established manufacturers everywhere, including in SA though often to the benefit of consumers.
Predictably low inflation makes for more easily detected real price signals that consumers and producers should respond to. Unpredictable inflation rates make it harder for businesses to separate the real forces acting on prices from what is merely more inflation, common to all buyers and sellers.
There is however one important real price that shows no sign of stabilising. That is real value of the rand, in other words the rand after it has been adjusted for differences in SA inflation and inflation of our trading partners. The real, trade-weighted rand is now about 30% below its purchasing power parity level. SA producers exporting or competing with imports must hope that it stays as competitive, but there would be no reason to expect it to stay so. It is an important real price given that imports and exports are equivalent to 60% of SA GDP.
The real value of the rand moves in almost perfect synch with the market rates of exchange, which tend to be highly variable. The real and the nominal rand exchange rates have been almost equally variable. The average three month move in the real exchange rate calculated each month since 2010 has been 2.03% with a wide standard deviation of 19.8%.
For an economy open to foreign trade, this real exchange rate volatility adds great uncertainty to business decisions. It disturbs the price signals to which businesses must react. Until SA gets a higher degree of exchange rate stability, the price signals will remain highly disturbed, regardless of the inflation rate.
Quarterly percentage movements in the nominal and real traded-weighted rand exchange rate

Source: SA Reserve Bank and Investec Wealth & Investment
The SA bond market does not make a lot of sense. For borrowers, especially the RSA, to ignore the long end of the bond market would.
14th July 2020
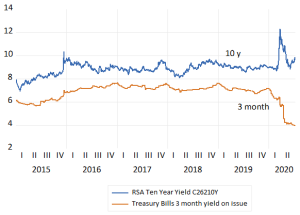
The SA bond market reacted sharply to the spread of Covid19 and the ever more likely prospect of a damaging economic lock-down. Long term interest rates were pushed higher earlier in 2020 in response to SA’s deteriorating fiscal trends even before the full damage to be caused by lock-downs to the economy and the budget deficits were recognized. Long rates then reversed as the crisis in financial markets passed by with lots of aid form central banks in the developed world. However the gap between long and short yields in SA had widened sharply and remained very wide, despite the bond market recovery, as the Reserve Bank cut its repo rate.
Fig. 1; RSA long and short rates Daily Data 2015-2020- July 10th
Source; Bloomberg, Iress, Investec Wealth and Investment
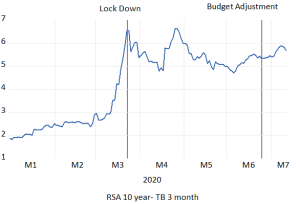
The RSA ten-year bond currently (July 10th) yields 9.67% p.a. while the yield on a three month Treasury Bill is 3.96% p.a. a positive spread of 5.67% p.a. This means that the slope of the yield curve is far steeper than at any time over the past 15 years. close to 10% p.a. Another way of putting this is that the SA taxpayer has to pay an extra 5.67% p.a. to borrow long rather than short.
Fig.2: The slope of the RSA yield curve; 10 year – 3 month yields. Daily Data 2020 to July 10th
Source; Bloomberg, Iress, Investec Wealth and Investment
On the face of it this would appear to be a very expensive exercise for the SA government to borrow for a longer-term rather than to roll over short term debt. Given the current strains on tax revenues and the rapidly widening fiscal deficit and the government borrowing requirements is it a choice the Treasury is likely to exercise? Or is it going to finance a much greater proportion of its growing debt at the cheaper short term end of the term structure of interest rates? We think the answer will be and should be yeas to this question. We will attempt to provide more insight as to the borrowing choices the SA Treasury is likely to exercise over the coming months and years.
The answer is perhaps less obvious than it appears at first glance. The expectations theory of interest rates would posit, with very good reason, that the long-term rate is but the average of the expected short term rates over the period of any loan. Hence in principle there would be no good reason to prefer long over short-term lending or borrowing. Borrowing long or short and having to roll over shorter term debts should be expected to turn out about the same for borrowers or lenders with choices.
However, if interest rates at the short end rise faster than expected, borrowing long (and lending short) would turn out to be the better option. And vice versa if interest rates were to rise less than expected borrowing short and then rolling over short term debt would have been the better option. As would lending long.
The chances of unexpected fast or slow increases in short rates over the relevant period must be about the same- if the market behaves consistently with the consensus of expectations. Choosing to borrow short or long or lending long or short, given the freedom to choose either option, then represents speculation, the belief that the borrower or lender can beat the market, a belief that may turn out right or wrong- with the same probabilities- given the rationality of the expectations of interest rates.
This notion of equilibrium in the capital market surely makes sense, lenders and borrowers with the option to lend or borrow for shorter or longer periods would presumably expect to pay out the same or earn the same, one way or the other. If you could lend or borrow for three months at a time or for six months at an agreed rate today the expected interest, to be received or paid out over two consecutive three-month periods must presumably be the same as the interest rate fixed for six months. Thus the average (compounding) interest received or paid if the contract was fixed for three months at a known rate and then re-negotiated after three months at a rate, only to be known in three months time, must be expected to be the same. If the current three- month rate is below the six-month rate then it follows that the three months rate in three-months must be expected to rise to make the expected returns on the interest paid or received equivalent.
If this is not the case there would be every incentive to borrow or lend for longer or shorter periods depending on which was expected to suit better. It is the attempts to minimize or maximise interest paid or received that eliminates any such obvious market beating opportunities.
Thus according to the theory, if the three-month rate is below the six-month rate, then the three- month rate must be expected to rise above the current fixed six month rate in order to average out at the higher rate. Thus a positively sloped yield curve, long rates above short, implies that short rates are expected to rise above the current longer term rate over the duration of the lending and borrowing contract. And vice-versa if the yield curve is sloping downwards, short rates must be expected to fall below the alternative longer fixed-term rate. The same logic applies to longer term contracts. If the ten year RSA bond yield is above the yield on a five year bond, the five year bond yields will be expected to rise over the ten year period enough to provide the same expected, compounding, average return.
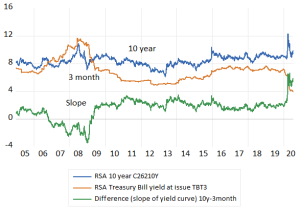
The RSA yield curve has had a consistently positive slope since 2005 with the exception of the boom period of 2006-2008 when short rates rose sharply and the rapid growth in the economy was clearly expected to slow down and bring lower short rates with it. As transpired with the aid of the Global Financial Crisis and the recession in SA that followed. As may be seen in the figure below the slope of the RSA yield curve has been at its most positive in 2020. It would therefore for almost all of this period been helpful to have borrowed short rather than long.
Fig.3; Long and Short Term interest rates in SA and the Slope of the Yield curve. Daily Data 2005- July 10th 2020.
Source; Bloomberg, Iress, Investec Wealth and Investment
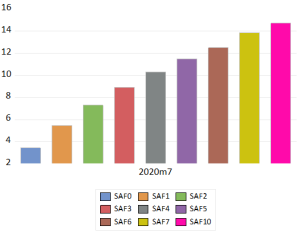
The slope of the term structure of interest rates, the differences between longer and shorter yields, allows us to interpolate the shorter-term interest rates expected in-between. Thus for a portfolio manager at a SA insurance company to prefer the 3.44% p.a. received currently for a 12 month RSA Treasury Note Bill rather than the 7.07% on offer for a RSA bond fixed for five years, or the fixed 10.05 % p.a. available from a ten year RSA bond, must mean that the one year yield is expected to rise sharply over the next five or ten years. That is to make lending short rather than long the sensible choice to make.
To provide equivalent returns lending long or short and rolling over each year the one year rate (now 3.4%) would have to more than doubled to 7.31% in two years. Then increased further to 8.91% after three years and then on to to 11.5% after five years. After ten years the one-year rate would need to be as much as 14.75% to make preferring one-year loans to five or ten year ones the sensible decision. (See figure below)
Fig.4; RSA one year (forward rates) implicit in the current slope of the yield (for on to ten years)
Source; Thompson-Reuters, Investec Wealth and Investment
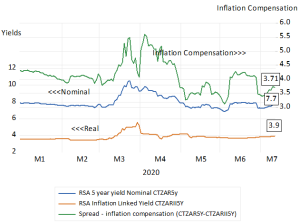
It is very difficult to reconcile such expectations with the likely reactions of the Reserve Bank over the next few crucial years. The outlook for GDP growth is very grim and the expectations for inflation over the next few years remain highly subdued. The compensation for taking on inflation risk in the RSA bond market is currently only an extra 3.9% p.a. to be earned over five years. That is 3.9% is the extra yield available from a nominal 5 year bond over its inflation protected alternative.
Fig.5; RSA nominal and real 5 year bond yields and their spread- inflation compensation for five years.
Source; Bloomberg, Investec Wealth and Investment
Therefore if we subtract this estimate of average inflation expected over the next five years implied in the bond market, from the one year interest rate expected in five-year’s time, we get an after inflation expected return that year 5 of about 6%. This measure of inflation expected is now very close to actual inflation. As are the inflation expectations surveyed and reported by the Reserve Bank and forecast by them. They will all have declined further since the beginning of the year given the global pressures on inflation and the likely reluctance of SA households and firms to spend more over the next few years.
It is very difficult to imagine that the SA economy will be strong enough, or the Reserve Bank aggressive enough, over the next few years, to tolerate real interest rates of the order implied by the yield curve and the spread between nominal and real yields now available in the bond market. Therefore many borrowers, especially the SA government, is surely likely to take the risk that short term interest will not rise nearly as rapidly as implied by the current slope of the yield curve. After all short-term rates are directly controlled by the Reserve Bank itself.
Borrowing long can be avoided and the growing SA government debt can much better be funded short rather than long, and by rolling over short term debt for as long, provided the level of long-term rates remains where they are. Drawing further on the government deposits at the Reserve Bank is a further low interest cost option. The Reserve Bank can also provide the banks with enough extra cash, on favourable enough terms, to have them support the growing market in short-term debt. Any reduced supply of longer-term paper will help take pressure off longer term yields.
For the government to elect to borrow long rather than short in current circumstances would surely now seem the wrong, very expensive option. The current state of the bond market could be argued to be something of an aberration in a world of global bond markets that have been monetized to an extraordinary degree. In the longer run the task for the SA government is to prove to the world that it can manage its debt in a sensible way. This means convincing potential lenders that it can bring government spending closely in line with its ability to raise tax revenues. This will help to bring down the long-term cost of raising RSA debt. In the short term, until the crisis is over, and the economy normalizes, what is called for from the government and its Reserve Bank, is the ability to manage the unavoidably larger national debt and short-term interest rates in a sensible way. If we call it good debt management rather than money creation- that it will be to some degree- then so describe it that way
The pandemic of debt
How to get SA growing again post Covid-19
https://www.youtube.com/watch?v=TNxqk1XX2GI&feature=youtu.be
Fear debt – not raising equity capital – when it makes economic sense.
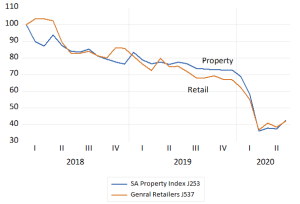
The threat to the value of SA retailers as cash has drained away during the lock downs has been as damaging to their landlords. The value of the average market weighted general retailer and property company on the JSE is less than 40 % of what they were worth in January 2018. The damage to the balance sheets of the property company of Covid19 is perhaps far greater than that of the average retailer. Who have shown a greater willingness to raise fresh equity capital to repair their balance sheets
The Value of JSE listed Property Companies and General Retailers January 2018 =100 Month end data to June 2020.
Source; Iress and Investec Wealth and Investment
A number of these JSE listed Real Estate Investment Trusts (Reits) with seemingly little growth in expected to come from SA assets, sought faster growth offshore. These offshore investments were funded very largely sometimes exclusively with foreign currency denominated debt.
The market value of average JSE Reit assets less debts, their net asset value (NAV) had fallen away before the Covid crisis that then decimated their rental revenues at home and abroad. A number of these JSE listed Reits now lack a sufficient buffer of equity to absorb the losses from COVID 19 related shutdowns. Debt to market value ratios have risen and NAV fallen further.
To qualify as Reits and avoid corporate taxes they are required to pay out at least 75% of their income after interest and all other expenses. They are appealing for an exemption from the Treasury and the JSE to skip dividends to conserve cash and still retain their Reit status.
They might do much better to raise equity capital, if they can, issue more shares for cash and pay off foreign and domestic debts. Even if the saving on foreign interest paid is minimal, provided the rand holds up, the improvements to their survival prospects and so market value could be substantial. Shareholders supported by stronger balance sheets could be well served facing up to a reduction in cash distributions per share. They would receive less income per share, but with lower risks attached to expectations of future distributions, this could add value to all the shares issued – even when there are more of them.
The purpose in raising capital may be, ideally, to grow a business successfully. Successful businesses mostly fund their growth from the cash they generate from operations. More unusually they may have to raise additional debt or equity capital secure the survival of a still potentially successful business.
The same fundamental question needs to be asked in both circumstances. Will in other words the increase in the market value of the company, plus the dividends paid, both measured in extra rands come to exceed the amount of extra capital raised. also in rands. Plus something extra to cover the opportunity cost of the capita raised. That is will the investment of extra capital return as much as could be expected from any alternative, as risky, a SA investment? Equal that is to the return from the bond market plus an equity risk premium- of about 5% p.a. (About 13% p.a.) If so investors will get all their capital back – and more – and perhaps very quickly as share prices could respond immediately to the expectation of good returns to come.
Any potential capital raise needed to save or de-risk a business will be reflected in the ongoing survival value of a company. Any surprising refusal of its owners to refuse to supply extra capital, when needed to secure the business as a going concern, will provide a very negative signal and surely damage the share price. Preventing the downside will be part of the upside of any capital raise.
A successful secondary issue, especially when underwritten by bankers exercising due diligence, is perhaps an even stronger signal of favourable longer- term prospects for any company. More so than a rights issue supported by established shareholders with everything to lose. With a successful secondary issue raising capital for the right value adding reasons, established shareholders can expect to have a smaller share of a larger cake and be better off for it.
The obvious way to maintain the share of established shareholders in a company is to raise extra debt, rather than equity capital. But more debt, makes any company more risky, and may destroy rather than add market value for shareholders. Debt only looks cheaper than equity with hindsight, after the good times have rolled by. And the good times may not last- as we have been so cruelly reminded.
A time to demand and supply extra capital for capital hungry business – post Covid19
A PS on the fundamentals of capital raising
The past quarter has been record breaking. Records have been set in extra spending by governments measured as a share of (normal) GDP. For the developed world this additional emergency spending by governments has ranged between an extra 5 to as much as 15 per cent of GDP. Another record has been set in money created by central banks. Of the order of an extra 5 trillion dollars worth. Included in their current bout of QE have been substantial purchases of corporate debt.
The monetization of much debt has meant very low interest rates with which to fund rapidly growing fiscal deficits and rising debt to GDP ratios. Records are therefore also being set in the amount of cash raised by businesses. Since the end of March, U.S.-listed firms have raised a quarterly record beating $148 billion of extra capital. Monetary policy has made capital raising on a vast scale possible on increasingly favourable terms. And without which a strong recovery from the lockdowns would be impossible.
Loan guarantee schemes, provided to commercial banks by central banks backed up by their Treasuries, has been an important component of the financial relief promised. These loan guarantees – should they be fully required to offset defaults – which is not at all expected – are available on a very large scale. In normally fiscally conservative Germany extra government spending on relief is of the order of 15% of GDP while the loan guarantee provision is of the order of 30% of GDP. For the US the stimulus plan is equivalent to 7% of GDP with the guarantee adding another 8% of GDP to the package.
It makes every economic sense that ordinarily sound and profitable businesses in SA as elsewhere not be forced out of the economy for an inability to service or roll over their debts for reasons entirely beyond their control. And are able to start up again by recapitalising their operations – given how much capital has been lost during the lock downs
The South African economy has not benefitted from fiscal and monetary relief on anything like the scale offered elsewhere. The additional borrowing requirement of the SA government has surged to over 14% of GDP more than double the deficit planned in February as we learned from the Minister of Finance yesterday June 24th. Largely because largely because tax revenues have declined so sharply- by over R300b with further declines expected. Extra government spending on its adjusted Budget is estimated as but R36b.
Despite a relative lack of encouragement of the kind offered in the US and elsewhere to the market for corporate debt, the capital market in SA has been active. We have seen something of a flurry of capital raising by JSE listed companies. The issue of relevance to shareholders (and the banks underwriting the issues) is whether the extra capital intended to be raised can pay for itself. That is will the extra capital raised earn a return that will covers the (opportunity) cost of the capital raised. That is equivalent to the high long-term RSA bond yield of 8% plus a equity risk premium of 4% or more for the least risky of businesses- something ahead of 12% p.a. returns for the least risky of enterprises.
If the answer is a positive one a rights issue or indeed any secondary issue to raise capital or indeed debts – should go ahead. And the hope must be that the market immediately shares this justifiable optimism and re-prices the company’s shares accordingly. That is prices the businesses raising additional capital them now for more likely survival rather than extinction.
The same positive answer is required of any business large or small that needs to raise capital to resume business post-Covid. Will the essential extra capital raised cover its risk-adjusted costs? We must hope that the SA financial markets, especially the banks, can help meet these additional, calls for extra capital. The loan guarantee scheme offered by the Reserve Bank in SA is perhaps the best hope for business and economic rescue.
The government has the task of ensuring that the capital market is up to this vital task of funding both government and business on sensible terms. Without which the prospects for a post-Covid recovery in SA, absent fiscal stimulation, remain especially bleak. The burden of economic relief has passed to monetary policy.
Postscript on capital raising on the JSE
We have seen something of a flurry of intentions to raise additional capital raising by JSE listed companies. The latest by retailers the Foschini Group (TFG) and Pepkor in the form of rights issues to their shareholders. Mister Price (MPR) another retailer has also indicated an intention to raise more equity capital.
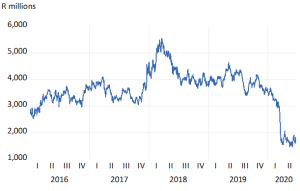
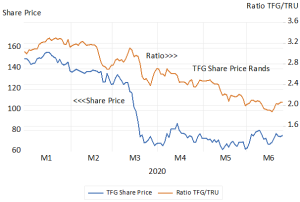
TFG announced plans on June 18th 2020 to raise R3.95b from its shareholders, equivalent to 22% of its current market value of approximately R17.5b. A market value that has shrunk by more than half this year on fears of exposure to Covid19 accompanied by a seemingly debt laden balance sheet. The market has however reacted somewhat favourably to the announcement. The share price has held up since the announcement and regained a little lost ground when compared to the Truworths (TRU) share price, a rival retailer. ( See below the figures that chart the market value of TFG over recent years and where we compare the TFG share price to that of clothing retail rival Truworths (TRU)
TFG Market Value of Company Daily Data; 2016- June 22nd 2020
Source; Iress and Investec Wealth and Investment
TFG Share price and Ratio of TFG to TRU share prices – Daily Data 2020 to June 24th
Source; Iress and Investec Wealth and Investment
The terms of the TFG rights issue (to be underwritten by a consortium of banks) will only be announced should the proposal gain shareholder approval on the 16th July. It should be understood that as a rights issue this extra capital cannot reduce the share of the established shareholders in the company, should they follow their rights. They may however prefer to sell such rights to subscribe extra capital. This benefit in selling the rights to subscribe can be regarded as compensation for giving up a share of the company’s profits and dividends and market value in the future.
The value of their rights will depend on the difference between the subscription price and the ruling market price. The larger this discount, the more shares will have to be issued to raise the required 3.95b – but only from its own shareholders. Hence there need be no dilution of shareholders. The market value of TFG must have increased by at least R3.95b for the shareholders to break even on their additional investment. They will be hoping for more upside over time. And some of the upside may even have been registered already in anticipation of the rights issue going through, even before the announcement of the rights issue itself, because of the better times it portends for the company.
The larger the difference between the ruling market price and the price at which the additional shares will be offered (the larger the discount) the more likely the rights will have value and be taken up. This outcome is only of importance to the underwriters. The more enthusiastic the response, the fewer shares the banks will have to take up. Presumably in this case the intention of the underwriters is not to hold shares in TFG.
A rights issue is equivalent to an additional investment by a sole shareholder in a company. The nominal value attached to the additional shares will be of no consequence other than to determine the number of extra shares issued, as identified in the books- all with the same owner. In practice the additional capital invested in a non-listed business is very likely to be identified as loan rather than share capital, to enable the owner to rank equally with other creditors in the event of a business failure
The issue of relevance to shareholders is will the extra R3.95b. of capital raised will pay for itself over time. That is earn a return over time on the R3.95b of additional capital that more than covers the cost of the capital raised. To add value for shareholders such future returns would need to average around 12-13 per cent per annum. That is to presume that the required returns from a retailer in SA would have to be at least equal to the returns certainly offered by a long dated government bond (currently about 9% p.a) plus a risk premium of 4% premium. They could hope to realise similar returns from any other JSE company taking similar risks with their capital. If the answer is a positive one, that is to say expected returns promise economic profits or economic value added (EVA) the rights issue or indeed any secondary issue (regardless of any dilution that might take place) should be approved.
There is a further consideration that established shareholders will bear in mind when approached for additional capital. The value of their shares will have declined in response to the damage caused to earnings and cash flow by the disruption of their ordinary activities caused by the lock down. Hence the need for additional capital. Companies that entered the lock down with relatively debt laden balance sheets will be recognised as more vulnerable to financial stress. However the prospect of a rights issue that would mitigate this danger would always be reflected, favourably, in the current value of the shares.
Any unexpected failure of shareholders to approve a share issue of this kind would surely raise the likelihood of default and immediately reduce the value of a shareholding. Not throwing good money after bad may be the right decision. But if it comes as a surprise to the market place such a refusal will provides a very negative signal. Vice versa if a surprising rights issue is successfully launched.
A successful secondary issue, underwritten by bankers, that does not demand participation by possibly jaundiced established shareholders, is perhaps an even stronger signal of favourable longer- term prospects for any company. The avoidance of dilution should not be a primary consideration in any capital raise. If the additional capital is expected to realise an economic profit, established shareholders will benefit in line with newly attracted shareholders. They can expect to have a smaller share of a larger cake and be better off for it.
The more obvious way to avoid dilution of established shareholders is to raise extra debt rather than equity capital. But the market for debt issues may not be as open as the equity market. As would appear to be the case in SA, but not in the USA. But more debt as we have seen makes any company r more risky. Andwhen business as usual is disrupted debt becomes particularly burdensome. Debt is not always cheaper than equity. It may appear so in the good times that may not last.
The same positive answer is required of any business large or small post Covid that needs to raise debt or equity capital to resume business post Covid. That is will it earn economic profits in the true opportunity cost sense? Will the investment beat its cost of capital, that is return more than is required to justify the investment? We must hope that the SA financial markets, including most importantly the banks, can meet these additional, fully justifiable calls for extra capital. The government with its central bank has the task of ensuring that the capital market is up to this vital task.
The Reserve Bank should follow the lead of its developed market peers (and some emerging market peers) in its response to the Covid-19 crisis
What is deemed to be right for the increasingly indebted developed world hoping to recover from the coronavirus – that is massive doses of extra government spending and money creation in support of government debt – is treated with suspicion when proposed or attempted by increasingly indebted emerging market economies, including SA.
We have argued that economies such as our own, which have suffered even more damage from the lockdowns, thanks to more widespread poverty and in the absence of capital reserves accumulated by households and businesses, need all the unconventional help they can get.
Not all emerging market central banks have taken the chastity vow. In Indonesia, as the Financial Times (FT) reported on 15 June: “Finance Minister, Sri Mulyani Indrawati, says quantitative easing and other policies are restoring confidence. Indonesia is at the forefront of emerging markets in implementing monetary policy that was once seen as the preserve of developed economies.”
The minister said that “Indonesia will use unprecedented quantitative easing and other emergency monetary and fiscal policies for as long as it takes to recover from the coronavirus pandemic, according to the country’s finance minister. With the private sector in retreat after weeks of lockdown, massive state spending was needed to shore up the economy”, adding that Indonesia would not rely on central bank financing in the long run: “That is not good policy practice.”
Brazil, according to the FT in another report (8 June) has granted its central bank extraordinary powers for the next 12 months, even though the Bank seems somewhat reluctant to employ them. Central bank President Roberto Campos Neto said he would not employ such measures until traditional tools had been exhausted:
The case for extraordinary policies is clear enough. When economies are allowed to normalise, hopefully extra demand will match extra potential supplies that then become available. Extra spending to accompany extra output can be assisted by extra government spending – on income relief and relief for lenders and borrowers. Money creation by central banks can make it cheaper to issue more government debt and to encourage banks to lend more freely. In the absence of stimulus, the willingness of firms to increase output and to offer employment on normal terms would be more compromised. They are unlikely to hold optimistic forecasts of revenues and profits upon which to budget. The case for stimulus is thus every bit as strong in the less developed world, including SA.
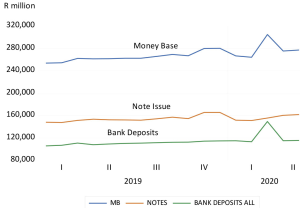
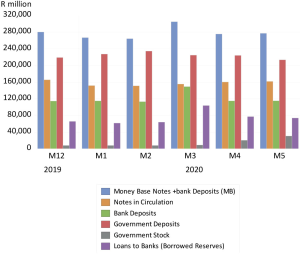
There is as yet no indication that the SA Reserve Bank sees the crisis as calling for anything like such a vigorous a response. It remains largely in conventional inflation-targeting mode. The supply of central bank money, notes in circulation together with the cash deposits of the banks with the Reserve Bank, defined as the money base or M0, sometimes more evocatively described as high powered money, did not increase at all since the end of last year to May 2020.
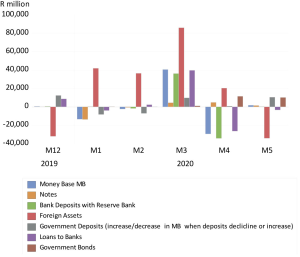
Government deposits are not part of the money base held by the public and the banks. An increase in government deposits reduces the money base and a decline will do the opposite, provided the drawdown is used to fund spending or debt repayments in SA. If, as appears to have been the case in May 2020, the payments by the government (drawing down its deposits) went to foreign creditors and so foreign banks, the SA banks will thus not have seen an increase in their cash reserves and deposits with the Reserve Bank. In May, the loans to private banks declined sharply – also reducing the money base. Thus, despite the purchase of an additional R10bn of government stock by the Reserve Bank, the money base in May was practically unchanged and no larger than it was in December.
In the charts below, we show the Reserve Bank balance sheet over the period since December and the monthly changes in some of the key items that move the money base – the notes in circulation plus the deposits of the banks with the Reserve Bank.
The money base in SA and its sources (December 2019 to May 2020)
Source: SA Reserve Bank Balance Sheets and Data Bank, and Investec Wealth & Investment
Reserve Bank balance sheet – monthly movements affecting the money base (December 2019 to May 2020)
What is called for is firstly a properly vigorous response to the crisis. It also calls for a credible commitment to a return to fiscal and monetary normality when the crisis is over, and when the economy is operating at something like its potential. That long-term growth potential surely has to be above 2% annual growth. To realise permanently faster growth, needs more than effective crisis management. It calls for reforms of the economy.
The rand and growing the SA economy. How not to waste the crisis.
Post the lock downs the patterns of household spending are widely expected to change permanently. How it will change is of overwhelming importance to almost all business that supply households or are once or twice or three times removed from making sales directly to households. The demand to fly to some holiday destination not only affects hotels, B&B’s, restaurants, airports, travel agents, airlines and car rental companies taxi companies and all they employ or contract with – it will have the most profound implications for Boeing and Airbus and all their component suppliers.
Household spending accounts for 60% of all spending in SA and 70% in the US and other developed economies. Absent the control and command of governments (very active in the lockdowns) the decisions of households to spend or save or borrow to spend always moves the economy in the one direction or another. The market-place, post-covid19, will make the same call on its suppliers to adapt profitably to changing tastes. And to innovate successfully. That is to lead household spending to their own portals, real or virtual, depending on what will work best and be rewarded accordingly.
There is every reason for governments and their central banks to ameliorate the economic damage of their own making and offer compensation for the loss of incomes from work- including for the owners of businesses. Governments have every reason to encourage the demand for all goods and services when they allow firms after the lockdown to do what comes so naturally to them. That is to freely compete for custom and for the resources, labour and capital and premises to help them do so. There is no more reason for governments to get involved trying to pick post-covid business winners or losers than they would have at any other time.
And to leave future taxpayers with as little a burden of interest to pay on the additional government debt that is being incurred. Printing money rather than issuing expensive debt (when debt is as expensive as it is for the SA taxpayer) makes very good sense. The inflation in SA that might ordinarily come with money creation is a long way away- that is until supply and demand, both so damaged by the crisis, can recover to something like their potential.
They say no crisis should be wasted. The crisis does provide an opportunity to stimulate what would be the most helpful source of growth for SA. That is export and import replacement led growth. The much weaker rand has made SA potentially much more competitive than it was only a few months ago. Adjusted for differences between SA and USA consumer price inflation the rand at USD/ZAR 17.50 is now about 50% undervalued Vs the dollar and about 18% more competitive with the US exporter or importer than it was at year end. A purchasing power equivalent dollar would now cost no more than R8.70 (See figure 1 below)
Fig.1; The USD/ZAR exchange rate and its Purchasing Power Equivalent[1] to May 27th 2020.
Source; Bloomberg, Investec Wealth and Investment
There is a strong case for retaining this competitive advantage. It is very easy to inhibit exchange rate strength should it materialize. The Reserve Bank can buy dollars with the rands it has an unlimited supply of. The Swiss National Bank does this all the time to hold back the Swiss franc. Furthermore buying dollars with rands would add to the supply of rands – it would be another form of money creation. And very helpful when every extra rand may encourage more spending and lending – so urgently needed for the recovery. Preventing exchange rate weakness should never be attempted.
In figure 2 below we chart the relationship between the purchasing power value of the rand and its market value. This relationship represents the real exchange value of the rand with lower values indicating real rand weakness, or equivalently greater competitiveness for SA producers, and vice versa. We compare the real rand dollar exchange rate using the Consumer Price Indexes for SA and the US and the real rand exchange rate as calculated by the Reserve Bank. This real exchange rate is adjusted for the prices of manufactured goods of our 20 largest trading partners (weighted by their importance in our trade) using the prices of manufactured goods as the basis of comparison. This ratio has not been updated since year end. Given the stronger dollar the depreciation of the real rand so calculated is generally less severe than the real dollar exchange rate. The nominal trade weighted rand has declined by 20% since year end and so the real rand is likely to have declined by a similar degree this year.
Fig2. The real rand Vs the US dollar and SA’s trading partners. (2010=100)
Source; Bloomberg, SA Reserve Bank and Investec Wealth and Investment
The value of the real rand is totally dominated by changes in the market value of the rand that fluctuates so widely and unpredictably. We compare quarterly movements in the market trade weighted value of the rand and its inflation adjusted value. As may be seen it is very much a case of the market exchange rate leading and the direction of inflation following. Rather than inflation leading to compensating changes in the market value of the rand. The so called pass- through impact of a weaker or stronger rand on prices in SA depends also on the direction of import prices in USD.
Especially important for the price level in SA is the dollar piece of oil that makes up a large percentage of SA imports- up to 40% at times. With oil prices as low as they are now the pass-through effect on SA prices and inflation is likely to be very subdued. Exporters from SA especially of metals and minerals that still make up a large percentage of SA exports are largely price takers established in US dollars. The weaker rand translates automatically into higher rand prices and vice versa. How much the weaker rand drives up the costs of our exporters and those suppliers who compete with imports depends very much on the direction of SA inflation. This is likely to remain subdued for now given the general weakness of demand for goods, services and labour.
It is not only the level of the real rand that matters for the real economy. Movements in the market value of the rand and hence its real value of great importance for operating profit margins are also of great relevance. The USD/ZAR and the Euro/Rand exchange rate has been almost twice as variable on average as the USD/Euro exchange rate. This year is no exception. We show below how the volatility of these exchange rates on a daily basis this year.
Managing this volatility of the rand exchange rate is a burden carried by SA exporters and importers and those who compete with exports and imports.. It adds to their costs of hedging exchange rate risk and the pure uninsurable uncertainty about the actual direction of the rand demands a discouragingly higher expected return on their investments.
Fig.3 Quarterly per centage movements in the Nominal and Real Trade weighted rand – lower numbers indicate rand weakness.
Source; Bloomberg, SA Reserve Bank and Investec Wealth and Investment
Fig.4; Volatility of the USD/ZAR, the USD/ZAR and the Euro/USD Daily Data 2020 to May 25th[2]
Source; Bloomberg and Investec Wealth and Investment
There should be two objectives for exchange rate policy during and after the crisis. Firstly, should the opportunity present itself, to inhibit rand strength to encourage domestic production and consumption. Especially since inflation will be looking after itself well enough and interest rates do not need a stronger rand to decline further. The very weak domestic economy is reason alone for still lower interest rates. Secondly, and a much more difficult longer-term exercise, would be to seek ways to inhibit exchange rate volatility that is such a burden on foreign trade.
[1] The PPP rand is calculated as USD/ZAR in December 2010 (USD/ZAR=6.31) multiplied by SA CPI/US CPI) 2010=100
[2] Volatility is calculated as the 30 day moving average of the Standard Deviation of daily percentage movements in the exchange rate
Interview on CliffCentral.com
Interview with Brian Kantor on CliffCentral.com, discussing the impact of the Covid-19 lockdown: http://cliffcentral.com/gcs/gareths-guests/professor-brian-kantor/
Is it time for money creation on a significant scale in SA?
Funding extra government spending via loans from the central bank, can be a helpful form of government finance when spending is growing rapidly to meet an emergency.
Today is a time of epidemiologists, central bankers and yes, of schemers too. We will discover in due course whose reputations will have survived the economic crisis better intact.1
Central banks have an essential duty to create extra money for a growing economy. They do so on a consistent basis in normal times. Their extra money comes in two forms: as notes and coins and in the deposits private banks keep with their central banks.
The SA Reserve Bank has not failed in its duty to supply more cash to the economy over the past 20 years. For much of the period it might have supplied too much cash. More recently, it can be criticised for supplying too little for the health of the economy as we shall demonstrate.
The sum of the notes and the deposits issued by the SA Reserve Bank (the money base) grew by 7.9 times between 2000 and April 2020, from R35bn to R275bn at an average compound rate of 8.7% a year over 20 years.
Source: SA Reserve Bank and Investec Wealth & Investment
1 With apologies to Edmund Burke, responding to the excesses of the French Revolution: “Today is a time of sophists, economists and schemers.” – Reflections on the French Revolution
Figure 2: Calculating the money multiplier – the ratio of broad money (M3) to central bank money (money base) 2000 to 2019
The Reserve Bank balance sheet has been updated to April 2020. The money base (notes plus bank deposits) as at the end of April 2020 was in fact R5bn smaller than it was at 2019 year-end, despite the crisis. The money base fell by R29.4bn between March and April 2020, even though the note issue itself rose by R4.82bn in April, surely in response to crisis fears. The deposits of the banks however fell more sharply, from R103.4bn in March to R77.34bn by April.
The Reserve Bank’s portfolio of government stock, a small part of its asset portfolio, grew from R8.1bn at year-end to R20.6bn in April. This may be compared to loans made by the Reserve Bank for the banking system. They grew from R65.8bn at year-end to R103.9bn by March, but then (surprisingly in the crisis circumstances) fell back to R77.34bn by April month-end.
If the Reserve Bank were to embark on meaningful money supply growth loans to the banking system, its holdings of government stock would have to increase meaningfully. An increase in Reserve Bank lending to the banking system on favourable terms would allow the banks to support extra issues of short-term Teasury obligations at hopefully much lower rates of interest (see figures below for details of the balance sheets of SA banks since 2000 and of the Reserve Bank balance sheet this year).
Figure 3: SA banks deposit liabilities (M3), and uses and sources of cash
Source: SA Reserve Bank and Investec Wealth & Investment
Figure 4: The Reserve Bank balance sheet (selected items) to April 2020
Source: SA Reserve Bank and Investec Wealth & Investment
There is always a temptation for a government to borrow money from its central bank to fund its expenditure by issuing money. Almost zero cost money may be issued as an alternative to raising taxes or paying interest on the debt it raises to fund its expenditure. It is a temptation that is widely (but not always) resisted.
How much money should be created as a service to an economy and its banks that manage the payments system? The answer in very general terms is for a central bank to supply not too much and not too little cash for the economy. Not too much – that is not to supply more than the households, businesses and banks would willingly hold as a reserve of spending power. But to supply enough extra cash to satisfy demands that would grow normally in line with real economic activity.
It is not the supply of money and of associated bank and other credit that represents inflationary dangers or the danger of asset price bubbles that must all end badly for an economy. It is the excess of the supply of money – over the willingness to hold the extra money supplied – that is to be avoided if inflation is to be controlled.
Also to be avoided is to supply too little money. If the supply of extra money is constrained, economic actors would be inclined to cash in assets or save more to build up a cash reserve. This too would not be good for an economy.
The task central banks set themselves is to smooth the business, money and credit cycles by adjusting the cost of the money they supply to the economic system. They raise the repo or discount rates they charge the banks who borrow from them, when the economy and the supply of bank credit appears to be accelerating too rapidly. They will also lower the cost of their money, reduce the repo or discount rates, to encourage the banks to extend more credit to avoid or overcome a recession. However this fine balance of additional supplies of and demands for money is seldom achieved. The business cycle has not been eliminated by modern monetary policy.
The business cycle – extended periods of above and then below potential real growth – can be mostly linked to phases of more rapid and then much slower growth in money supply and bank credit. Inflation, for which a central bank usually has a target range, will tend to follow the direction of the business cycle.
The times when the price level takes a course independently of the direction of the business cycle calls for particularly sensitive attention by the monetary authorities. Raising interest rates in response to a supply side shock to the economy that results in temporarily higher prices (for example following a shock to the oil price, food supplies or to the exchange rate) may well prove to be pro- rather than counter-cyclical. It may slow the economy down further than it might otherwise have done.
These norms and objectives for monetary policy do not apply in the extremes of a crisis, when sudden demands for extra cash threaten the banking financial and payments system. The solution for a crisis is for a central bank to supply as much extra cash as is necessary to prevent ordinarily sound businesses and financial institutions from going under and dragging the economy down with them.
Shutting down an economy to fight a pandemic is a new challenge for monetary policy. It also calls for a rapid increase in the supply of central bank money and sharply lower interest rates where there is room to lower them.
Funding extra government spending via loans from the central bank, or funded by a banking system well supported with loans from the central bank, is a helpful form of government finance when spending is growing rapidly to meet an emergency, and correctly so. Funding with money or near money avoids the long-term burden for taxpayers of funding extra debt issues at high interest rates in an unwilling capital market. And by adding extra money to the system, it makes a much-needed recovery of spending more likely when the economy comes out of lockdown.
The extra money cannot be inflationary until the economy and spending recovers. At that point, the growth in the supply of money and credit can be reduced or reversed in the usual way.
When an economy is forced to its knees, an emphasis on inflation targets makes little sense. SA urgently needs and deserves (proportionately) as much extra money as is being provided in the developed world. By contrast, the money base in the US has been increased by 40% this year with more money on the way.
