Stock markets and the US economy: Improving outlook all round

Stock market volatility trends lower

We have pointed to two possible developments that would assist a further recovery in global stock markets from which the JSE and the rand continue to take their cue. The first was a further reduction in stock market volatility allowing less risk to be priced into equity values. We had attributed the stock market recovery from its March lows to a decline in volatility from extraordinary agitated levels. Our sense was that volatility measures remained elevated and so provided lots of room for further improvement. Risk aversion registered on the US stock market has continued to decline as we show below and the influence on the equity markets has been predictably helpful as we also show.

Implied and realised volatility of the S&P 500, 1 April to 16 July 2009

Cont_1.bmp

Source: I-Net Bridge and Investec Private Client Securities

Volatility (the VIX) and the S&P 500, May – July 2009

Cont_2.bmp

Source: I-Net Bridge and Investec Private Client Securities

Economic forecasts are being revised higher

The second development that we thought would help take the markets higher would be an upward revision of economic forecasts. The economic outlook we thought would not have to be absolutely good, but in the estimation of credible forecasting agencies, central banks and their like, should appear less damaging.

We have had such upward revisions earlier from the OECD as well as better news about the US and especially the Chinese economy, where growth stimulated by domestic spending encouraged by bank lending seems very robust.

This week the Federal Open Market Committee (FOMC) released the minutes of its June meeting. Compared with the sense of the economy the Fed Staff reported to the FOMC at the May meeting, their tone was much improved. We quote a selection from these minutes below.

Minutes of the Federal Open Market Committee

June 23-24, 2009

…….Real personal consumption expenditures rose somewhat in the first quarter after falling in the second half of 2008, and available data suggested that spending was holding reasonably steady in the second quarter. On the basis of the latest retail sales data, real expenditures on goods other than motor vehicles appeared to have risen slightly in May and to have changed little, on net, since the turn of the year. Sales of light motor vehicles in April and May were slightly higher than the first quarter average. Real outlays on services were reported to have picked up some in April from the average monthly gain seen over the first three months of the year. The fundamental determinants of consumer demand appeared to have improved a bit: Despite the ongoing decline in employment, real disposable personal income rose in the first quarter and posted another sizable gain in April as various provisions of the American Recovery and Reinvestment Act of 2009 boosted transfer payments and reduced personal taxes.

In addition, equity prices recorded substantial gains in April and May, reversing a small portion of the prior wealth declines. Measures of consumer sentiment, while remaining at levels typically seen during recessions, improved markedly from the historical lows recorded around the turn of the year……..

http://www.federalreserve.gov/monetarypolicy/files/fomcminutes20090624.pdf

The important feature of this report is that consumer spending in the US, accounting for a very large portion of total spending, has now stabilised. While spending has stabilised, the output of goods and services has been managed significantly lower, with additional unemployment being one of the unfortunate consequences of the adjusted budgets and operational plans of US business. Yet in aggregate the current depressed levels of production are running well below current, not so depressed levels of final demand.

Demand is now running ahead of supply

This means inventories of goods on the US shelves and in the production pipelines must run down. If so this will lead in turn to a revival of order flow and in turn higher levels of production and output with favourable influences on hours worked and later also on employment.

Outside of the financial sector, the average US company is being well managed for weaker demand. Balance sheets are typically sound having been bolstered by an unusually high share of profits in GDP that were realised over the past decade. In general, again outside of the much disturbed financial sector, the bottom line of the average US company has indeed held up better than the revenue line.

Will the consensus about the pace of US recovery be surprised on the upside?

The consensus is firmly for a very gradual recovery in output from what is now widely accepted to have been a bottom for the business cycle in Q2. That residential housing activity is now clearly picking up from its deep bottom will help reinforce this year. The consensus could well be surprised by the pace of new order flow and output gains from very depressed current levels. If so the flexibility of the non-financial US company to shed labour and adjust output in the face of unexpected reductions in their revenue lines, will again impress the observer and the potential equity investor.

The Reserve Bank has no more to offer

The Reserve Bank has indicated very clearly that it does not intend to provide any further relief for the hard pressed SA economy. Neither lower interest rates, nor quantitative easing, is on offer for the foreseeable future.

The Reserve Bank is relying on waiting to quote its release:

“….There are however signs that the downturn, both globally and domestically, may be nearing the lower turning point, but the recovery is expected to be slow and protracted…”

It added later that:

“….The composite leading indicator as compiled by the staff of the South African Reserve Bank increased slightly in April. The indicator suggests that the lower turning point in the cycle could be reached later in the year.”

We would agree that while the global economy may well have reached its lower turning point, we are not at all sure that the SA economy has done so. We do not share confidence in the predictive powers of a leading indicator much influenced by the stock market. The housing market is probably more important than the stock market in influencing the wealth and confidence of the SA consumer and trends there are not at all helpful.

The economy is very dependent on global trends

The reluctance to lower interest rates further or to engage in quantitative easing
(linked to attempts to restrain rand strength) has made the recovery of the SA economy dependent on global trends. The outlook for domestic spending remains bleak as the Reserve Bank has confirmed.

Unintended consequences

In response to the decision the rand responded favourably to the prospect of higher short term rates while higher long term rates followed short rates higher.

The compensation for inflation offered in the bond market, being the difference between the yields on the inflation linked government bonds and the vanilla variety (to which the Bank gives attention in its focus on inflationary expectations) rose yesterday. The yields on the inflation linkers declined reflecting the poorer growth outlook while the nominal yields rose.

A stronger rand and higher interest rates are surely not desirable outcomes of monetary policy settings. The stock market and also the exchange value of the rand however are responding to forces beyond the influence of SA monetary policy. The stock market is largely ignoring the deteriorating outlook for the earnings of SA economy dependent companies.

Global forces dominate the rand and the JSE

The dominant forces acting on the JSE and the rand are the direction of Emerging Equity Markets and commodity prices – they are running together in response to the outlook for the global economy. This outlook has improved significantly over the past few days in response to OECD economic forecasts that were revised higher rather lower.

The Reserve Bank is fighting inflationary expectations

The focus of the MPC statement was on inflation and inflationary expectations. The Reserve Bank argument against lowering interest rates is a familiar one. That is to contain inflationary expectations – even while recognising that the weak state of the economy – may well lead inflation lower. They also make reference to producer prices that are falling sharply and that unlike consumer prices, do decisively reveal the weak state of domestic demand as well as the influence of the strong rand on the competition for domestic producers. That producer prices might better reflect the thrust of monetary policy and that if they do, deflation may be a greater threat to the economy, does not receive consideration.

Are inflationary expectations self fulfilling?

The Reserve Bank is of the view that inflationary expectations are self fulfilling, even if the economy is suffering form excess supply rather than excess demand. The long run benefits of less inflation expected and therefore less inflation – as it is assumed – is thought to be the worth the short term sacrifices the economy has to make.

How the Reserve Bank could hold to this view now given producer prices, is very hard to appreciate. Our view is that inflationary expectations, when applying some naïve cost plus view of price determination, can only lead to permanently higher inflation when supported by a willingness of consumers to spend more.

The current unwillingness of SA consumers to pay more is obvious. The Bank also is well aware that the pressures on consumer prices are coming from prices that are regulated rather than market determined – and therefore well beyond the direct influence of monetary policy. Such price increases however act as a tax on expenditure and depress demands for less dispensable goods and service. Tax increases provide reason for lower rather than higher interest rates.

An alternative explanation for more inflation expected

The Reserve Bank might however consider another reason for the unhelpful trends in inflation expected, other than inflation trends themselves. That is a single minded focus on fighting inflation- in rhetoric perhaps more than in practice – is politically unsustainable. If so this is expected to damage the independence of the Reserve Bank to continue its fight against inflation over the long run. Apres moi le deluge is not an unrealistic conclusion, one leading to more inflation expected over the long run.

We share the view that low rates of inflation are helpful for economic growth in the long run. But to regard inflation as the end rather than the means of economic policy regardless of the state of the economy, is neither necessary or helpful to the cause. The decision of the Reserve Bank not to lower interest rates now will add doubts as to the usefulness of low rates of inflation when the sacrifices for it seem so heavy and do not make obvious sense. The political consequences of Reserve Bank inaction are not necessarily encouraging for the inflation outlook.

Monetary policy: How much room for manoeuvre?

Asking the right questions

The Monetary Policy Committee of the Reserve Bank will be asking this question of the economy today and tomorrow. They will be well aware that despite a severe decline in household spending (household spending declined at a real 4.9% rate in Q1 2009) net flows of capital to SA continued at near record rates, equivalent to 7% of GDP. All other things remaining the same, had spending growth been anything like normal, the flows of capital from abroad would have to have been even greater.

Avoiding the wrong answers

Perhaps it will be suggested by committee members that it would be unrealistic to expect capital flows of larger orders of magnitude – so limiting severely the scope for more household spending – and by implication the scope for lower interest rates that are urgently called for to encourage households to spend more and banks to lend more. We will argue that this would be the conclusion to draw from what is an inappropriate line of enquiry. Such thinking has caused the economy unnecessary distress in the recent past.

These are not normal times

Normally such a severe reduction in spending as occurred in Q1 2009, would have led to fewer goods and services imported, an improvement in the balance of trade and so less capital imported. The problem however was that the volume of exports declined at an even faster rate than real imports in Q1 – the result obviously of the global recession that reduced in particular demands for metals, minerals and motor cars from SA. The weaker trade balance dragged down GDP, which declined at a very depressing 6.4% rate in the quarter.

Spending in general held up in Q1 2009

However not all categories of domestic spending were in retreat in Q1. Surprisingly and somewhat anomalously, household spending on services actually grew at a brisk 7.5% rate amidst the consumer gloom – implying that spending on consumer goods will have declined at an over 12% annual rate. Gross fixed capital formation continued to increase, though at a very sedate pace compared to a year before, and government consumption spending also rose marginally.

Final demands, being the sum of household and government consumption spending and fixed capital formation, declined at only a net 1.5% rate. The disinvestment in Inventories of -R10.2bn, half the decline estimated for Q4 2008, meant that Gross Domestic Expenditure actually grew at a 2.2% annual rate in Q1 2009. (See the tables below sourced from the Quarterly Bulletin of the SA Reserve Bank June 2009)

Spending held up as did capital inflows and prices came down

Thus aggregate demand in general held up much better than aggregate output and this was made possible by robust capital flows. These capital flows also helped to strengthen the rand and by so doing lowered the rand prices of imported goods and services including capital goods. Without these more favourable trends in the prices of goods, particularly at the ports and the factory and farm gates, spending presumably would have been even weaker.

Cont_2.bmp

Cont_3.bmp

Cont_4.bmp

Guesses about the pace of capital flows have been wrong and may continue to be wrong

Trying to second guess the ability of the SA economy to attract capital and to set monetary and fiscal policy accordingly is in our view quite the wrong way to steer the SA economy. Yet such concerns have been an important and unhelpful influence on monetary policy in the recent past. They led to a much weaker rand in 2006-7 as higher interest rates came to threaten the growth outlook for the economy.

The guesses about the attractions of the SA economy to foreign capital are very likely to be wrong ones. Such guestimates have almost certainly underestimated actual capital flows to SA in recent years. They have not taken into full account the favourable feedback loop from faster growth to increased flows of capital into account. If growth can be kept going with sympathetic monetary policy settings, that emphasise the objective of sustaining growth, more capital can flow in to make that growth possible. And more capital means a stronger rand and less rather more inflation to accompany faster growth. That the SA economy could attract net foreign capital flows, at the rate equivalent to 7% of GDP in a recession as it did last quarter, would have been inconceivable to balance of payments model builders.

The conclusion the MPC should come to

The conclusion we believe the MPC should come to about its room for manoeuvre is to do all it can to revive household spending. Lower interest rates combined with quantitative easing is called for. If this should however mean a weaker rand because the extra foreign capital is not forthcoming this would mean a weaker rand and so be it. This would unfortunately mean higher prices and counter the stimulatory influence of lower interest rates.

Do not second guess the rand

The rand however should not be the objective of policy either directly, when the Reserve Bank intervenes in the currency market, or indirectly when it makes judgments about the sustainability of capital flows and sets interest rates accordingly. The rand should be allowed to find a value that is consistent with achieving a good balance between potential and actual domestic output. This is the only proper goal for fiscal and monetary policy with low inflation seen as a means to this end rather than an objective of policy itself.

The rand as we have indicated may well stand up well if faster growth were achieved and so more capital is attracted. The Reserve Bank should never feel constrained by fear of capital flows when encouraging domestic spending providing such spending is insufficient to the purpose of maintaining potential output and employment.

Realism called for

Yet the MPC will have to be realistic about how much influence it can have today on the economy. Any immediate revival in domestic spending growth is unlikely even with lower interest rates and quantitative easing. The confidence and wealth of SA households have suffered too much recent damage to expect any immediate response. Paradoxically even if the MPC does not share our view of the world the thought that spending is unlikely to revive soon will encourage the Committee to lower interest rates.

Therefore the relief for GDP growth is much more likely to come from exporting into a reviving global economy than from household spending. We expect the MPC to cut its repo rate by 50bps and by another 50bps in July. Any deeper cut now would be very welcome to us and the markets.

Volatility update and what it means for the JSE

Investors will be well aware of the extremely wide daily moves on the JSE and other equity markets, such as the benchmark S&P. We show such daily moves below. It may be seen how volatile the markets became during the height of the credit market crisis in September 2008 and have become only partially less volatile since then.

Daily percentage moves in the S&P 500 and the JSE

Cont_9.jpe

Source: I-Net Bridge and Investec Securities

The average moves can only tell part of the story, especially when the movements higher are cancelled by falls in the market. It is the movements about this average that tell us about the extremely volatile conditions with which investors have had to cope recently. Movements about the average are captured by the statistic known as the standard deviation (SD) of a series about its average.

Measuring volatility

Between June 2005 and June 2008 the SD of the S&P 500 Index was less than one per cent per day on average, (0.08011 per day) to be exact. The SD of the JSE ALSI moved on average by 1.1% per day over the same period. Since then the SD of daily moves on the S&P 500 have more than doubled to 2.5% per day on average while the SD of the average daily move on the JSE have almost doubled to 2.1%.

In the figure below we show the volatility of the S&P, the JSE and the MSCI Emerging Market Index since 2005. We measure volatility as the 30-day moving average of the Standard Deviation of the Index. As may be seen the volatility on the different markets are highly correlated indicating just how well integrated global financial markets are. There are no places to hide in equity markets.

It should also be noticed that volatility has receded sharply from the extreme levels of September 2008. Volatility picked up again in January 2009 only to recede again in March. While now significantly lower than it was, volatility is still well above what might be regarded as normal levels, as may be seen below.

Global equity market volatilities

Cont_10.jpe

Source: I-Net Bridge and Investec Securities

Risks and returns – economic theory vindicated

Clearly the more volatile the markets the more risks faced by investors for which they will seek compensation in the form of higher returns. And so as we show below, as the risks increased dramatically so the markets fell away equally dramatically. The recent recovery in the ALSI and all the other equity markets – from their lows of early March – have clearly been associated with less risk. We show below the relationship between the JSE ALSI and the 30-day moving average of the standard deviation of its daily returns. The reduction in volatility has been very helpful for the market. Indeed, without the company of consistently lower volatility it is difficult to predict further consistent advances in the equity markets.

The JSE and its volatility

Cont_11.jpe

Source: I-Net Bridge and Investec Securities

Implicit and actual volatility compared

Another method for measuring volatility is to calculate the volatilities implied in the prices of options bought and sold on the equity market. In Chicago such an index known as the Vix is actively traded – so that volatility itself can be bought and sold. A similar measure of implied volatility is calculated for the JSE and published as the Savi. These measures may be regarded as forward looking measures of expected volatility, and can be compared to the actual volatility registered by the standard deviation of recent daily moves in the Index. As we show below these two measures of expected volatility that influence today’s share prices are also highly correlated, providing further evidence of the integration of global equity markets.

Implied equity market volatility – the Vix and the Savi

Cont_12.jpe

Source: I-Net Bridge and Investec Securities

In this case past performance of volatility does seem to be a very good guide to expected volatility. The 30-day moving average of the SD of the daily moves on the S&P 500 and the JSE Alsi tell very much the same story about volatility as we show below.

Volatility compared – SD of daily returns Vs the Savi

Cont_13.jpe

Source: I-Net Bridge and Investec Securities

Explaining volatility

Clearly returns and risk as measured by actual or implied volatility will move in consistently opposite directions as economic theory would predict. Higher returns after all are the expected rewards for bearing higher expected risks.

The cause of the surge in volatility in mid 2008 is obvious enough. The credit crisis made it near impossible to estimate with any degree of confidence the outlook for real economic growth and so for the earnings of listed companies. The economic outlook had obviously deteriorated but by just how much was impossible to say. Furthermore the credit market crisis itself did more than collateral damage to companies via the state of demand for their products. It made it much more difficult for them to raise finance and when finance was available it had become much more expensive. Thus risks of default and al it cold mean for the value of debt and equity capital increased markedly.

The issue of how to value the future income to be generated by a listed company became subject to most unusual difficulty. The difficulty the market has in estimating value shows up in sharp daily and even sharp intraday moves in share prices. Economic news in such circumstances becomes especially difficult to interpret and consensus about what it all means becomes especially difficult to reach. Hence much reason for changing opinions about the outlook for economies and firms that are reflected in volatile share prices.

Why volatility has receded

Volatility has receded in recent months because, while the outlook for the global economy has not improved greatly, there is much more confidence in economic forecasts. The downside seems now to have a bound to it compared with a few months ago when the downside seemed so difficult to estimate. The recovery in the credit markets has contributed greatly to this. Capital markets have not frozen. The appetite for corporate paper, offering perhaps only temporarily high yields, has been recovered. Companies are raising both debt and equity capital in a very much a normal way. Default risks have receded.

One senses that there is further scope for improvements in both the confidence with which the economic outlook can be forecast. Even if the news about the economy does not show any marked improvement, a stronger sense of what the future holds will reduce fear of the future and the volatilities associated with such fears. It will be much more helpful for equity investors when the forecasts themselves can predict economic recovery with a degree of confidence. If economic recovery comes more firmly into sight, default risks implicit in the still large interest rate spreads paid by corporate borrowers over governments, will recede further to the advantage of their bottom lines. With economic recovery confidence in the survival prospects of the will improve further to the advantage of the equity investor.

The interest rate outlook has become very clouded

One of the uncertainties to be resolved with any sustained economic recovery will be the future of government interest rates themselves. Short term interest rates will rise as economies recover and long term government bond rates will take their cue as always from the outlook for inflation. The outlook for inflation has become particularly difficult to estimate. Central banks in the US and Europe are pumping cash into their banking and credit systems to help encourage lending and spending. The cash in large measure is being hoarded rather than lent or spent. And so deflation rather than inflation remains the immediate threat to the US economy.

The path from deflation to inflation will be a difficult journey

But at some point with recovery, inflation will become the danger to be addressed by the Fed. The issue of whether the Fed can get its timing right to prevent actual inflation from rising is a live one. Good timing – from fighting deflation to fighting inflation – will be made all the more difficult by the surge in US government borrowing that will continue for years putting pressure on long term interest rates. Such pressure, when it occurs, will add temptation in the form of monetising the debt as a temporary alternative to the sting of higher interest rates.

Interest rate volatility

We show below just how much more volatile US long term government bond yields government have become. These volatilities also measured by the 30 day moving average of the SD of daily interest rate moves increased greatly in the midst of the credit crisis. They increased even as government interest rates fell which was result of the greatly increased demand for default free safe havens. But these volatilities remain highly elevated and such risks will not only influence the government debt markets, they will also make it harder for the equity markets to perform well. It is of interest to note that US bond yields have been a lot more volatile than long dated RSA yields

The volatility of long term government bond yields. USA and RSA

Cont_14.jpe

Source: I-Net Bridge and Investec Securities

Interest rates and the equity markets

In our view the uncertainty about the inflation outlook in the US and elsewhere and the direction of interest rates has already entered the equity markets, to its disadvantage. To be equity market bulls now would require optimism about the outlook for economic recovery and optimism in the ability of the Fed to negotiate successfully the fork in the road when it points to inflation rather than deflation. Furthermore the bond market will have to share this confidence in the excellence of Fed timing. This confidence would show up in lower volatility of interest rates. We will be watching trends in the volatility of equity markets and debt markets very closely as a guide to the direction of the equity markets.

Explaining quantitative easing and the case for its application in SA

 Introduction

 In this report we explain why quantitative easing has been called for in the US because the demand by banks to hoard cash has increased so dramatically despite lower interest rates. This demand for cash has meant less bank lending and a weaker economy. In South Africa the unwillingness of banks to lend has also to be countered for the sake of the economy. However the monetary problem locally, unlike the US, is the slow growth in the supply of cash rather than the increase in cash hoarded at he Fed. We call for a combination of lower interest rates and quantitative easing to revive bank lending and the SA economy

 Lower interest rates may not work if banks prefer to hoard than lend cash

 It is clear that reducing interest rates cannot on their own always revive an economy in recession. Central banks in the US and Europe have become ever more ready to freely assist their member  banks with cash at close to zero rates of interest. But the private banks have remained unwilling to borrow the cash. They have preferred to lend more to their central banks rather than borrow from them.

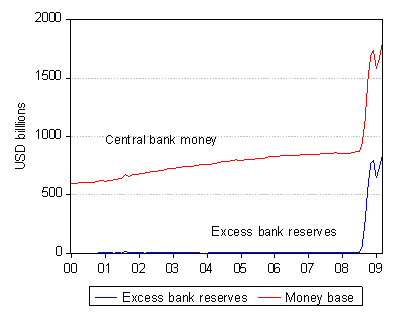
 As we show the US banks have come to hold cash reserves far in excess of their legal requirements to do so and this demand for cash has greatly inflated the supply of central bank money in the US being the sum of the notes issued by the Federal Reserve Banks plus the deposits of the bans with the Fed less the cash held to meet compulsory reserve requirements.

 US central bank money and excess cash reserves of the banking system

Source; Federal Reserve Bank of St Louis and Investec Securities Source; Federal Reserve Bank of St Louis and Investec Securities
 

The banking system is powering down rather than up

 This sum of central bank money is sometimes described as the money base of the system or more evocatively as its high powered money. This description indicates that increases in central bank money usually power up the supply of bank deposits in the system that are included in the broader definitions of the money supply (M1, M2, M3) But this can only happen when the banks lend out the cash. When the banks hoard the cash the system powers down rather than up as it is now doing.

 Thus quantitative easing

 Hence the call for quantitative easing to get the cash on the balance sheets of the central banks back into circulation so that it can help stimulate more spending as extra money normally does. The central banks eases quantitatively by utilising the cash it has on deposit to buy assets in the money and credit markets. This exchange of cash for assets, usually for securities issued by the government itself or government supported agencies, gets cash in the hands of those – unlike the banks – who are more likely to spend or lend rather than hoard cash. Judged by the recently improved ability of US and European companies to raise capital in the money, bond and lately also again in the equity markets, it does appear as if the global credit system is easing up in a most welcome way.

 Both the supply of and demand for money matters

 Recent developments in the money markets helps to remind us that what matters is not so much the supply of money but the excess supply of money, that is the excess of the supply of money over the demand to hold money. When the supply of money grows faster than the demand to hold more money  the extra spending then pushes up prices at a faster rate. And when the supply of money lags behind the demand to hold money you get the opposite – less spending and deflation. This is the problem for the developed world- the demand to hoard money has grown even more rapidly than the supply of money. The challenge central bankers will face in due course will be to reign in the supply of cash when the banks become more willing to lend and less anxious to hoard their cash.

 In South Africa the supply of money is growing far  too slowly

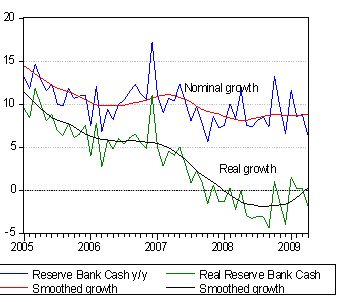
 While the SA economy is also performing well below its potential completely opposite conditions prevail in the money market. Unlike the case abroad, the growth in the supply of SA Reserve Bank money has been growing very slowly and far too slowly for the health of the economy. (See below) As we also show the growth in the supply of more broadly defined money, to include deposits issued by the commercial banks, has been decelerating sharply, as has the growth in the supply of bank credit to the private sector. The growth in M3 that was over 25%

in mid 2007 is now running at about 10% pa as may be seen in the figure below.  However this growth rate understates the recent sharply decelerating trend in the growth in money and credit. The March 2009 quarter to quarter seasonally adjusted rate of growth in M3 was but 6% and the growth in bank credit supplied to the private sector was but 2%. Clearly these growth rates are far to slow to help revive the SA economy.

 Growth in SA Reserve Bank Cash Supply


Source; SA Reserve Bank and Investec Securities

 South Africa; Growth in M3 and Bank Credit supplied to Private Sector


Source; SA Reserve Bank and Investec Securities


No banking crisis in SA – merely an economic crisis not helped by nervous banks. Quantitative easing called for

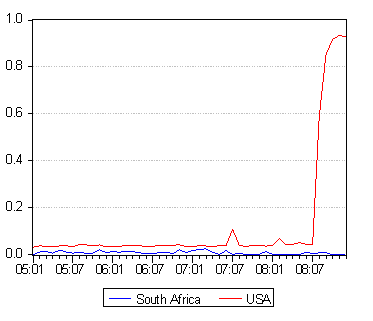
 South Africa has not suffered  from a credit or banking crisis. Banks in South Africa, unlike their US peers have therefore not increased their demand for cash reserves. The ratio of excess reserves to the supply of central bank money remains very close to zero as we show below.

 USA and South Africa- ratio of excess to required cash reserves of Banking System


Source; SA Reserve Bank Federal Reserve Bank of St Louis and Investec Securities
  But the SA economy is growing far below its potential. SA banks too are suffering from higher write offs for bad debts though nothing like the scale infecting the banks in the US. Yet much more important they too have become more reluctant to lend and this is adding to the weakness of the economy. Something therefore needs to be done to accelerate the growth in the supply of money and credit in SA . Lower repo rates, still far higher than levels in the developed world,  may not be sufficient to the purpose. Quantitative easing in fact is as much called for in South Africa as it is the US to encourage the banks to lend more.

 How best to ease quantitatively

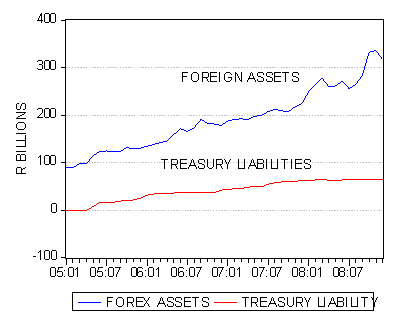
 The method to do so is at hand. That is for the Reserve Bank to counter unwanted rand strength with purchases of foreign currency. However the additional rands, used to pay for the  foreign currency, should be allowed to a greater degree to find their way into the market rather than be sterilised by the Treasury. Such sterilisation operations have taken place on a large scale in recent years to counter the growth in the foreign exchange and gold assets of the Reserve Bank. The Treasury has borrowed large sums, some R66b at year end to this purpose. The funds raised are then kept idle at the Reserve Bank and these idle balances then reduce the cash available to the private sector and prevent the money supply from increasing.

 SA Reserve Bank


Source; SA Reserve Bank and Investec Securities

Given the increase in the fiscal deficit and the ordinary borrowing requirements of the Treasury the idea of selling fewer interest bearing government bills and bonds for the purpose of restraining the growth in the cash supply should have additional appeal. The case for encouraging the supply of cash to grow faster in SA has become a very strong one. The SA economy needs both lower interest rates and quantitative easing to recover its growth momentum.

The US dollar as a reserve currency – the jury is out on this one

Reserve currencies – what they are


A much discussed topic lately is the role of the US dollar as a reserve currency. The US dollar is held as a reserve of international purchasing power or liquidity by governments, banks and firms. The US dollar is mostly nominated as the basis of contracts, as the unit for transacting and accounting purposes, across borders between parties outside the US. It was because of the large role played by US firms in global trade and finance that the US dollar became the reserve currency of choice in the twentieth century increasingly replacing the pound sterling as the predominant unit of account in international transactions. The pound sterling had gained this role because of the earlier dominance of the UK in nineteenth century global trade and financial flows.


Until the early seventies the US dollars held by foreign central banks could be exchanged for gold at the rate of 35 dollars per Troy ounce of gold. Since many other central banks also kept their gold at Fort Knox in Kentucky such transactions would take the convenient form of moving gold from one part of the fort to another. The US unilaterally went off the gold standard in 1971. The UK gave up its willingness to exchange gold for pounds finally in 1932 after earlier phases of inconvertibility during the Napoleonic and First World Wars and their aftermaths. Gold is still held as a minor source of international purchasing power by governments and their central banks – still often safely stored for them in Fort Knox.


Reserve currencies emerge in response to market forces


Reserve currencies are not declared by some international agency – they emerge in response to the global needs of trade and finance. The possibility of one reserve currency increasingly replacing another is clearly always possible given the freedom contracting parties have to nominate a convenient unit of account in which to conclude a contract. Governments and banks also have the freedom to choose the most helpful currency or currencies in which to hold their reserves of international purchasing power. These reserves are mostly kept in the form of US dollar deposits in foreign banks including other central banks. Reserves of liquidity are also kept by in the bills and bonds issued by the US government that pay higher rates of interest tan bank deposits.


The advantages to the issuer of a reserve currency


The advantage to the issuer of a currency or bonds or bills held as reserves by others is that these demands reduce their costs of funding government expenditure. The notes issued by a central bank are the non-interest bearing liabilities of the issuing central bank. That foreign holders of these notes, in addition to their  domestic holders, are prepared to forgo interest on the their cash – for the convenience it offers – including the ability to evade surveillance by tax authorities – makes issuing notes a particularly cheap source of finance for the government. A large proportion of the actual greenbacks are in fact held outside of the US so helping to fund US government spending.


The costs of issuing notes


Not that issuing the notes is without its costs – the costs are incurred in the protections the issuing government that have to take against counterfeiters as well as highjackers of cash in transit. Government have to insure the safety of the notes issue if economic actors are to be willing to hold them. The difference between the interest governments save by issuing notes rather than bills and bonds and their costs – including the costs of staffing their central banks – is called seignorage and is implicit in the dividends central banks declare to their governments. In South Africa unusually, this central banks income from issuing non interest bearing notes, is still shared in small part with some private owners of Reserve Bank debt in the form of a fixed coupon payment.


The essence of a well respected unit of account and reserve currency


Domestic currencies serve perfectly usefully as the unit of account for the many contracts entered into between domestic parties. Both domestic parties will be well aware of the real value of the contract when fulfilled. Clearly for a foreign currency to be nominated as the unit of account in a contract indicates that something must be considered unsuitable in the domestic currency by one or other of the parties involved. This unsuitability presumably arises out of the relative unpredictability of the exchange value of the domestic currency. Presumably reserve currencies must offer predictability in the rate they can be exchanged for domestic currencies.


Does the US dollar meet the criteria – does any other currency?


An essential quality of a reserve currency must be the predictability of its rate of exchange for all other currencies. It is surely this lack of predictability of the exchange value of the US dollar that calls into question its continued role as the predominant reserve currency. Clearly if a reserve currency strengthens this will be highly acceptable to its holders and vice versa will be uncomfortable when it generally weakens against other currencies. However even unpredictable strength will make the currency less useful for purposes of trade or finance. The requirement is rather predictability of value though predictable strength rather than predictable weakness will clearly to be preferred by holders of a reserve currency.


The US dollar has not been very predictable – not that it has been a one way bet


We show the exchange value of the US dollar against the other major currencies in recent years. Higher numbers indicate strength. As may be seen the US dollar was very strong in the mid eighties. It weakened sharply in the late eighties and traded at these weaker levels more or less stably until the mid nineties when a further period of pronounced strength emerged that was reversed over much of the past decade.


The US is extremely reluctant to commit itself to policies that would stabilise the US dollar at the possible expense of the US economy. But unless its attempts to stabilise the US economy help co-incidentally to stabilise the US dollar far better than has been the case over the past 30 years, the suitability of the US dollar or other US government liabilities as a reserve will remain a live issue. But no other currency has presented itself as suitable as is the US dollar for the purposes of undertaking global trade and finance.


Gold is still making a case as a reserve


No other country, or in the case of the euro, the European governments collectively, seem willing to commit to currency stability while also allowing currency convertibility. The Chinese may offer predictability in the yuan – but not easy convertibility. They fear how such a commitment could qualify them for reserve currency status. They are aware that such a commitment, even when believed, may constrain their freedom to manage their domestic economies. The contest for global currency supremacy can however never be regarded as decided as over. It remains up to the market place and government policies to decide the outcome. While the outcomes remain particularly uncertain as they now are gold is likely to retain its appeal as a contingency against the unpredictability s of other stores of value

FRED Graph


The SA Business Cycle: Hard numbers still pointing to lower levels of activity

Our Hard Number Index (HNI) can now be updated for May 2009 with the release of two hard numbers, vehicle sales and the notes issued by the Reserve Bank at May month end. As we show below there is no sign of any improving trend in the SA economy to be derived from the HNI. The Index attempts to replicate the pace of growth – higher numbers indicate that growth is picking up momentum that is accelerating while lower numbers indicate that growth is slowing down.

The HNI peaked in late 2006 at a value of over 165 indicating that the economy was then moving ahead at a very rapid rate. The latest reading for May 2009 is 106.06 and down from its 109.06 reading in April. This indicates that not only has the economy slowed down but that it is in now in reverse and probably going backward more rapidly than earlier in the year.

The HNI may be regarded as representing the first derivative of the economy. The second derivative, that is the rate of change of the rate of change in economic activity, is still pointing lower indicating little sign of a bottoming out in the pace of economic activity.

The Hard Number Index May 2009

Cont_1.jpe

Source: Investec Securities

The SA Business Cycle – The second derivative

Cont_2.jpe

Source: Investec Securities

New vehicle sales are still in decline

Vehicle sales in May provide very little cause for comfort that interest rate sensitive spending is responding to lower interest rates. The growth measured as the change in vehicles sold in May 2009 over May 2008 showed a further decline compared to April growth. More discouraging is that the underlying trend in vehicle sales is still pointing down rather than up. We calculate this trend by smoothing vehicle sales and then annualising the monthly growth in this smoothed measure.

Growth in New Vehicle Sales

Cont_3.jpe

Source: NAAMSA, Investec Securities

Not all bad news – the money cycle is pointing up

It is fortunately not all bad news. There is some consolation to be derived from the latest trends in the cash, that is Reserve Bank money supplied to the SA economy. Adjusted for the inflation trend, we can now observe an improving trend as may be seen below. Annual growth has turned marginally positive and the underlying trend has improved suggesting that a sustainable recovery in the supply of cash is under way. The driver of this series is lower inflation rather than any pick up in the cash supply itself as we also show. The growth in the actual cash supply (not adjusted for inflation) has been trending marginally lower as may be seen.

The real money supply cycle

Cont_4.jpe

Source: Investec Securities

The cash cycle

Cont_5.jpe

Source: Investec Securities

Is the Bank undertaking quantitative easing?

In this regard it is to be noted that the gross foreign exchange reserves of the Reserve Bank increased by a large US$1.724bn in May 2009. This indicates that the bank was very active resisting rand strength last month, notwithstanding the recent remarks from the Governor about intervention in the currency market. Of greater interest is that these purchases to not appear to have been sterilised by treasury open market sales of government securities.

The government deposits at the Reserve Bank that would indicate such operations actually fell in May to R66.153bn from R66.402bn in April. This may indicate that the bank and the treasury agree with us that quantitative easing, that is supplying the banks with more cash via operations in the currency market, to encourage them to lend more freely, is a good idea, given the weak state of the economy. A recovery in the supply of money and bank credit is essential to the purpose of reviving the SA economy.

Long term interest rates in the US: What they tell us about growth and inflation

The big story last week

The big market news last week was about the extraordinary volatility of long term interest rates in the US. The yield on the 10 year Treasury bond began the week at 3.4% then reached 3.8% on the Wednesday only to fall back again to 3.4% by the week end. Their current yield is 3.55%. The similarly dated inflation protected bonds moved broadly in the same direction though as may be seen the compensation for inflation risk assumed by the investor in vanilla bonds increased by 10bps to 1.9% in mid week to then fall back again and also end the week largely unchanged.

US 10 year Treasury Bond Yields – Inflation linked (LHS) and Nominal (RHS)

Cont_7.bmp

Source: Bloomberg and Investec Securities

Inflation compensation in the US government bond market – May 2009

Cont_8.bmp

Source: Bloomberg and Investec Securities

What happened to nominal and real yields these past twelve turbulent months

In the figures below we show these trends over the past turbulent year. As may be seen the gap between ordinary bond and inflation linked bond yields in the US closed almost completely at year end. Thereafter the inflation protected (TIPS) yields fell away while that of the ordinary bonds rose from their lows of 2%. Thus inflation compensation of 2.5% pa provided by nominal bond yields shrunk to about zero at year end from which they have recovered to their current levels that are still below 2%.

Explaining real and nominal yields

Ordinarily these real bond yields reveal the real state of the global capital markets. When the global economy is expected to grow strongly the extra demands for real plant and equipment and the capital to finance growth in the real capital stock pushes up real benchmark yields (these are well represented in the global capital market by the yield on US TIPS). When the economy is expected to slow down, demand for capital falls away and real yields decline again. Thus these real yields ordinarily are a very good indicator of the expected state of the global economy.

The increase in real yields that occurred at the height of the credit crisis surely requires a different explanation. It suggests that only the safest haven, vanilla bonds, issued by the US government escaped the liquidity pressures of that time. It may be seen below that nominal Treasury bond yields fell away while initially the TIPS yields rose again. That these yields came together again by year end suggests that fears of deflation rather than inflation came to dominate market sentiment.

US T bond yields May 2008- May 2009

Cont_9.bmp

Source: Bloomberg and Investec Securities

US bond market; inflation compensation 2008-2009

Cont_10.bmp

Source: Bloomberg and Investec Securities

Interpreting the bond market in normal times

Thus we may summarise the evidence provided by bond markets in normal times. The real yields provided by the inflation protected securities (TIPS) tell us about the state of the economy. The higher these yields the more promising is the global economic outlook. Thus the modest increase in real yields recorded recently does help confirm an improvement from the depressed state of the global economy.

The yields on vanilla bonds have to offer compensation for the inflation expected by bond holders. Any increase in inflation detracts from the purchasing power of the interest income bond investors depend upon. Therefore they seek protection from such losses in the form of higher yields. The difference between the higher yields on ordinary bonds and the lower yields on inflation protected bonds issued by the US government tells us just how much inflation protection or compensation the holder of vanilla bonds is receiving.

Winners and losers from unexpected inflation and growth

If inflation expected over the long term tenure of the bonds rises unexpectedly the holders of ordinary bonds lose out while the holders of the inflation protected bonds will gain. Vice versa when long term inflation turns out to have been overestimated by bond investors, and ordinary bond yields decline with real yields on the TIPS unlikely to be much affected by the inflation outlook alone.

These real yields will be affected however if more or less inflation expected is combined with changing expectations of for real economic growth. If more inflation is expected to slow the economy down, that is fears of stagnation with inflation (stagflation) become pronounced, ordinary bond yields will go up and real bond yields will retreat.

The holders of vanilla bonds will lose as the search for protection against more inflation forces nominal bond yields higher and the prices of bonds lower. The holders of TIPS will at the same time benefit from downward pressure on real bond yields and upward pressure on the market value of the TIPS, as the stagnating economy is expected to reduce the demand for capital and so the returns to be expected from all classes of financial securities, including equities. Vice versa less inflation should be associated with faster growth as economic theory suggests.

Thus holders of vanilla bonds fear inflation eroding their incomes. Holders of inflation linked bonds are completely protected against the risks of more or less inflation. However the costs of this protection will depend on the ever changing outlook for real growth and inflation. A combination of faster economic growth with very low inflation will drive real yields higher and so the value of the long dated TIPS lower.

With large government deficits the outlook for inflation and growth remains unusually uncertain – expect volatility

The outlook for global inflation is particularly uncertain at present – hence the extreme volatility of long dated government bond yields. The US government is planning to spend far more than the tax revenues it expects to collect – at the rate equivalent to 12%-13% of GDP over the next two years. This means a great deal more government borrowing and the government debt to GDP ratio is expected to double from its current ratio of 40% of GDP over the next ten years. This means an ever increasing share of US government spending will have to go to paying interest rather than providing for much more popular other forms of government spending.

Getting back to comfort levels is going to take a long time

Getting this debt to GDP ratio back to more comfortable levels any time soon is very unlikely. It will take a combination of a smaller government relative to the economy and higher government revenues. Given the weak expected state of the economy, cutting government spending will seem a particularly unpopular direction to take. Current spending increases inevitably become permanent entitlements. Furthermore, given the weakness of the economy any higher tax revenue to be raised would have to come from higher tax rates rather than a more buoyant economy. And higher tax rates in turn threaten the growth outlook. Thus the pressures on the US government to print money to fund its spending rather than face up to tough choices will mount.

The Fed will be called upon to act with determination and excellent judgment

It is the task of the independent US central bank, the Fed, to very actively resist monetising the debt. There is every good reason to expect the Fed to resist with all the powers at its disposal. However the Fed has already been printing money on a vast scale, not to fund the government but to help the credit and money markets overcome their liquidity fears. Overcoming these fears and the preference of the banks to hoard rather than lend the cash made available to them is essential if the economy is to recover.

The Fed therefore has unusually difficult seas to navigate successfully over the next few years. It must be able to resist monetising government borrowing that will be growing rapidly and borrowing that in time will come to crowd out private borrowers and capital formation by the private sector – diminishing growth prospects. It must also be able to withdraw cash form circulation as the propensity of households and firms to spend more gains momentum. Getting the timing right here so as not to nip any incipient recovery in the bud, while remaining steadfast in the face of higher levels of government spending and higher long term nominal interest rates, will not be easy for the Fed.

Expect volatility in government bond markets and for inflation linkers to be attractive

For all these reasons US and global inflation expected over the next ten years will prove very difficult to forecast with any degree of accuracy. Accordingly nominal government bond yields are likely to remain volatile, while the outlook for real growth remains subject to above normal degrees of uncertainty. If so inflation linkers issued by governments provide an unusual degree of comfort for potentially troubled and inflationary times.

Encouraging declines in risk aversion

It was not a good week for global equity investors with the Emerging Market Index down 2.4%, the S&P 500 down 5% and the small US cap Russell 2000 off nearly 7% by the weekend. The SA component of the MSCI EM Index fared relatively well and was 1.5% weaker in US dollars. The rand investor on the JSE suffered only marginal weakness with Industrials up 2% and Resources off a little more than 2%. The rand ended the week nearly 5% weaker vs the USD and on a trade weighted basis.

Continue reading Encouraging declines in risk aversion

No room for complacency about the state of the SA economy – aggressive policy action is called for

Grim news from the shop keepers

Retail sales statistics were updated yesterday 13 May. The state of the retail sector in March 2009 provides no comfort at all about the state of the SA economy. The statistics indicate that sales adjusted for inflation are still falling at an accelerating rate. Interpreting retail activity is always complicated by the Easter holidays that may come in March or April, as they did this year. We will need to wait for the April numbers to fully adjust for Easter.

Continue reading No room for complacency about the state of the SA economy – aggressive policy action is called for

How Keynesian are we?

Back from Davos

Maria Ramos, once Director General of the Finance Department, then CEO of Transnet and now of Absa and also incidentally newly married to long serving Minister of Finance Trevor Manuel, returned from Davos to tell us “We are all Keynesians now”

This is what Time magazine thought prematurely in 1965

This was in fact the heading of an iconic Time Magazine story written on 31 December 1965. Economists were then very confident that by fine tuning government spending and taxes, the Keynesian prescription, they could maintain full employment without inflation. Ramos might have been surprised that Time magazine in its “We are all Keynesians now” title was quoting none other than Milton Friedman. It was he more than any other economist who helped suppress the Keynesian revolution in economics.

Continue reading How Keynesian are we?