Dealing with Covid in 2020 was a frightening episode. The JSE All Share Index lost 20% of its value by March that year and the S&P 500, suffered a very similar drawdown, of 20% in USD. Yet something predictable then followed. Between January 2020 and July 2024 share markets have given very good returns and they have outperformed bonds and cash by large margins. R100 invested in the JSE immediately pre Covid with dividends reinvested, would now be worth R173. Had the R100 been invested in the S&P 500 it would now be worth significantly more R236. The same R100 if invested in the Bond Index or in a money market fund with interest reinvested would have grown to only R144 and R130 respectively.
Cumulative Returns by Asset Classes (2020=100)
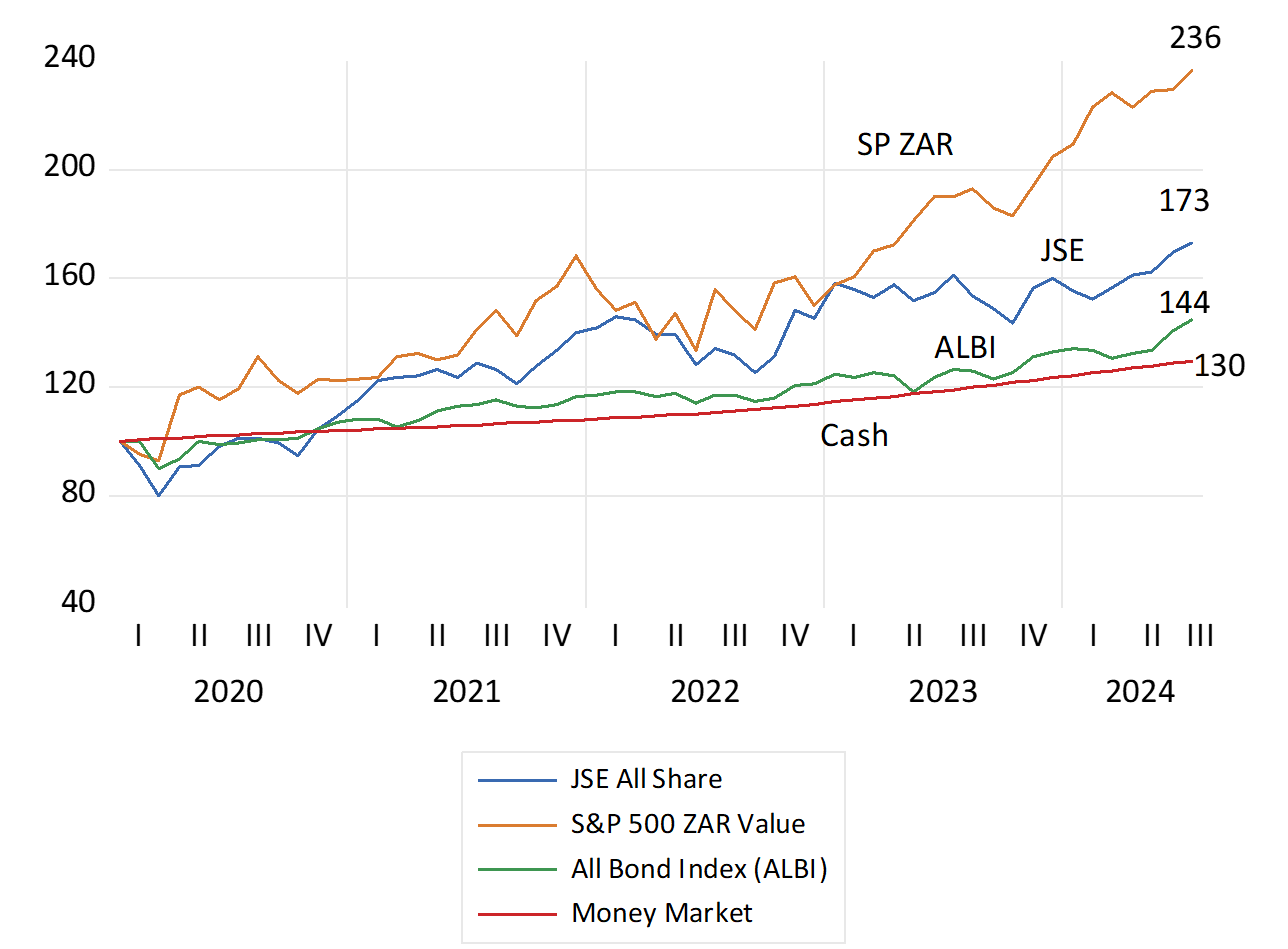
Source; Bloomberg and Investec Wealth & Investment
A predictable outcome–given the large outperformance by a representative share portfolio on the JSE since 2000, or for that matter also since 1980 or 1960. The R100 invested in the JSE Index in 2000 would have grown to R2152 that is by 21 times at an annual average rate of return of 13.12% p.a. The R100 in money market would have grown by 6.3 times and the Bond Index by 10.6 times over the same period. Incidentally the JSE has kept up with the S&P also measured in rands over these 24 years. The JSE outperformed significantly until 2010 and has underperformed since.
The JSE has therefore recovered very well from significant periodic drawdowns since 2000, 40% down in 2002, 51% in 2008, 24% after Covid and 15% with Fed tightening in 2022.
The JSE All Share Index Cumulative Returns (2000=100) Per Cent Draw Downs Indicated on X axis
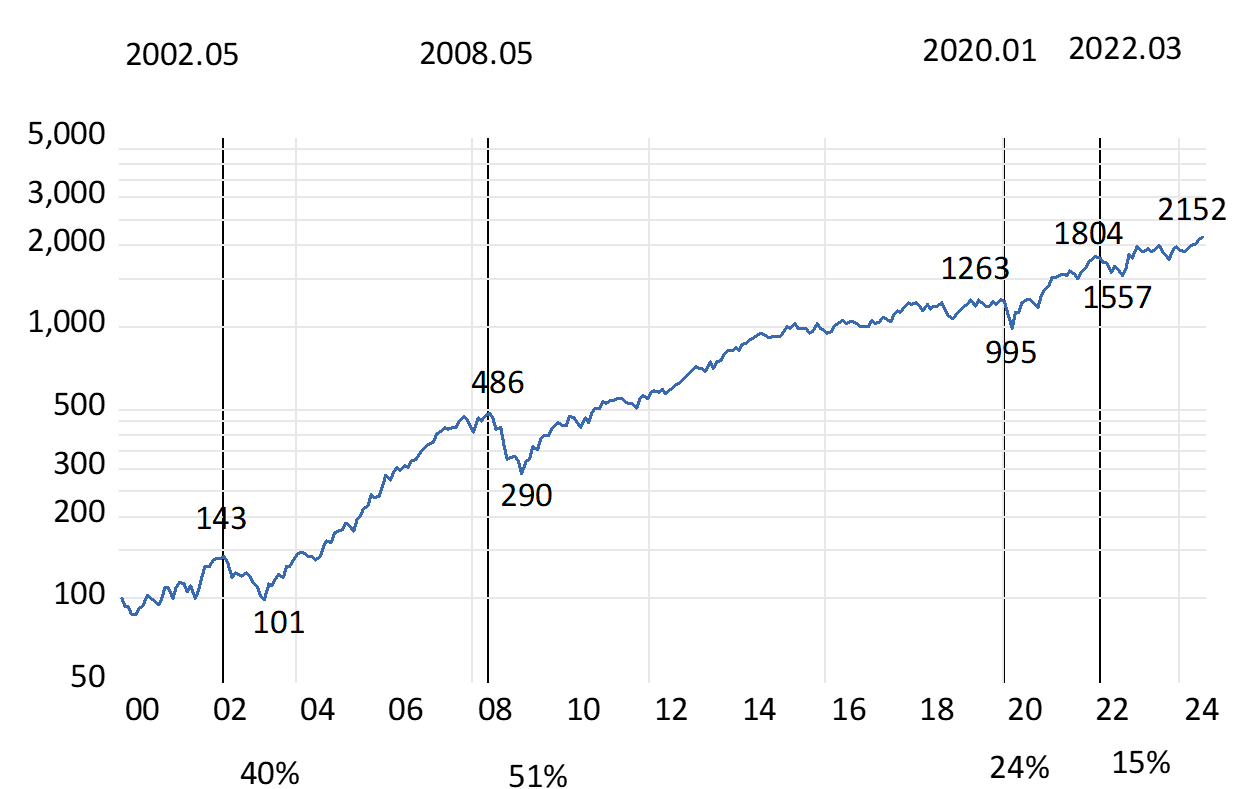
Source; Bloomberg and Investec Wealth & Investment
Equities are expected to give superior returns because they are more risky to hold than cash or bonds. The higher returns expected of equities compensate for the different risk of losses investors believe they are exposed to holding shares. Higher expected returns mean lower entry prices for investors, all else remaining the same. And these expected extra returns have been delivered to date by most Stock Exchanges.
Share prices move each day about an average of close to zero. They demonstrate a random walk with hopefully upward drift to give the expected positive returns over the long run. The more difficulty investors have in interpreting the news about a company or an economy, the wider are the daily swings in prices in both directions. This volatility gives rise to an objective measure of risk. It will be reflected in the cost of an option to insure against volatility. Investors can buy or sell a volatility index, the VIX, based on the underlying volatility of the S&P 500. When S&P volatility (risk) rises share prices fall. And vice versa They do so to improve or reduce prospective returns, in a statistically significant way. As has again been the case this year.
Risk and Return on the S&P 500 in 2024 (Daily % Moves in the S&P Index and the VIX) R = (-0.68)
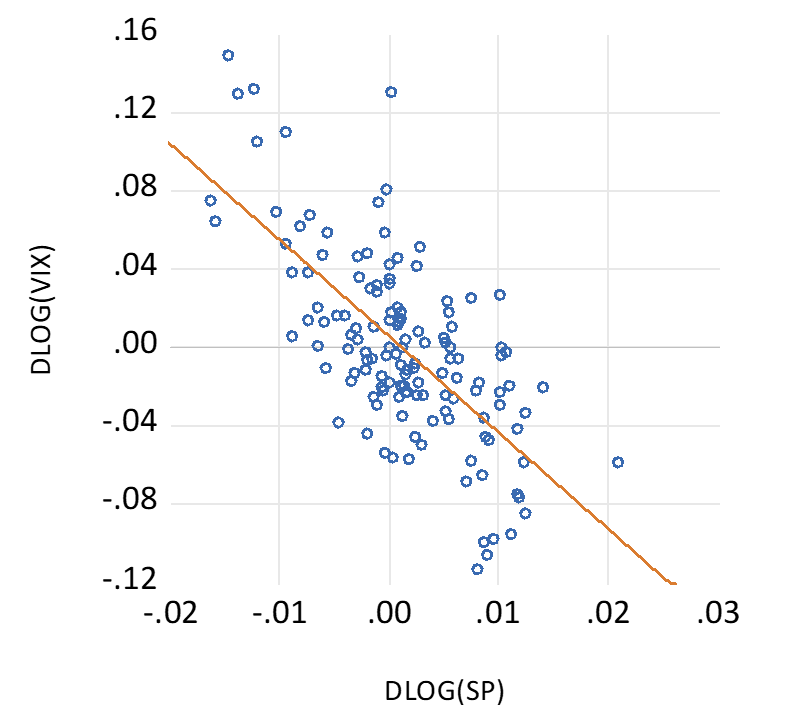
Source; Bloomberg and Investec Wealth & Investment
Yet were share market returns measured over longer periods, the risk of an in period loss falls significantly. The average returns when investing on the JSE or S&P market are very similar when returns are measured over one, five or ten year holding periods. Since 2020 returns for holding the S&P Index have averaged about 14% over one year and 11.1% p.a. and 11.2% p.a. when calculated over consecutive five year and ten-year periods respectiverly. However, the Standard Deviation (SD) of returns about the average has been much higher for one-year returns (13.87) than for five or ten year returns with SD’s of 2.93 and 1.96. The same relationship holds when the analysis is taken back to 2000. Risks (the SD or volatility of returns) have fallen sharply when the investment period is extended beyond one year. Absolute losses when returns are measured over five- or ten-year periods occur rarely. It took a Financial Crisis to do so.
The extra expected returns for extra equity risk applies to the averagely risk-averse investor with limited wealth. When you are investing for you children and grandchildren and their children, and are wealthy enough not to have to worry about being forced to cash in your shares, you can invest without much risk -and you can expect to pick up the money left on the table by the more risk averse. Further support for time in the market – not timing the market.
Returns on the S&P 500 Index. Over One, five and ten year periods. Monthly Data 2020- 2024.
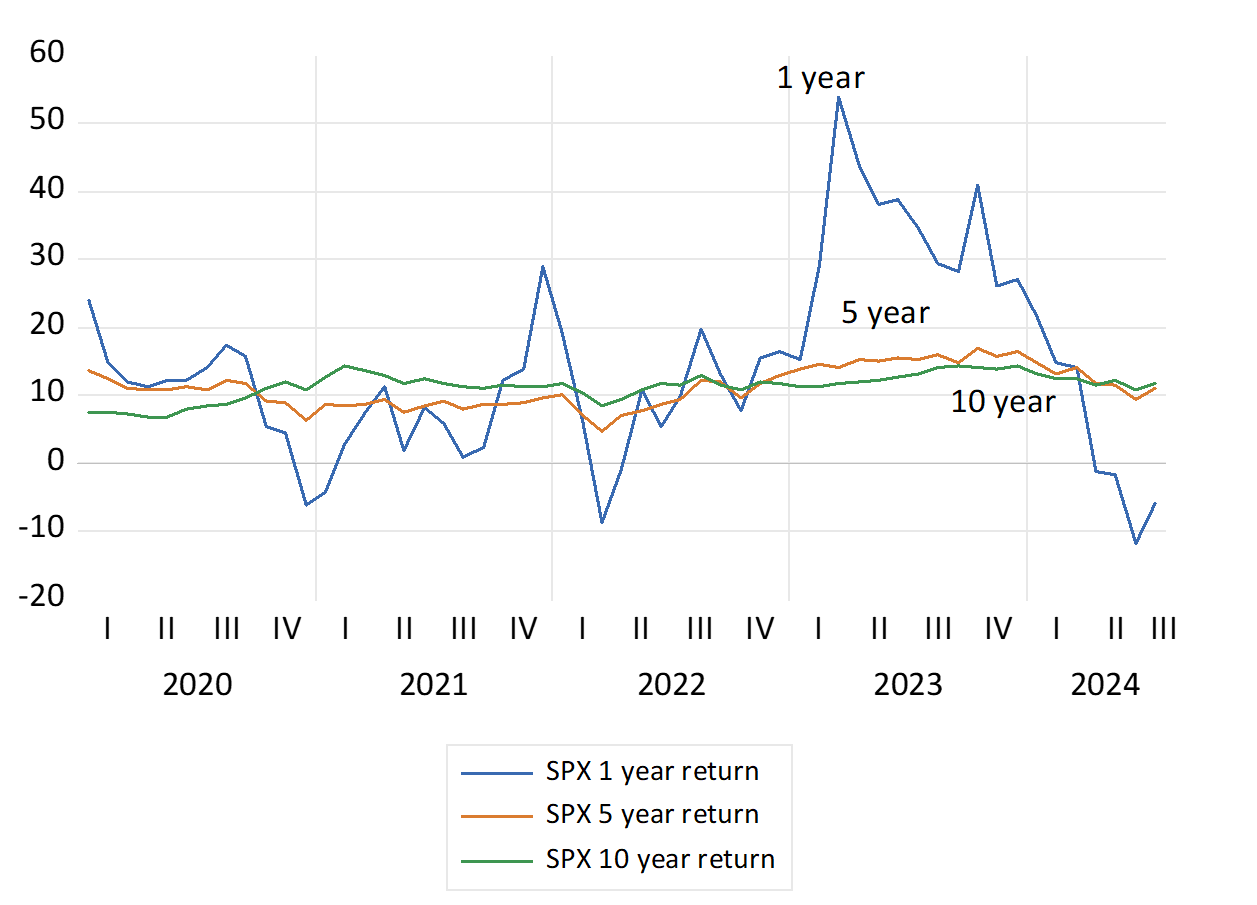
Source; Bloomberg and Investec Wealth & Investment