No Trump tantrum

Overcoming the Trump shocks and drawing its implications for SA and Reserve Bank action

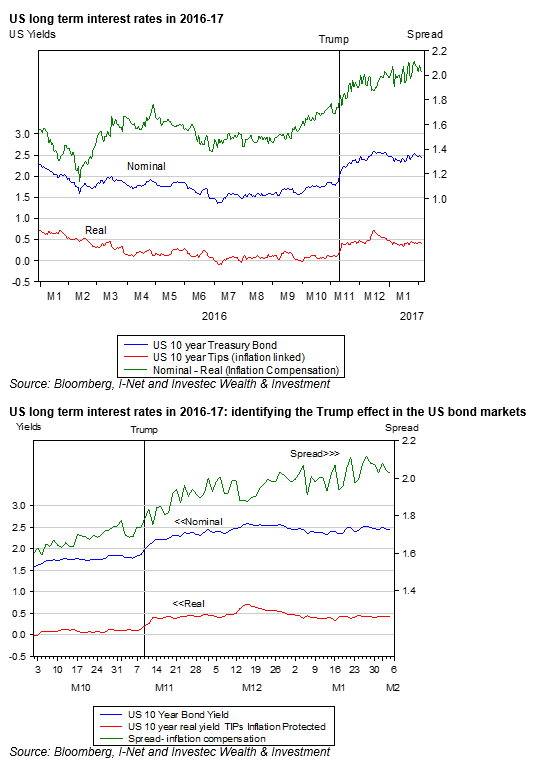
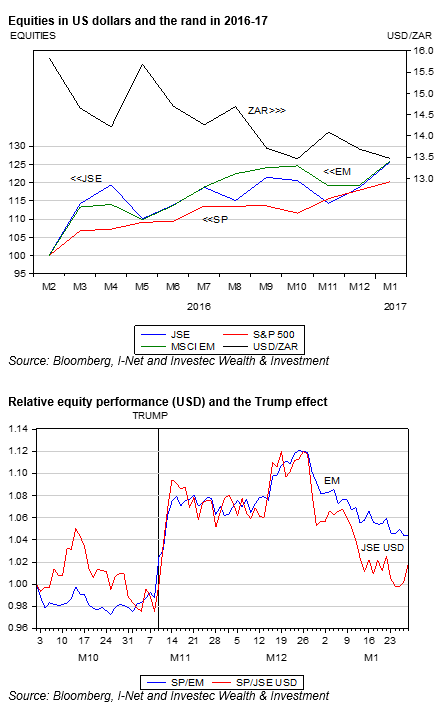
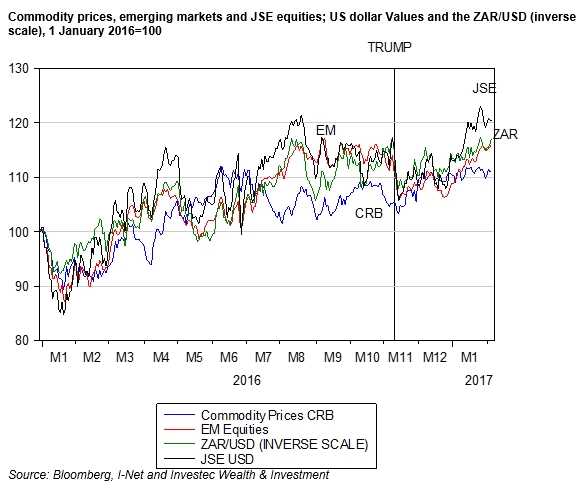
The Trump shock has been working its way through the markets. Expectations for US growth under Trump were revised upwards, which benefited US equities generally. Emerging market (EM) equities by contrast have suffered both absolutely and relatively, with the JSE in US dollars performing as it usually does, in line with the average emerging market, with both losing about 6% of their pre-Trump US dollar values.

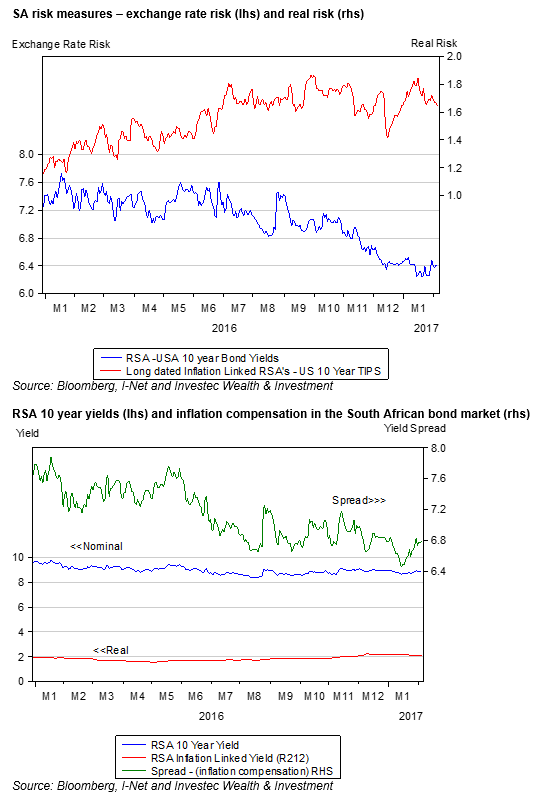
The market and central bank governors have long feared the impact of higher bond yields in the US on EM currencies, inflation and interest rates. Long term RSA bond yields rose immediately, in sympathy with higher US bond yields. But recent interest rate trends in the RSA bond market have proved much more encouraging. Yields have receded as the spread between RSA and US Treasury bond yields have narrowed, leaving rates little changed from their pre-Trump levels. These are helpful trends and indicate that a feared “Trump tantrum” in the RSA bond markets has not materialised.

A related and similarly favourable reaction can be observed in the currency market. The rand weakened against the US dollar, along with other EM currencies, with the Trump election. But more recently the rand has regained its pre-Trump US dollar value and has performed better than the average EM currency since. More important is that the trade weighted rand has gained significant strength as we also show below. The trade weighted rand is now as much as 24% stronger than it was in mid-January 2016. This strength translates directly into lower import and export prices and so less inflation and less inflation expected.

Not all the recent economic news has been encouraging. The latest GDP release for the third quarter indicates that SA growth trends have deteriorated. Spending by households and the government is barely increasing while capital expenditure by private businesses and public corporations declined significantly. The GDP growth rate of a mere 0.2% in the third quarter can be attributed to an extraordinary growth in investment in Inventories in the third quarter that was enough to offset a very poor reading on net exports. A better net export performance in the fourth quarter and beyond may help compensate for a likely decline in inventories.

The economy will have to grow at a minimal 2-3% rate to cause the rating agencies to sustain our credit rating. It will take meaningful growth enhancing structural reforms to raise growth rates permanently to higher levels. These appear unfortunately unlikely and would take time to achieve results.

A cyclical recovery is however distinctly possible and could take GDP growth up to a 2-3% pace. Such a cyclical recovery would have to be led, as it always has to be led, by a significant pick-up in household spending propensities. Households have to spend more to encourage firms to invest more in equipment and people to meet their extra demands. Lower short term interest rates are essential to the all-important purpose of a cyclical recovery.

Inflation in SA is now very likely to recede below the upper band of the inflation targets. There is always a risk that these recently favourable trends may reverse. But there is a much greater probability that the economy will continue to stagnate dangerously, leading to political and economic stability for want of a stimulus to spending. Inflation is no self-fulfilling process in SA. The relevance of so-called second round dangers to inflation that may accompany inflation expectations is a theory for which there is no good evidence. Inflation expected is much more likely to follow than lead inflation as the evidence does reveal.

The Reserve Bank focus, narrative and action should respond accordingly by addressing the downside risks to the economy and lowering interest rates. And by recognising an improved outlook for inflation, rather than to focus further on inflation risks, over which they have no predictable influence. 8 December 2016

Will a national minimum wage help the poor? We beg to disagree with the expert panel

The National Minimum Wage for South Africa (NMW) – will it be helpful or harmful to the poor of SA? We beg to disagree with the expert panel.

A reality check

It is always salutary to be reminded just how dire are the economic circumstances of the average South African and how slowly their economic conditions have been improving. Over 51%, some 29,733,210 of our people, live on less than R1,036.07 per month. These and many other shocking statistics are reported by the Panel of Experts appointed to recommend the level of a National Minimum Wage (NMW) and on a process for its effective implementation (“Recommendations on policy and Implementation; National Minimum Wage Panel report to the Deputy President”).

The table calculated by the panel, included below, provides helpful detail about the lack of income and the associated unemployment.

The panel has no doubts about the helpfulness of an NMW in principle – only reservations about practice

The panel seems to have no doubts that a NMW would be a very helpful policy intervention in principle. To quote selectively from its substantial report of 128 pages”

“On its own it will not solve all of the challenges we face, but it is an implementable policy which is designed to have a measurable and concrete benefit on the poor. The minimum wage is therefore seen as one of the tools to close the wage gap, including between the genders, and thereby to overcome poverty.

“Furthermore, under the correct conditions and at the correct wage level, it is possible for minimum wage policies to contribute to improving economic growth. ……Given that the national minimum wage is essentially a policy to help the poor, it is generally accepted that exemptions and exclusions should be kept to an absolute minimum.”

Striking a balance – recognising employment dangers in scenario exercises

The panel was required by the social partners in Nedlac, who agreed to an NMW, to recommend an appropriate level for the NMW. Since it recognised a relationship between wages and employment the MNW had to strike a balance between the effects of increasing wages to a higher prescribed minimum level and its consequences for additional unemployment of which SA already has a great abundance. Some 26% of the labour force, those in work or looking for work, are currently unemployed, while many more potential workers have been discouraged from looking for work and have fallen out of the labour force. Adding them to the work force would imply a more broadly defined national unemployment rate well into the 30% plus range.

The panel recommended a NMW of R3500 per month or R20 per hour to be phased in by 2020 with 90% of the NMW to be applied in agriculture and 70% in Domestic Service provided to Private Homes. It also recommended annual reviews of the NMW and a gradual move to uniformity across all sectors of the economy. Using a so-called Computable General Equilibrium model of the SA labour market (as described and developed by Professor Harron Bhorat of UCT) that included assumptions (not predictions based on past performance) about the trade-offs between percentage increases in minimum wages and percentage reductions in employment (the relevant employment elasticities in economic speak) .

The aggregate employment losses were estimated as between 100,000 and 900,000 jobs lost in exchange for the recommended NMW. Clearly in the view of the Panel, the NMW had to be set high enough to make its contribution to poverty relief and yet low enough to be able to treat the extra unemployment as the acceptable price to the panel members of them doing such good for society. Another argument for breaking eggs to make omelettes from those unlikely to be harmed by the action and who might even benefit from helping to give effect to a new dispensation.

However the panel did qualify its judgment. It noted correctly:

“…..that there is no research or data that can accurately predict the outcome of any policy intervention. It is for this reason that strong emphasis has been placed on the need for good solid research to support the work of the NMW institution into the future. Any future changes to the level of R3,500/R20 per hour should be based on solid evidence of the impact of the national minimum wage.”

Would it be unkind to recognise that this would also be more grist for the economist’s mill?

The relationship between minimum wages and employment – what may be self-evident to the panel is not so to the society at large

It would have been helpful had the panel used the report to explain more fully why employment offers are negatively related to the wages or rather employment benefits provided by employers in exchange for hours worked. The relationship is much less self-evident than the panel may have presumed it to be – especially by members and leaders of trade unions who are inclined to attribute wage differences much more to political forces and bargaining power and even to race – than to the differences in skills and therefore of the contributions to output made by the well and poorly paid. And they are very inclined to believe that the wage gaps can be easily closed, with little consequence for economic growth by taking more from the well paid and giving to the poor. And so for ever higher NMW.

The relationship between skills, incomes and employment

The panel is well aware of an obviously important and highly consistent relationship to be observed of the SA labour market between measures of skills and wages earned. And as statistically significant is the relationship between incomes and employment. The lowest income South Africans have the highest rates of unemployment. The full income and employment details are shown in the table below (Table 5 Household Indicators of the Panel Report). Other reports from Stats SA have demonstrated the links between educational attainments and income and employment.

It may be seen in the Table, that of the 16,306,000 people in Quintile 1, 31.2% of the population with the lowest share of income, only 15,9% are employed, 25% strictly unemployed and the broad unemployment rate of this group is estimated as 65.8%. The average wage of those employed in quintile 1 is only R1017 per month. The second poorest quintile counts for a further 24.6% of the population, has a lower unemployment rate, a much higher participation rate in the economy and average wage incomes of R1707 per month. A large improvement but still a very low average wage.

The top income quintiles present very differently. Unemployment rates are much lower and participation rates and average incomes from work of the employed are much higher and well above the recommended NMW. Though it should be noted that the average wage income of those employed who fall into Quintile 3 of R2651 per month, is still well below the R3500 per month recommended NMW.

The implications of a NMW set so far above average wages- is there precedent that can help us predict the employment effects with any confidence?

This begs the question – is there any precedent for a NMW or a sectoral minimum wage determination –be set so far above average earnings – and if so what have been the consequences for employment? Or put in another way is there reason given the facts of the labour market to think that the employment elasticities in SA are a lot more negative than the range of assumptions considered by the models. Time will tell much more about the consequences of the recommended NMW as the Panel complacently assumes and adjustments can then made to the model and the recommendations. But who will care for the unemployed and their dependents in the meanwhile?

How can an NMW help the poor – who are now mostly not employed?

It is very difficult to understand why the Panel should believe that the NMW can be helpful to the poor of South Africa or reduce inequality. Because fundamentally the poorest South Africans those in first and second quintiles, are mostly not employed. And when employed they are able to only command wages far below those of the recommended NMW that still leave them objectively poor.

The recommended NMW will surely make it even more difficult for them to find work that might for some, especially young workers, prove a path out of poverty. Thus the NMW is very likely to increase further the unemployment of low skilled potential workers in SA and to widen the gap between the average incomes of the high earners and the low earners, mostly no earners of the population. The poor of SA deserve better opportunities to work and more so the opportunity for their children to acquire the education and skills that would help them qualify for and find well paid work. They do not need further interference in their search for work.

Employers will make the adjustments that will confuse the observers

Though to complicate the numerical outcomes to be observed in due course, structural adjustments to employment practice will be made by employers in response to higher minimum wages. The adjustments will include more reliance on mechanisation and automation- requiring more carefully selected and skilled employees, forces that substitute capital for labour, especially less skilled labour, that are already well at work in the economy.

Other adjustments employers will make will be to offer fewer hours of work and significantly less by way of other important employment benefits, food and accommodation and contributions to pension and medical aid for example, the cost to employers and value to employees the panel refuses to recognise in its money wage only determination. Evidence of such reactions so unhelpful to low income workers comes from previous minimum wage adjudications in the agricultural sector. Fewer workers were employed permanently – less accommodation was offered on the farm – and higher transport costs was incurred byr workers busing in from informal settlements. And there is also bound to be less compliance with the law given the availability of cheaper labour and additional employment offered to illegal immigrants.

Why does the labour market only work well for the higher income earners? Is it because they are much less encumbered by regulations and collective bargaining?

A further observation of the inconvenient and uncomfortable truths of the SA labour market is that the supply and demand for labour are very well matched for the well paid and very poorly matched for the low paid. A very high unemployment rate – a large number of potential workers unemployed at current wages – is surely evidence of wage levels that are too high rather than too low to the important purpose of providing work for those who would wish to work- at prevailing wage rates.

These are not considerations that receive much attention from the panel. Other than a presumption of “structural imbalances” or why these structural forces that discourage employment do not apply to the most expensive of workers in SA who are so readily employed?

It is to be conceded that employment at low wages for those with limited skills cannot overcome the poverty of the working poor. But then what can – other than them acquiring the valuable skills that are in short supply and well worth hiring. Wishful thinking- waving magic wands in the form of un-affordable to potential employers of high minimum wages will not solve their problem.

But unemployment makes their condition more onerous and denies them the employment and low wage benefits that they would be willing to accept. A willingness demonstrated by their seeking work. And being unemployed prevents the potential worker from acquiring skills on the job and the opportunity to demonstrate their capabilities that add to their employment credentials. These opportunities are particularly important to young, unskilled entry level workers whose unemployment rates are regrettably but understandably well above average unemployment rates as is well recognised by the panel.

The panel might have sought an explanation of the high rates of unemployment of low income South Africans in the structural impediments to their employment in South Africa. Barriers to employment offered or accepted in the existing highly pervasive regulations of their employment contracts. It is not as if minimum wages have not been tried in SA. They are widely practiced and have surely had their effect on the employment of the lowest paid and least skilled.

The current regulatory barriers to employment in SA

There are in fact 124 separate such sectoral minimum wage determinations. They cover approximately 5m workers and 33% of those employed leaving only 35% of workers uncovered including presumably many of the better paid also without Union representation. The lowest such monthly determinations in 2015 ranged from R1813 for Domestic Workers to R2844 per month per Contract Cleaner in the lowest grades. The highest sectoral minimum determinations – for more skilled work- were R6155 for workers in private security and R6506 per month in Retail and Wholesale businesses.

The newly fashioned NMW is intended to remove all this administrative complexity – and presumably also the possibility of recognising very different labour market conditions – supply and demand – that may apply in the different sectors and regions of the economy. Conditions that participants in specific labour markets, unencumbered by regulations would be much better informed about than even diligent officials to the advantage of workers and their employers.

The case for best leaving the determination of an employment contract to willing buyers and sellers of labour does not get any hearing from the panel. While the collective bargaining process in SA that can easily be shown to protect the established interests of employees and their employers – the insiders – at the expense of the employment opportunities of the outsiders – receives nothing but uncritical approval from the panel- and with an appeal for the wider application of collective bargaining arrangements.

The influence of welfare on employment

Nor did the influence of SA’s extensive welfare system on poverty and employment receive much more than perfunctory and rather condescending attention from the Panel as follows.

5.43. “While wages are low relative to living levels, there are arguably some offsetting effects from the social wage spending by Government. About 35% of South Africa’s budget is spent on programmes targeted at the poor, including free basic education, health care, water and electricity, and income support grants for children and the elderly”.

They may, as did the Davis Committee on Tax Reforms, have referred to a report of the World Bank on the influence on incomes and their distribution of SA of its welfare system. To quote this study:

“But while incomes earned in South Africa may well be the most unequally distributed in the world – the distribution of expenditure is much less unequal. The World Bank shows, in a recent study, that South Africa does more to redistribute income in cash and kind to the poor than its developing economy peers with similar average incomes , Armenia, Brazil, Bolivia, Costa Rica, El Salvador, Ethiopia, Guatemala, Indonesia, Mexico, Peru, and Uruguay (South Africa Economic Update Fiscal Policy and Redistribution in an Unequal Society, World Bank, November 2014).”

As this World Bank study also reports:

“South Africa ranks as one of the most unequal countries of CEQ (Commitment to Equality Methodologies applied by official statisticians in income measurement) participant countries, if not among all middle-income countries, given its Gini coefficient of 0.69. The proportion of the population living in poverty at 33.4 percent measured by the international benchmark of $2.50 a day(purchasing power parity, PPP, adjusted) — is also higher than in many other middle income countries with similar levels of GNI per capita. For example, the poverty rate is 11 percent in Brazil and 4 percent in Costa Rica”

To quote further from the World Bank report:

“Briefly, this Update has two main findings. First, the burden of taxes falls on the richest in South Africa, and social spending results in sizable increases in the incomes of the poor. In other words, the tax and social spending system is overall progressive. Second, fiscal policy in South Africa achieves appreciable reductions in poverty and income inequality, and these reductions are in fact the largest achieved in the emerging market countries that have so far been included in the CEQ. Yet despite fiscal policy being both progressive and equalizing, the levels of poverty and inequality that remain are unacceptably high. South Africa is currently grappling with slowing economic growth, a high fiscal deficit, and a rising debt burden. In this context, addressing the twin challenges of poverty and inequality will require not only much-improved quality and efficiency of public services but also higher and more-inclusive economic growth to help create jobs and lift incomes.” (p22)

These income transfers and benefits in kind may moreover, influence the willingness to supply labour services at prevailing wages – especially when wages on offer are very low. By providing an alternative source of benefits welfare raises the reservation wage – the wage at which it makes good sense to work or to seek work, work that may well be physically demanding and less than enjoyable for its own sake. The panel might have paid much more attention to the supply side of the SA to help explain low rates of labour force participation. Also to help explain why immigrants from Africa are much more likely to be employed – at market related wages.

Economic growth and employment – ignoring the evidence

The panel remarks somewhat self-evidently that:

“An additional problem faced by the country is that there is evidence that the growth in the demand for labour in South Africa has not been sufficient to keep up with the much larger growth in labour supply.”

The panel quotes with seeming approval a study that apparently shows growth and job creation are not well correlated. To quote the Panel:

“Recent empirical work by Mkhize (2016) finds that the economy’s capital intensity undermines its ability to generate jobs in times of economic growth. He finds that, in the long run, growth and job creation are not correlated, although there is some sectoral variation. This points to the broader economic policy challenge facing South Africa, which is that there are structural barriers that exacerbate unemployment, the solutions to which require more than economic growth”.

A surprising conclusion it would be thought, given the fact that in the developed world incomes (GDP), population and the size of the labour force have grown together, as indeed it did in SA until the 1980s – as our own work has shown (see below), though such work on the relationship in SA between GDP and numbers employed is complicated by the absence of an official continuous long time series of numbers employed. Though the structural break in the relationship in the 1980s is easy to recognise and to be self-evidently explained by the increasing degree to which the SA labour market came to be regulated and the increasing bargaining power conceded to trade unions in the 1980s.

The recommended NMW represents more of the same lack of faith in market forces that encourage regulation, rather than regulatory interventions to generate growth and employment.

Another case I would suggest of economists as are the governments they usually serve, being part of the economic problem rather than the solution. 28 November 2016


Assessing markets after the US elections

The market reacts to a surprising US election. Is more growth expected in the US consistent with less growth in emerging economies? Perhaps not.

Donald Trump’s ascension to the White House surprised the financial markets. The bond markets have recorded the largest surprises. A heavy dose of shock and awe was registered in the Treasury bond market and the shock waves were also felt in emerging bond markets, including the market for RSA bonds. US 10 year Treasury yields ended last week over 30bps higher (as we write on Monday 14 November, the yield is 2.21% p.a). The RSA 10 year also ended the week higher at 9.11% p.a (now 9.17%) or 44bps higher, meaning a slightly wider SA risk spread of 6.95% p.a. – equivalent to the average rate the rand is expected to depreciate against the US dollar over the next 10 years.

The higher rates in the US were not confined to vanilla bonds. Inflation linked yields (TIPS) also moved higher on Wednesday 9 November, revealing that the Trump presidency was expected by market participants to not only bring more inflation but also faster growth; faster growth that was expected to increase the competition for capital, so making capital more expensive in real terms.

RSA yields indicated that more SA inflation came to be expected as real bond yields remained largely unchanged through the week. This indicated that little change in the SA growth outlook was expected. The wider spread between nominal and real RSA bond yields indicated more inflation expected that was consistent with the faster rate at which the rand was expected to weaken. More rand weakness, other things equal, means higher rates of inflation in SA (See figures 1-4 below).

Higher bond yields were also registered in Europe. German 10 year Bund yields that had been negative in October increased from 0.08% p. a. on the Monday to 0.235% by the Friday close, but not by enough to prevent the spread Vs US Treasuries from widening in favour of the US dollar, which made gains against the euro and much more significant gains vs emerging market currencies.

The rand was an underperformer within the world of weaker emerging market currencies. R13.35 bought a dollar on the Monday, but by Friday the USD/ZAR was R14.29, a decline of 6.8% (now R14.39) compared to our equally weighted basket of 11 other EM currencies that declined by a mere 3.8%. The currency market would appear to be pricing in additional SA-specific risks, perhaps associated with Zuma resilience revealed in the no-confidence in the President motion in the SA Parliament that failed on the Thursday.

Other signs that US growth assumptions were being revised upwards came from the market in high yield or junk bonds. These yields remained largely unchanged as the high risk spread narrowed even as Treasury yields rose. Faster growth reduces the risk of credit defaults and the market in high yield credit appeared to be drawing this conclusion.

Other signs of faster growth expected came from the metals market. While the gold and oil prices expressed in the stronger US dollar fell away, the CRB Index of Industrial Metals in US dollar increased by about 5% in the week while the weaker rand compensated to some extent for lower US dollar prices.

The stock markets also told the story of faster growth expected in the US and slower growth expected in emerging economies. The SA component of the emerging market equity benchmark lost over 6% in the week compared to the MSCI EM that ended the week 3.5% weaker. The large cap US S&P 500 Index gained 3.8% while the small cap index did significantly better, gaining over 7%. This move too could be regarded as supportive of faster growth that improves the prospects for riskier small companies.

The best performing sectors on the S&P 500 and the JSE in the week of 7 to 11 November proved to be the highly cyclical plays. Materials and resource companies did much better than the consumer-facing companies that had offered predictable dividend yields, yields and dividend growth that had compared well with what had been very low interest rates. The same direction could be seen on the JSE with the Global Consumer Plays, despite the weaker rand, proving distinct underperformers.

It is however not at all obvious why faster US growth should be associated with less growth expected fromemerging market economies; nor why strength in metal prices should be associated with a deteriorating outlook for emerging economies, including the SA economy. The opposite conclusion might have been drawn as appears to be the case for the Australian economy, which is highly dependent on metal exports.

The growth prospects for the SA economy would not have been improved by the changed outlook for short term interest rates. As we show below, the short term yield curve, as reflected in the Forward Rate Agreements (FRAs) offered by the banks, moved sharply higher last week. The money market, having much reduced the chances of higher short term rates earlier, has reversed course. The market is now expecting a further 75bp increase in the Reserve Bank repo rate. Such increases, where they to be imposed on the already hard-pressed SA economy, would eliminate almost any possibility of a recovery in household spending, a necessary condition for a cyclical recovery. The bond market is expecting more inflation to come and the weaker rand expected is consistent with such a view.

Yet the USD/ZAR, while now weaker, is stronger than it was in early 2016, indicating stable import prices. Furthermore the outlook for much lower food price inflation should see headline inflation and Reserve Bank forecasts of inflation recede well below the upper band of the inflation target in 2017. The case for higher policy-determined interest rates, given a further slowdown in the economy, is even weaker than it has been, even though the market may now believe otherwise of the Reserve Bank.

Lower inflation, should it materialise, will lead inflation expected in the same lower direction. The causation runs from inflation to inflation expected and not the other way round as the Reserve Bank has argued. Inflation takes its cue from the exchange rate and is much affected by the weather and the actions of the President. These are forces over which interest rates and the Reserve Bank have no predictable influence. The Reserve Bank should concentrate on what it can do to assist the growth prospects of the economy and that is to lower interest rates. Inflation is beyond its control; a fact of economic life in SA that is overdue official recognition but may yet receive it. 15 November 2016

The market is a lot less scared of Trump than the pundits

The punditry not only greatly underestimated the presidential chances of Donald Trump, they also misread the implications of the known election outcomes for the financial markets. Far from the predicted rush for safety in the US dollar, US Treasuries and defensive stocks, the market, when given the opportunity, pushed US bond yields higher, indicating that faster growth and more inflation was to be expected post Trump (the 10 year Treasury yield initially increased from 1.85% to 2.08%, though it closed at 2%).

Further evidence of positive expectations of faster growth came with the outperformance of resource companies, including those listed on the JSE. The performance of the 12 sectors that make up the S&P 500 is shown below. Financials and Healthcare (expected to benefit from less obtrusive regulation and executive action) as well as Materials ( to benefit from growth and investment in infrastructure) were outperformers while sectors that offered protection against a weaker economy, including Consumer Discretionary and Staples underperformed as did interest rate sensitive sectors of the New York stock market.


Emerging markets, a risk off trade, did come under initial pressure, led by the Mexican peso, a currency especially vulnerable to any protection provided for US manufacturers, lost 8.8% of its US dollar value on the day. The rand ended 1.8% weaker while the Brazilian real was 2% weaker. The 10 year RSA yield moved higher, from 8.64% to 8.78%, leaving the risk premium vs US bonds at an unchanged and recently improved 6.79%. The MSCI Emerging Market (EM) benchmark in US dollars ended 2.5% weaker on the day, compared to the JSE that was 1.3% weaker in US dollars and 0.5% up in rands.

These outcomes must be regarded as satisfactory for EM financial markets, including those measured in rands. The exchange value of the rand has held up more than well enough to sustain a forecast of lower inflation and interest rates to come- essential for faster growth in SA.

What the pundits missed is that while Hillary Clinton represented business as usual for the US and its allies, business as usual under Obama had become increasingly less friendly to business. US and global business have come under increasing suspicion and hostility from more ambitious and obstructive officials emboldened with ever greater executive powers. The Trump administration, with the aid of a friendly Congress, could achieve some quick wins for US business by annulling or at least amending financial and environmental legislation and practice, as Trump had promised to do. The grossly dysfunctional US corporate tax system is an obvious target for a complete restructuring in ways that would be helpful to the owners of business in general and to the economy at large – though these are not necessarily synonymous.

Free trade for example (against which Trump argued and which helped him bring in the vote on the rust belt) is very good for consumers and their standard of living. Cheaper and better air conditioners produced in China have made living in the US South a lot more comfortable, for example. But they have not been helpful to the owners of air conditioning factories in the US or to the employment benefits of their employees. Protection unfortunately can be good politics and good for business owners, but not necessarily for their customers. Though if free traders are seeking consolation they may find it in the prospect of freer trade in services, with a far larger role in the economy (including the SA economy) than manufacturers. Exchanges conducted not over the waters but over the internet and are much more difficult to tax.

The Trump triumph, it should be appreciated, represents a successful attack on the conventional wisdoms and actions that have guided social and economic policies in the US and Europe. How wise and fair this consensus actually is, is a matter of very divided opinion as the US election has demonstrated. Given the opportunity provided by the highly unorthodox Trump, large numbers of Americans voted in effect against the comforts of the ruling establishments inside and their supporters outside Washington DC. Their discomfort in recent events is understandable and clearly geo-political risks are enhanced. Perhaps even the risks to the environment have increased. But the risks to doing business in the US and its growth prospects have as clearly declined, as the market has told us. 10 November 2016

The SA economy: The view from the rear view mirror is not encouraging

The SA economy: The view from the rear view mirror is not encouraging. Can we look down the road more happily?

The pace of the SA economy appears to be slowing down rather than picking up momentum – judged by the very latest data releases for October 2016. New vehicle sales and cash in circulation indicate that a trough in the business cycle, that is when economic conditions have begun to improve rather than deteriorate, has not been registered though may possibly be in sight.

New vehicle sales are nevertheless somewhat more encouraging than the latest money supply data. While new vehicle sales are well down on a year ago, sales volumes in October represented a modest improvement over sales made in August and September 2016, especially when viewed in seasonally adjusted terms, as we show below. When current vehicle sales are extrapolated, using a time series forecasting process, a cyclical trough, is indicated for early 2017. As noticed in figure 2 negative, year on year growth rates, may also have reached a low point.

By contrast the demand for and supply of cash still indicates weaker propensities of households to spend more. The demand for cash, as may be seen, is not keeping pace with inflation. Though, as may also be seen, the forecast is that the real demand for cash is about to turn marginally positive, indicating more rather than less spending to come.

When these two series are combined to form our Hard Number Index (HNI), its direction has turned lower after moving sideways for much of the year, indicating declining levels of economic activity. Extrapolating the HNI however also suggests an improvement in activity levels in 2017. As may be seen, the HNI based on two very up to date hard numbers – rather than based upon sample surveys – is a good predictor of the Business Cycle that is calculated by the Reserve Bank, for which the latest data point is for July 2017 (of somewhat distant memory given all that has happened to society and the economy).

The broader measures of money supply and of bank credit and retail sales volumes, updated to September 2016, indicate a similarly weak backdrop for the SA economy, as we show below. The growth in M3 (to September month end) has become negative in real terms while bank credit supplied to the private sector is somewhat more robust. Perhaps bank credit is being used to a degree, to fund offshore rather than domestic growth. As we also show in retail sales volumes shows a declining growth trend that is forecast to continue in 2017.

The hope for a cyclical recovery in 2017 must rest upon the inflation trends. A Reserve Bank forecast of lower inflation would allow for lower interest rates, which are essential to the purpose of a cyclical recovery. As may be seen in figure 6, the time series forecast of the CPI, using the latest data, is for less inflation to come. Recent data releases for the CPI (the latest being for September), do indicate a much shallower trajectory for the CPI. Between July and September 2016, the CPI was largely unchanged as we show below. A degree of exchange rate strength has helped restrain inflation. A normal harvest in 2017 would do more of the same. South Africans, under severe economic pressure, would be justified in praying for more rain combined with strength in emerging market currencies, including the rand.

Bonds vs equities redux – including the outlook for inflation

Just under two weeks ago, we noted that 2016 has proven to be a very good year for investors in RSA (government) bonds (see Special focus). We revisit and update the topic in the light of recent events.

Bonds have outperformed equities and cash by a large margin this year. By 28 October, the All Bond Index (ALBI) had delivered a total return (including interest reinvested) year-to-date of 14.2%, compared to 2.7% provided by the All Share Index (ALSI) of the JSE. The inflation-linked RSA Bond Index (ILBI) had returned 8.1% by 28 October, while the money market would have returned 6.2% over the period (though it should be appreciated that bond yields had weakened sharply in December 2015 as had the rand in response to the President Zuma-inspired turmoil in the Ministry of Finance). On a 12 month view to 28 October 2016 – from 1 November 2015 the ALBI had returned 5.5% and the ILBI 7%; while R100 invested in the JSE ALSI on 1 November would have lost value and have been worth (with dividends reinvested ) R97.2 on 28 October 2016.

The JSE, when measured in US dollars, has performed very strongly this year, increasing some 14% this year (to 28 October), in line with a similar increase in the MSCI EM Index and well ahead of the S&P 500 Index, which is up by about 4% this year (see figure 2 below).

The strength in emerging market equities has given impetus to emerging market currencies, including the rand, as more capital flowed towards emerging markets and their currencies. Less global risk aversion and the capital flows that drive the MSCI EM Index higher are generally helpful for the rand as well as for the US dollar value of the ALSI. SA-specific forces acting on the rand can be identified by the ratio of the USD/ZAR exchange rate to the USD/EM basket exchange rate as we do below. A weaker rand relative to other emerging market currencies, indicated by an increase in the ratio of the foreign exchange value of rand to other emerging market currencies, represents extra SA risks and a lower ratio, less the SA risk that is priced into the exchange value of the rand.

The performance of the rand and other emerging market currencies is shown below, as is the relative performance of the rand. All emerging market currencies weakened against the US dollar between 2012 and 2015, though rand weakness was especially pronounced by year-end 2015. The rand not only strengthened in 2016 in line with other emerging market exchange rates, but has recovered some of this relative weakness vs the emerging market basket after mid-year. As may be seen in figure 3, the ratio of the rand to the equally weighted EM currency basket declined from 1.25 at the 2015 year-end to the current ratio (31 October) of 1.1 This indicates generally less SA-specific risk in 2016 – helpful to the bond market also, as expectations of inflation recede somewhat with rand strength and long term interest rates accordingly decline.

Recent interest rate trends are shown in the figure below. Long term interest rates in SA are significantly lower than they were in January – though are still above the lows of mid-August 2016. Hence the good returns realised in the bond market to date (though it should also be appreciated that the SA risk spread, being the difference between 10 year RSA Bond yields and the US Treasury 10 year yields, rose significantly in 2015 and spiked in December when President Zuma replaced his Minister of Finance. The spread is still significantly wider than it was in 2014 and before).

This spread is now 7.01% p.a. and is also by definition the expected depreciation of the rand over the 10 year period. In other words, the rand is expected to weaken on average by 7% p.a. over the 10 years. Any greater or lesser premium in the cost of buying dollars for delivery in 10 years would provide an opportunity for riskless profits – for borrowing dollars and lending rands, or vice versa – while securing the dollars or rands for future delivery at a known exchange rate, which eliminates the risk of the exchange rate depreciating or appreciating excessively . This spread is known as the interest carry, though it is one that can only be earned or helpful to borrowers taken on debt at lower rates, when taking on exchange rate risk. If this exchange rate risk is not accepted and the currency risk is fully hedged, the cost of borrowing or lending in the one or other currency will be approximately the same.

It is of interest to recognise that weakness in the USD/ZAR exchange rate is typically associated with a widening of the interest rate spread. Or, in other words, weakness in the USD/ZAR as registered in the currency market is associated with still further weakness expected. The evidence is demonstrated below in the scatter plots – those between the level of the rand and the interest spread on a daily basis since January 2015. The correlation between the levels of these two series is 0.70. We also show a scatter of daily changes in the interest spread and daily changes in the USD/ZAR. The correlation of these daily changes is also a high 0.56 (the 10 year spread is described in figure 6 as YGAP10).


Such a relationship is not intuitively obvious. Why would more weakness in an exchange rate today be associated with still more weakness tomorrow? It might be thought that a lower price (exchange rate) today would improve the prospects of a higher price tomorrow rather than weaken its prospects? For the developed market currencies a wider spread would ordinarily be associated with improved prospects for a currency under pressure and lead to currency strength rather than weakness.

Irrespective of the forces driving exchange rate expectations, more exchange rate weakness would surely be associated with more inflation to come and the reverse: a stronger rand today associated with less inflation to come. In figure 7 below we show the strong and understandable link between the risk spread, or the expected depreciation of the rand, with inflation compensation offered in the RSA bond market. Inflation compensation is the difference between the yield on a vanilla bond and the real yield provided by an inflation-linked RSA bond of the same duration, and is a very good proxy for inflation expected in the market place.


The rand has strengthened this year in line with other emerging market currencies and has also benefitted, as we have indicated, from improved sentiment about SA political trends in recent months. The decision today to withdraw fraud charges against Minister of Finance Gordhan has added further to rand strength relative to the other emerging market currencies. Accordingly, the outlook for inflation in SA will have improved. The outlook for lower interest rates therefore will also have improved, to the advantage of JSE-listed companies with full exposure to the SA economy, that stands to benefit from lower interest rates. RSA bonds clearly also have this character.

The chances of a cyclical recovery rest with the behaviour of the rand, with inflation and inflation expected and with the interest rate responses of the SA Reserve Bank. The recent news flow has clearly improved the prospects for less inflation and faster growth for SA. These improved prospects are helpful for investors in conventional bonds and for SA economy plays, like banks and retailers that benefit from lower inflation and lower interest rates as are revealed on the JSE. Rand (SA economy) plays do well with (unexpected) rand strength. They do even better in a relative sense when rand strength can be attributed to less SA specific risk. 1 November 2016

The SA economy needs a level playing field

A key role in a growing economy is played by the start-up enterprise. They introduce new ways of doing business- supply new products and services – that challenge established business practices and so help make the economy a more productive one. They can start small but if they get it right, and execute  well they can become large and successful.

They do so by serving their customers better than the competition did or sometimes could not have imagined. They also have to satisfy the interests of their employees who could work elsewhere and they also have to meet the interests of other suppliers of services or goods to them, including those of the suppliers of capital, for which they have to compete with all other firms. Most important is that by by attracting custom and covering their costs they can provide their owner-managers with benefits and returns on their savings (capital) far superior to those they might have realised working for somebody else.

But their chances of such success are not good ones. The owner-managers of most start-ups, even most small businesses, do not realise well above average returns for their founders- ahead of what they might have earned elsewhere or from their savings plans. This means judged by past performance these true entrepreneurs are not deterred by the prospect of low average rewards but are inspired by the (small) chance of realising exceptional rewards. This makes them risk lovers rather than risk averse and society has every good reason to encourage their unusual appetite for taking on risk. And so not to impose regulations that favour the large firm. Those large enough to afford specialised human resource and legal departments that keep key managers out of the time consuming mediation procedures – and able to employ skilled accountants that can complete complicated tax and other returns.  Should it however be easy for new entrants into the market place to succeed? Easy pickings would reflect an undesirable lack of market efficiency. If the market is working well it should be difficult to beat the market.

Better than promoting or discouraging small over large or large and established firms over smaller rivals would be to ensure that all firms can contend freely and openly in the market place. The proverbial level playing feel serves the interests of all the consumers, workers and taxpayers who will always be far more numerous than the owners or senior managers or professionals who engage with them.  .

But such freedoms to compete will always be threatened by the established producers who have a large and easily measured economic interest in limiting the competition through laws and regulations favourable to them. In the old SA a minority of suppliers of goods or services enjoyed such protections. Most others, as consumers and taxpayers and workers suffered from import and capital controls and maize and banana boards etc. that put some producers and some white workers and professionals first in line for jobs to the disadvantage of their potential competitors and the customers who stood to benefit.

It needs to be recognised that the producer interests that now tilt the playing feel against consumers and workers and taxpayers in SA and against the interests of perhaps more worthy beneficiaries of government spending, are those of the owners of black businesses and skilled black professionals. They are being favoured with higher prices and rewards by affirmative action. As before it is the economic interests of a minority of producers that are being served by regulation and law. As before, the politics of such actions are easier to understand than their economic consequences. Though the low growth trap that has now caught the SA economy should concentrate minds on the costs and benefits of interfering with competition.

Bonds vs equities, a comparison over the short and long runs

2016 has proven to be a very good year for investors in RSA (government) bonds. Bonds have outperformed equities and cash by a large margin this year. By 17 October, the All Bond Index (ALBI) had delivered a total return (including interest reinvested) year-to-date of 14.2%, compared to 2.7% provided by the All Share Index (ALSI) of the JSE. The inflation-linked RSA Bond Index (ILBI) had returned close to 8% by 17 October, while the money market would have returned 6.2% over the period. By contrast, an investment in the S&P 500 would have lost ground this year as we show below.

The JSE, when measured in US dollars, has performed very strongly this year, having returned close to 10%, though these returns have trailed behind the emerging market benchmark (MSCI EM) that returned 15.5% year to date-well, ahead of the 6% return provided by the S&P 500, though much of the extra return from the MSCI EM Index came in October as the rand weakened, temporarily it would now seem, in response to the fraud charge raised against Finance Minister Gordhan (See figure 2 below).

The strength in emerging market equities has given strength to emerging market currencies, including the rand, as more capital flowed towards emerging markets and their currencies. Less global risk aversion and the capital flows that drives the MSCI EM Index higher is generally helpful for the rand as well as the US dollar value of the ALSI. SA-specific forces acting on the rand can be identified by the ratio of the USD/ZAR exchange rate to the USD/EM basket exchange rate as we do below. A weaker rand relative to other emerging market currencies, indicated by an increase in the ratio of the rand to other emerging market currencies, represents extra SA risks and a lower ratio less SA risk priced into the exchange value of the rand.

The performance of the rand and other emerging market currencies is shown below, as is the relative performance of the rand. All emerging market currencies weakened against the US between 2012 and 2015, though rand weakness was especially pronounced by year end 2015. The rand not only strengthened in 2016 in line with other emerging market exchange rates, but has recovered some of this relative weakness vs the emerging market basket after mid-year. This indicates generally less SA-specific risk in 2016 – helpful to the bond market also as expectations of inflation recede somewhat with rand strength and long term interest rates accordingly decline.

Recent interest rate trends are shown in the figure below. Long term interest rates in SA are significantly lower than they were in January – though are above the lows of mid-August. Hence the good returns realised in the bond market to date.

When the rand strengthens for SA-specific reasons (less SA risk) as has been the case since mid-year, the different sectors on the JSE will react differently. In these circumstances, the global plays listed on the JSE (companies with much of their revenue and costs located outside SA) that provide investors with a hedge against a weaker the SA economy, will tend to underperform the ALSI (and vice versa when the rand weakens in response to an increase in SA-specific risks rise as was the case for much of 2015).

We show these forces at work in the figure below. The USD/ZAR gained relative to other emerging market currencies from mid-year, indicating less SA-specific risk. The global plays, represented by an equal-weighted index of 14 such stocks we describe as global consumer plays, lost ground both absolutely and relatively to the ALSI. A strong rand, for global or SA-specific reasons, is good for the SA economy and the companies dependent on it. It means less inflation and so lower short term interest rates, which in due course can be expected to encourage extra spending and borrowing by households.

This year the rand value of the global consumer plays on the JSE has been negatively affected by both the strength of the rand and the weakness of sterling. Some of the companies we describe as global consumer plays are in fact more a play on the UK consumer, as can be observed. The global consumer plays on the JSE in 2016 performed closely in line with the S&P 500 – in rands – while lagging behind the ALBI and ALSI.

This raises the important question – under which circumstances can bonds be expected to outperform equities? The US markets over the long run provide some insights in this regard. As we show below, US Treasury Bonds consistently outperformed equities through two distinct phases, during the Great Depression (when deflation afflicted the US economy between 1929 and 1938), and more recently during the near deflation and slow growth that burdened the US economy for much of the period since 2008. It would that seem slow growth, especially when accompanied by low inflation or deflation, is good for the performance of bonds relative to equities.

JSE-listed equities have provided superior returns over bonds or cash since 2000, as we show below, as would have been expected given the greater volatility of their returns. R100 invested in early 2000 with dividends reinvested in the JSE ALSI would have increased by 10.5 times by 17 October, equivalent to an annual average return of 15.8%. The same R100 invested in the less risky bond market would have multiplied by 6.7 times if committed to the Inflation Linked Bond Index (ILBI) and by 5.3 times if invested in the ALBI. These returns are equivalent to impressive average annual returns of 12.4% for the ILBI and 11.3% for the vanilla bond index, the ALBI. This is impressive when compared to consumer prices that rose 3.7 times over the period. Measured by the standard deviation of these annual returns, that were 23% for equities and 6% and 6.5%t p.a for inflation linked and vanilla bonds respectively, the bond market in SA has clearly delivered very good risk-adjusted returns both absolutely and compared to equities.

Deflation seems a very remote possibility for the SA economy. But SA inflation rates can recede, as recent history has demonstrated. Less inflation than expected, even when inflation remains at high but generally declining rates, will bring down interest rates and increase the returns on bond portfolios as the value of bonds rise. Slower SA growth rates, independent of inflation, will also tend to improve the performance of bonds compared to equities. In other words, if past performance were to be our guide, the case for a larger weight in bonds over equities in portfolios can be made on an expected combination of less inflation with slow growth. The case for equities over bonds will be made with faster growth and less inflation.

In the figures below we compare the relative performance of equities over bonds with the phases of the SA business cycle. The ALBI significantly outperformed the All Share Index during the slow growth years between 1995 and 2003. As growth took off, because inflation came down between 2004 and 2008, equities more than made up for the earlier underperformance. During the brief recession of 2008-09, bonds again outperformed, but have since lagged behind equities. However bonds have held their own with equities since 2014, as household spending and capex by firms slowed in response to more inflation and higher short term interest rates.

The relationship between the relative performance of inflation linked bonds (only indexed since 2000) is even more closely identified with the business cycle. Inflation-linked real interest rates are strongly pro-cyclical. They rise and fall with growth rates: faster growth brings increased demands for capital and so higher real rates. As we show below, equities have outperformed inflation linkers during the expansion phases of the SA business cycle and underperformed as growth slowed. These comparative returns have level pegged since 2014.

A comparison of the performance of SA bonds and equities since 2000 leads to a similar conclusion to that drawn for the US. SA equities do best with faster growth while bonds can outperform when growth slows down. Faster growth in SA can only be anticipated when the rand stabilises (or better still, strengthens) enough to hold back inflation so that interest rates can decline to stimulate more consumption spending.

More growth with less inflation will be better for equities than bonds – especially when compared to inflation linked bonds. Less inflation expected will provide very good returns from vanilla bonds – but still better returns could be expected from equities in such highly favourable economic circumstances. It will take a combination of favourable global growth trends, and so less emerging market risk, combined with less SA specific risk, to make it all possible. 21 October 2016

Power Play

A power play unfolds before our eyes. Comedy as tragedy or farce?

Prospects for the SA economy early on Tuesday 11 October had improved significantly when we learned that SA’s first two independent privately owned coal-fired power stations (IPPs) had been given the go-ahead. Foreign interest in these projects, as suppliers of the equipment and technology and of the necessary capital, was welcomingly strong. Most important, the 863MW of additional electricity is to be delivered at an agreed wholesale price of 79 and 80 cents, plus inflation.

Alas later that morning a further very troubling scene in the opera buffo that has become SA’s fiscal affairs, was played out when Public Prosecutor Shaun Abrahams announced that he was charging Finance Minister Gordhan with fraud. The economic damage caused by a weaker rand, higher borrowing costs for the state and lower values for businesses that depend on the SA economy, was immediately registered, while firms with operations mostly outside SA gained rand value. The outlook for inflation deteriorated with the weaker rand and so the possibility of lower interest rates from the Reserve Bank has receded. The income and job prospects of SA households and their willingness to spend and borrow more, essential to any cyclical recovery in SA, has been undermined accordingly as has the willingness of SA business to invest more in meeting their demands and employment needs. Many billions, incalculable billions of lost economic opportunity, will have followed. Those responsible cannot possibly count the damage they cause.

The two announcements however are linked – perhaps in a way that can still produce a happy ending. Can we doubt that the fiscal power play has much to do with the prospect of nuclear power as opposed to power from coal or gas? The deal for nuclear energy, details of which are awaited and are to be reluctantly supplied, and about which the Treasury has had its serious reservations made well known, will be on a scale well beyond impressive sums now to be invested in additional coal fired capacity. Business Day referred to R40bn per private IPP. Capturing a chunk of this nuclear deal from the people of South Africa at the expense of their living standards is seemingly well worth fighting for.

The problem for advocates of nuclear power in SA, well intentioned or perhaps not, is the firm offer of 80 cents per kilo watt hour from the new IPPs. We have a strong recent indication of just how expensive nuclear power can be. Britain has just given the go ahead for the nuclear Hinkley Point Power Plant, that plans to deliver 3200MW of power at a “strike price” of, believe it or not, £95.5 per MW plus inflation after 2012, that is at current exchange rates only roughly, since these rates move around so much, the equivalent of R1660 per MW, or equally roughly twice the price tendered by the IPPs. The wholesale electricity price in the UK is now much lower, about £45 per MW leading the National Audit Office to estimate that electricity consumers in the UK having to spend an extra £29.7bn for the benefit. Similar calculations of cost per hour and extra spend that will have to be charged to pay for nuclear in SA cannot be denied. They have to inform the process.

There is a more important lesson to be learned about the business of capturing the state from the citizens who pay for the state and its failures – intentional or not. The opportunity for corrupting the state is only as big as the state itself. There is no good technical reason to place airlines, electricity or water production, ports and railways, toll roads, hospitals and schools in the hands of the state. The reason why the state as supplier, rather than private producers, is so strongly supported by the politicians, is because they can so easily be captured by the suppliers of all kinds to these organisations, at the cost of the consumers of the essential services and the taxpayers who pay for them. South Africans watching the stage unfold might wise up to these facts of life.

Sending in the helicopters – monetary and fiscal policy in the developed world and SA

The term “helicopter money” has gained currency among economists and policymakers in recent times. We discuss the practical implications of this policy tool and contrast the challenges faced by developed markets with those of SA

After several years of quantitative easing (QE) – the process whereby the central bank buys up assets like government bonds in order to inject cash into the monetary system – the developed world has found that, while outright disaster may have been averted, it has not delivered the robust growth that was hoped for.

Economists and policymakers are now considering other stimulatory tools, including fiscal measures and “helicopter money” to lift developed market economies out of the apparent quagmire of very low growth.

The notion (metaphor) of helicopter money (also known as “QE for the people”) was first invoked by the foremost monetarist Milton Friedman and revived by Ben Bernanke, later chairman of the US Federal Reserve (Fed), to indicate how central banks might overcome a theoretical possibility that has become a very real problem for central bankers today.

The metaphor was derived from a parable in Friedman’s famous 1969 paper “The Optimum Quantity of Money”:

Let us suppose now that one day a helicopter flies over this community and drops an additional $1,000 in bills from the sky, which is, of course, hastily collected by members of the community. Let us suppose further that everyone is convinced that this is a unique event which will never be repeated.

The idea was picked up in subsequent years by others, including Bernanke, who noted in 2002 (while still a Fed governor) while speaking about deflation in Japan, how John Maynard Keynes “once semi-seriously proposed, as an anti-deflationary measure, that the government fill bottles with currency and bury them in mine shafts to be dug up by the public”. Bernanke added that “a money-financed tax cut is essentially equivalent to Milton Friedman’s famous ‘helicopter drop’ of money.”

The concept has gained further currency in recent years in the light of extremely low inflation in many developed economies. In this article, we look at some of the implications and practicalities of such measures and then contrast this with the policy approach that has been used in SA. First however, some context on the policy of QE that has become the mainstay for central banks in the developed world over the last eight years or so.

A question of QE

Central banks of the US, Europe and Japan, have created vast quantities of extra money in recent years through QE, quantities that would have been unimaginable before the Global Financial Crisis of 2008. Unfortunately, these have been bottled up in the banks who have held on to the extra cash received rather than used it to make loans that would have helped their economies along.

The cash was received by the banks or their customers from the central banks in exchange for government bonds and other securities bought from them in the credit markets and directly from the banks themselves. The cash shows up as extra deposits held by private deposit taking banks with their central banks – the bankers to the banks. This process of QE has led to the creation of trillions of dollars, euros or other currencies of extra assets held by central banks – matched by an equal growth in their liabilities, mostly to the banking system in the form of these extra deposits (see below).

Source: Federal Reserve Bank – Recent Balance Sheet Trends

Figure 2: Federal Reserve System of the US: Total assets and composition of assets

Source: Federal Reserve Bank – Recent Balance Sheet Trends

But why did these central banks create the extra cash in such extraordinary magnitude? In the US it was to rescue the banking and insurance systems from collapse in the face of their losses incurred in the debt markets following the failure of a leading bank, Lehman Brothers, that might have brought down the financial system with it. In Europe it was to prevent a meltdown in the market for most European government debt that could have brought down all lenders to government – not only banks but pension funds and insurance companies and their dependents. In Switzerland the cash came from purchases by the central bank of dollars and euros that flooded into the Swiss banking system and would otherwise have driven the Swiss franc even stronger than it has become. In Japan the extra cash was designed to offset the recessionary and deflationary forces long plaguing the economy.

The original purpose of QE in the US and Europe was to prevent a financial collapse. The second related reason was to fight recession and deflation. Extra money and the lower interest rates accompanying it are meant to encourage extra spending and lending. Extra money and lower interest rates usually do this to an economy – stimulate demand. Usually with extra demand comes higher prices and inflation.

The banks receive the extra cash directly from the central bank in exchange for the securities previously held on their own balance sheets or they may receive the extra central bank cash, with the deposits made by their clients when banking the proceeds of their own asset sales. Their clients deposit the cheques or, more likely, EFTs issued by the central bank in their private banking accounts and the banks then receive an equivalent credit on their own deposit accounts with the central bank as the cheques on the central bank are cleared or the EFTs are given electronic effect. And so in this way, through asset purchases by the central bank acting on its own initiative, extra central bank money enters the financial system, a permanent increase that can only be reversed when the central bank sells down the securities it has bought.

The banks have an option to hold the extra cash rather than lend it out to firms or households, who would ordinarily spend the cash so made available. And banks in the US, Japan, the Eurozone, UK and Switzerland have done just this in an extreme way. They are holding the extra cash supplied to them by their central banks as additional cash reserves, way in excess of the requirement to hold them.

The US money base shown below is the sum of currency and bank deposits (adjusted for reserve requirements) held with the central bank. Note how the US money base has grown in line with excess reserves held by the Fed and the extraordinary growth in the deposits held by Swiss banks with the Swiss National Bank.

Figure 4: Adjusted monetary base of the US

Figure 5: Excess reserves of US depository institutions

Figure 6: Swiss monetary base

Bringing in the helicopters

It’s here where the call comes in for metaphorical helicopters to bypass the banking system and jettison bundles of cash that people would pick up gratefully and spend on goods and services, so reviving a stagnant economy (stagnant for want of enough demand, not for want of potential output and employment that is the usual economic problem).

But will the helicopters come in the form imagined by Friedman, Bernanke and others? In reality they are likely to take a different form. They will have to be ordered by governments and budgeted for in Congresses or Parliaments. Central banks can buy assets in the financial markets and directly from banks. They cannot order up government spending that they can help fund. That is the job of governments, who decide how much to spend and how to fund it. Governments can fund spending by taxing their citizenry, which means they (the citizens) will have less to spend. This is never very popular with voters. They can also fund government spending by genuine borrowing in the market place – competing with other potential borrowers – crowding them out by offering market-related interest rates and other terms to lenders. Or they can fund their expenditure by calling on the central bank for loans that, as a government agency, they cannot easily refuse to do.

In taking up the securities offered to them by the government, the central bank credits the deposit accounts of the government and its agencies with the central bank to the same (nominal) value as the debt offered in exchange. Both the assets and deposit liabilities of the central bank then increase by the same sum, as the extra debt is bought by the central banks and the government deposit credited. As the government agencies write cheques on their deposit account – or do the EFTs on them – the government deposit runs down and the deposits of the private banks with the central bank run up. In this way, the supply of cash held by the private sector increases, just as it does in the case of QE.

And the private banks and their customers will have the same choice about what to do with the extra cash held on their own balance sheets. Spend more, lend more or pay back debts or hold the extra cash, as they have largely been doing.

But there is an important difference when the money is created to fund extra government spending. Spending by government on goods, services or labour (or perhaps welfare grants) will have increased, so directly adding to aggregate spending. By spending more, the revenues of business suppliers and the incomes of households will have risen with their extra money balances received for their services or benefits. This makes it more likely that they will spend at least some of their extra income, generating what is known in economics as a multiplier effect. This is why spending by government can be highly inflationary, as it was in the Weimar Republic of Germany after World War 1 or as it was in Zimbabwe not so long ago or as it is now driving prices higher in Venezuela.

But the current danger in the West is deflation, the result of too little, rather than too much spending. Inflation seems very far away, as revealed by the very low or even negative interest rates offered by a number of governments (in the form of negative yields on government debt) to willing lenders for extended periods of time. For some governments, issuing debt – at negative interest rates that produces an income for the government – is cheaper than issuing cash, that is the non-interest bearing debt of the government and usually the cheapest method for funding its expenditure. How can they resist the temptation to generate government income by issuing more debt for an extended period of time? Not easily, we would suggest.

The continued weakness of developed economies suffering from a lack of demand, despite low interest rates, calls for money and debt – or money creation by governments. The call for less austerity or more government spending relative to taxes collected, is being heard in Japan. It is a voice being sounded loud and clear in post-Brexit Britain. The Italians are very anxious to use government money to revive their own failed banking system. The Germans, with their own particular Weimar inflation demons, will however resist the idea of central banks directly funding governments, but for how long? Hillary Clinton promises spending on infrastructure. Donald Trump worries little about debt of all kinds – including his own (for now, as far as we can tell).

How long can weak economies co-exist with very low interest rates and abundant supplies of cash? It will not take helicopters but unhappy voters to stimulate more government spending, funded with cheap debt or cash. And the voters appear particularly restless on both sides of the Atlantic and, for that matter, the Mediterranean. The next few years promise to be intriguing ones for the governments and electorates of these countries.

Meanwhile in SA – a different world

At this point it is worthwhile to compare and contrast policy actions in the developed world with those in SA. The Reserve Bank (the Bank) has not practised QE. By contrast, SA banks, rather than being inundated with cash and excess reserves, have been kept consistently short of cash in support of the interest rate settings of the Bank. SA banks borrow cash from the Bank rather than hold excess cash reserves with it.

SA banks do not therefore hold reserves in the form of deposits at the central bank in excess of the reserves they are required to hold. As may be seen in the figures below, by contrast with their developed world counterparts, the SA banks are kept short of cash through liquidity absorbing operations by the Bank and, more importantly, by the SA National Treasury.

Also to be noted is the liquidity provided consistently to the banking system by the Bank in the form of repurchases of assets from them as well as loans against reserve deposits. Rather than holding excess reserves over required cash reserves, the SA banks consistently borrow cash from the Bank to satisfy their regulated liquidity requirements.

It is these loans to the banking system that give the Bank its full authority over short-term interest rates. The repo rate, at which it makes cash available to the banks, is the lowest rate in the money market from which all other short-term interest rates take their cue. Keeping the banks short of cash ensures that changes in the policy-determined repo rate is made effective in the money market – that is, all other rates will automatically follow the repo rate because the banks are kept short of cash and borrow reserves rather than hold excess cash reserves.

In the US, the Fed pays interest on the deposit reserves banks hold with the Fed. The European Central Bank (ECB), for its part, applies a negative rate to the reserves banks hold with it. In other words, Eurozone banks have to pay rather than receive interest on the balances they keep with the ECB as an inducement to them to lend rather than hoard the cash they receive via QE.

The cash reserves the SA banks acquire originate mostly through the balance of payments flows. Notice in the figure below that the assets of the Bank are almost entirely foreign assets. Direct holdings of government securities are minimal, as reflected on the Bank balance sheet. When the balance of payments (BOP) flows are positive, the Bank can add to its foreign assets and when they are negative, run them down. The Bank buys foreign exchange in the currency market from the private banks (and credits their deposit accounts with the Bank accordingly) or sells foreign exchange to them and then calls on their deposit accounts with the Bank for payment.

Thus, when the BOP flows are favourable, the Bank may be adding to its foreign assets and so to the foreign exchange reserves of SA via generally anonymous operations in the foreign exchange market. In so doing, it is acting as a residual buyer or seller of foreign exchange and, as such, will be preventing exchange rate changes from balancing the supply and demand. With a fully flexible exchange rate, no changes in foreign exchange reserves would be observed, only equilibrating movements in exchange rates. The exchange rate will strengthen or weaken to equalise supply and demand for US dollars or other currencies on any one trading day without causing any change in the supply of cash, that is in the sum of bank deposits held with the Bank.

The foreign assets on the Bank balance sheet have however increased consistently over the years as we show in the figure below. Hence influence of the BOP on the money base (on the cash reserves of the banks) has been a strongly positive one.

Without intervention in the money market, these purchases of foreign exchange by the Bank would automatically lead to an equal increase in the cash reserves of the banking system. Their deposits at the Bank would automatically reflect larger deposit balances as foreign exchange is acquired from them and their clients. This source of cash however has been offset by SA National Treasury operations in the money and securities markets.

To sterilise the potential increase in the money base of the system (defined as notes plus bank deposits at the central banks less required reserves) the Treasury issues more debt to the capital market. The debt is sold to the banks and their customers – they draw on their deposits to pay for the extra issues of debt – and the Treasury keeps the extra proceeds on its own government deposit account with the Bank. Provided these extra government deposits are held and not spent by the Treasury – as is the policy intention – the BOP effects on the money base (on bank deposits or reserves) will have been neutralised by increases in government deposits. (The money base only includes bank deposits with the Reserve Bank. Government deposits are not part of the money base.)

It is to be noted in the figure representing Reserve Bank Liabilities, how the Government Deposits with the Reserve Bank have grown as the Foreign Assets of the Bank have increased – extra liabilities for the Reserve Bank offsetting extra foreign assets held by the Bank. It is of interest to note that about half of the Treasury deposits at the Reserve Bank are denominated in foreign currencies.

Figure 7: SA Reserve Bank balance sheet: Assets

Source: SA Reserve Bank and Investec Wealth & Investment

Figure 8: SA Reserve Bank: Selected liabilities

Source: SA Reserve Bank and Investec Wealth & Investment

The net effect of recent activity in the money market has meant much slower growth in the supply of cash and deposits with the banking system. Despite the accumulation of foreign exchange reserves and because of the sterilisation operations undertaken by the Treasury, the money base in SA has grown relatively slowly, as have the broader measures of the money supply, M2 or M3, that incorporate almost all of the deposit liabilities of the banks to their creditors. This has been matched by equally slow growth in the supply of and demand for bank credit that makes up much of the asset side of bank balance sheets. This slow growth has been entirely consistent with weak growth in aggregate spending and GDP. Compare and contrast this with how rapidly money and credit grew in the boom years of 2004-2008 (see below).

Figure 9: Growth in SA money base (adjusted for reserve requirements) and broadly defined money supply (M3)

Source: SA Reserve Bank and Investec Wealth & Investment

Figure 10: Growth in S money supply (M3) and bank credit and direction of the business cycle

Source: SA Reserve Bank and Investec Wealth & Investment

The shortcomings of SA monetary policy

One test of monetary policy is its ability to moderate the amplitude of the business cycle. The strength of the boom between 2004 and 2008 and the subsequent collapse – and the persistently slow growth in money credit and spending after 2011 – indicates that monetary policy in SA has not been notably counter-cyclical. Nor can it claim much success in limiting inflation even as growth in aggregate spending (Gross Domestic Expenditure – GDE) and output (Gross Domestic Product – GDP) has remained very depressed.

Economic activity picked up when inflation subsided between 2003 and 2005, because the exchange value of the rand recovered strongly and because interest rates declined with less inflation. The SA economy enjoyed boom time conditions between 2004 and 2007. The interest rate cycle turned higher in 2006, well before the Global Financial Crisis broke in September 2008 and yet was accompanied by rand weakness. Inflation accelerated in 2006-7 as the exchange rate weakened and inflation rates remained high as exchange rate weakness persisted until early 2009. Lower interest rates followed a rand recovery in 2009 and lower inflation rates that continued until mid-2010. Interest rates were stable to marginally lower until the end of 2013, but reversed course in early 2014 after inflation picked up and came to threaten the upper band of the inflation targets set for the Reserve Bank. This higher inflation followed the high degree of rand weakness after 2011 that was linked (mostly) to global risk aversion and lesser flows to emerging market bonds and equities. This rand weakness persisted until May 2016 as the economy slowed down markedly under the influence of higher prices and higher interest rates. These higher interest rates further weakened demand that was already under pressure from higher prices, without appearing to do anything to slow down inflation. Inflation continued to tack its cue from a persistently weaker rand, while a drought and higher prices for staple foods added materially to measured inflation in 2015-2016.

These dilemmas for a monetary policy that attempts to meet inflation targets, without regard to the causes of inflation – the result of fewer goods and services supplied rather than more demanded – has meant having to sacrifice growth without reducing inflation. Such unfortunate trade-offs for monetary policy – achieving slower growth yet accompanied by more inflation – will persist if exchange rate changes remain largely driven by global forces or other supply side shocks. These include drought or higher expenditure taxes, to which the Bank has responded with higher interest rates regardless of the causes of inflation. For the history of inflation, interest and exchange rates since 2000, see the figure below that identifies the phases of higher and lower interest rates.

Figure 11: Interest rates, inflation rates and the trade weighted rand (2000-2016)

Source: SA Reserve Bank and Investec Wealth & Investment

The recovery in the rand over the last few months offers the hope of a cyclical recovery, similar to events after 2003 – though should it materialise it is unlikely to be of the same strong amplitude. The stronger rand brings less inflation in its wake, as would any normal harvest. Less inflation means less inflation expected and a much improved chance of interest rates falling rather than rising, as they have been doing since January 2014.

Lessons from Edcon

The Edcon story – was it a failure of capital structure or of management? Or a bit of both?

Bain and Company, a private equity fund, has thrown in the towel on its involvement with Edcon, a private company that it has owned and controlled since 2007. When it took over, it immediately converted the equity stake it had acquired from Edcon shareholders for some R25bn (with almost no long term debt on the Edcon balance sheet) into additional Edcon debt of some R24bn, with some additional finance of about R5bn provided as loans from its controlling shareholders. It has now reversed this transaction, converting the considerable outstanding debts of Edcon back into equity. Edcon is the owner and manager of Edgars, a leading clothing retailer as well of other retail brands, including CNA and Boardmans.

The 2008 balance sheet reported total Edcon assets of R38.1bn, up from R9.5bn the year before. Much of the these extra assets were created by writing up the intangible assets, including goodwill, that Bain had paid up for and raised Edcon debt against. The cash flow statement for 2008 reports “investments to expand operations: R24.4bn”. This was a euphemism – the cash was patently used to reconstruct the balance sheet, not to expand operations.

More important for the new shareholders than the description in its financial reports, it failed to persuade the SA Revenue Service (SARS) that the extra borrowing was undertaken to produce extra income. As a result, Edcon continued to have to use some of the cash it was generating from operations to pay significant amounts of tax as well as the interest it was committed to paying. In the early period, the 47 weeks to 29 March 2008, it paid cash taxes of R246m. And despite the fact that large ongoing accounting losses that were incurred as interest expenses greatly exceeded trading profits, it continued to deliver cash to SARS at the rate of over R100m per annum. More recently, according to the cash flow statement in the 13 weeks to 26 December 2015, cash taxes paid amounted to R32m.

This appears as a large mistake when Edcon was originally reconstructed. Presumably, had Bain registered a new company to buy out the Edcon assets from its shareholders and this company had then funded the purchase with debt, the interest expense would have been allowed as incurred in the production of income. And the consequent losses could have been carried forward to offset future income and to raise the current value of the company.

Much of this debt was to mature in 2014-15 (a commitment that Edcon was unable to fulfil) as was long apparent and well-reflected in the much diminished market value of its debt that traded on global markets. It will be appreciated that the Edcon financial losses have mostly been incurred by its creditors, not by Bain and Company. The statement of Edcon’s financial position in December 2015 reports a shareholders’ loan of R828m, well down from the more than R5bn recorded in 2008. Clearly Bain and its co-shareholders have walked away with nothing to show for their efforts. The company is by all accounts now worth less than was paid for it in 2008.

In the charts below we convert the 71% of Edcon euro debt it incurred into rands at current exchange rates. In January 2008 a euro cost R11.12. As may be seen, the rand value of this euro debt is now significantly higher than it was in early 2008. But the rand value of this original debt had actually fallen significantly by 2010, providing an opportunity to restructure the debt with profit that apparently was ignored.

And if the burden of this euro debt burden was dragging down the operating performance of the retail operations (denied essential working and other capital, as it has been argued by management) then there was ample opportunity surely to add more equity capital with which to compete with the competition. And the competition has been doing very well, partly at Edcon’s expense, as measured by value of the General Retail Index of the JSE.

We have rebased this index and the retailers’ dividend per share to January 2008. We have also converted these additional rand values into euros at current values. As may be seen, the share market backdrop for clothing retailers and their ilk on the JSE was encouraging, but more so in rands than in euros (until very recently) with its combination of weaker retail share prices and a weaker rand. It seems clear that had Edcon operated in line with its competition, it could have added value for its shareholders and its debt, particularly had it been converted to rand debt (which would have been manageable).


With the agreement of its creditors, who now own all of the shares in Edcon in exchange for cancelling its loans, and with new debt raised of about R6bn, Edcon can continue to operate normally, much to the relief of it managers, workers and landlords. The horrors of business rescue have thus been averted, to the presumed advantage of its creditors and its future prospects. Given that Edcon continues to realise significant trading profits, it makes every sense for it to stay in business to deliver value for its new shareholders. For the third quarter of F2016 Edcon reported a trading profit of R763m and depreciation and amortisation of R248m, making for cash flows from operations of over R1bm for the quarter (though down by 7.7% on Q3 of F2015). Net financing costs of R958m for Q3 F2016 were also reported, 10% higher than Q3 in F2015. Coincidentally the debt on the Edcon balance sheet of F2016 was of about the same rand book value of about R22bn it reported in F2007. Its euro value, as may be seen, is considerably lower.

Bain and its funders clearly failed to realise the prospective gains they envisaged when they geared up the Edcon balance sheet. The potential rewards to the owners of the much reduced equity capital were potentially very large had the company proved able to service its debts. On returning to public company status, the possibly R5bn of equity finance provided might have doubled in value had the market value of the company gained an additional R10bn of value over the 10 years.

To put it another way: had Edcon performed as well as the average general retailer did on the JSE over the period, these gains would have been realised. But the average JSE-listed clothing retailer was not encumbered by nearly as much debt, particularly the 71% of its debt denominated in euros. This appears as the major original strategic error made by Bain to which it never made the adjustment. Combining rand revenues that Edcon would generate, with hard currency debt, represents a highly risky strategy. Perhaps the SA debt market would not have been willing to subscribe the large amount of the extra debt raised. But there was surely always the opportunity to fully hedge the foreign currency risk. But this would have meant paying interest at a South African rather than a euro or dollar rate, a cost that, had it been incurred, may well have (correctly perhaps with hindsight) undermined the investment case for a highly leveraged play on the SA retail market.

The Edcon experience has unfortunately not been able to add to the case for private equity over the public equity alternative in SA, that is to say, to use public money to take a (large) listed company private. The case for private equity is not based on its superior financial structure of more debt and less equity, though clearly the leverage adds greatly to the potential returns for equity holders (assuming all turns out well for the company). Moreover, the conversion of a public company to a private one, through private equity funds, or more or less the same thing, through a management buyout, may not be possible without significant reliance on debt finance. The case for private equity is that the few shareholders with much to gain and lose have every incentive to closely and better manage their stake in the company. They will be very active shareholders with highly concentrated investments, unlike those of the average listed company with wider stakeholders, as opposed to shareholder interests, to serve. The large publicly funded private company represents therefore a very helpful competitive threat to the public company, from which shareholders (including pension funds) the economy and its growth prospects can benefit.

It is thus no accident that the number of companies listed on all the US stock exchanges has declined dramatically over recent years, by between 40% and 60% over the past 25 years according to different estimates, as pension funds and endowments have increased their allocations to alternative investments and especially to private equity funds. Private companies may well, on a balance of full considerations, serve their owners better than public companies.

The competitive threat therefore should be encouraged and not discouraged (including by SARS). The objective of tax policies should be much wider than merely protecting the tax base. Private equity, by adding to the growth potential of an economy and especially adding to the willingness of the system to bear additional risks for the prospect of additional returns, deserves no less or more than equal tax treatment.

For its errors of commission and omission, Bain and the managers it chose for Edcon, were unable to improve its operating performance. How much this equity is now worth is a matter of conjecture that can only be resolved when, as is the intention, these Edcon shares are re-listed on the JSE. The sooner the current Edcon shareholders get to know what their shares are worth, surely the better and the sooner the shares can be listed and so could pass into the hands of perhaps more active investors, the better the company can be expected to perform. 27 September 2016

Some hope of an economic revival is in the spring air

The Reserve Bank, not before time, has changed its tone. It has suggested that the interest rate cycle may have peaked. From the pause in the trend to higher rates we now have talk of a longer pause in interest rate settings. If the exchange rate holds up better than R14 to the US dollar by the next time the Monetary Policy Committee (MPC) meets in November, interest rates may well be on their way down. The Bank’s inflation forecast (if not the year on year change in the CPI, headline inflation itself) will have had time to adjust lower and food price inflation will be in retreat from its extraordinarily elevated 12% plus base. How rapidly this occurs will depend on the rain. Prayers for rain are in order.

If all goes better on the inflation front, the Reserve Bank will be able to focus on something very important to the SA economy over which it does have considerable influence and that is domestic spending and lending. Its interest rate settings do predictably affect the willingness of households and firms to spend more; and the SA economy urgently needs the stimulus of more demand and lower interest rates.

These interest rates however have no predictable influence on the exchange rate, rainfall or on excise and other taxes, including fuel and sugar taxes. Nor do they affect the price of electricity except, perversely, should Eskom persuade Nersa, the regulator, that its higher borrowing and other costs are a good (actually bad) excuse for a higher tariff. Nor, as I would argue, though the MPC would disagree, do higher interest rates influence inflationary expectations for the better and/or wage demands for the better.

Inflation expected (which has remained remarkably stable and consistent around the 6% – the upper band of the inflation target level will follow inflation – not the other way round. Inflation leads and inflation expected follows, as will be further demonstrated should inflation come down because the rand has strengthened and long term interest rates decline relative to US interest rates, meaning less rand weakness expected and hence less inflation expected. This narrowing of the spread between RSA and US benchmark interest rates has been under over the past few days. It is a very helpful development.

With some help from global capital flows, the weather and the politicians (and also the rating agencies) we will see the rand hold up inflation and the inflation forecasts continue to recede. The question then will be how low can interest rates in SA go. I would suggest as low as it takes to get the growth in spending running at a sustainable 3- 4% per annum. The sustainability of such growth will depend upon support from capital inflows and so a stable rand itself. Faster growth itself will be very encouraging not only to capital expenditure by firms and the government – but to global suppliers of capital. Can we dare hope for a virtuous cycle of faster growth with less inflation? A reprise perhaps of 2003-2008, accompanied by much better control of money supply and bank credit?

Help or hinder?

GDP grew in the second quarter, despite very weak spending. Without a recovery in spending the SA economy will continue to struggle. Will the Reserve Bank help or hinder a recovery?

The SA economy, measured by GDP (the real output of goods and services) grew in the second quarter (Q2), at a satisfactory (annual equivalent) rate of 3.3%. In the first quarter (Q1) output had declined at a -1.3% annual rate. Hence the economy avoided a recession – defined conventionally as two successive quarters of negative growth. However an examination of the expenditure side of the economy reveals a much less satisfactory state of economic affairs. Total spending, Gross Domestic Expenditure (GDE) in real terms declined in Q2 by as much as GDP increased, at a -3.3% rate. The difference between GDP and GDE is by definition net exports: the difference between exports that add to domestic output and imports that substitute for domestic output. On a seasonally adjusted basis, export volumes grew very strongly in Q2, while import volumes declined enough to add a net 6.7% to the GDP growth rate.

Final demand makes up a large component of GDE. It aggregates the compensation spending by households and government and the expenditure by government agencies and the private sector on additional capital goods. This aggregate declined (by 0.1%) in Q2 – an improvement on the 2.8% decline estimated in Q1. The further component of GDE is inventories accumulated or run down. In Q2 inventories are estimated to have declined by a real R22.7bn, contributing a large negative (-3.2% p.a) to the GDP growth rate in Q2.

When the spending of households is aggregated with that of privately owned businesses on capital equipment, that is when government spending and investment in inventories are excluded from final demand, we find a similar reluctance of private households and firms to spend more. Private demand for goods and services has been growing at consistently slower rates in recent years appears and now appears to be in retreat, having declined marginally in Q2 2016, not quite keeping up with inflation, defined as the year on year increase in the GDP deflator. The supply of money and bank credit has been growing as slowly as private spending. This is clearly not co-incidental. The growth in spending and credit to fund spending tend to run together.

The performance of the economy in recent years indicates clearly that the increases in interest rates imposed on the economy since January 2014, while they have worked to reduce spending and so the growth in GDE and GDP, have not helped in any significant or predictable way to reduce inflation or inflation expected. Inflation in SA – that leads rather follows inflation expected – has been dominated by shocks in the form of a weaker exchange rate that has driven up the prices of imported goods and a drought that has reduced domestic supplies of food staples and increased dependence on imports. Higher regulated prices and taxes on expenditure have added to the supply side shocks that can drive prices higher – despite weak demand that only to a limited extent has helped to hold back prices. The exchange rate itself has taken its cue, not from interest rates set in Pretoria, but in Washington DC. It is not only the rand but all emerging market currencies that have depreciated as capital flowed to developed, rather than less developed markets, in recent years. Moreover wage rates and prices are determined simultaneously and interdependently in SA. Higher wages have come at the expense of employment opportunities as well as recent profit margins, when final demand is lacking and the firms lack a degree of pricing power.

The reality that the Reserve Bank finds so hard to recognize is that scope for an independent monetary policy to control inflation is very limited if the domestic authorities do not have any consistent influence over the exchange rate. This has been the case for South Africa as it is for most emerging market central banks with flexible exchange rates that respond to highly unpredictable capital flows. The figures below demonstrate that the common global rather than SA forces that have been responsible for almost all of the weak rand and the higher prices that have come with it. The EM Currency basket represents nine equally weighted emerging market currencies (The Russian ruble, Indian rupee, Hungarian forint, Mexican, Chilean and Philippine pesos, Turkish lira, Brazilian real and Malaysian ringgit). Though it must be added, the rand has been a distinct underperformer since 2012 – losing about 20% more than the EM basket Vs the US dollar. The current value of the rand is now (20 September) a little ahead of where it would be predicted to be – given the exchange value of the EM basket as its predictor – and so also taking into account the weaker bias against the rand.

The Reserve Bank, through its unhelpful interest rate and money supply actions, has significantly influenced the growth in spending. Higher interest rates may have reduced measured GDP growth by as much as 2% p.a. The limited feedback loop from interest rates to spending and so on to inflation has been dominated by the independence of SA interest rates and other highly unpredictable forces acting on the exchange rate and administered prices. The hope for a cyclical recovery of the SA economy and the lower interest rates that will be necessary to the purpose, rests on a degree of rand stability that will accompany a revival of capital flows into EM markets and currencies. A normal harvest will also help to hold down inflation in 2017.

It will take lower interest rates to encourage the demand for and supply of bank credit. It will take lower inflation and inflation expected to encourage the Reserve Bank to lower short term rates. It would seem self-evident, given the want of demand for goods and services and for the labour to help produce them, that the direction of SA interest rates should be downward rather than upward.

The highly competitive weak rand – now some 30% below its purchasing power equivalent value (see below) will continue to encourage exports (labour relations permitting) and discourage imports and may help sustain GDP, as it did in Q2 2016. However, given the importance of household spending for the economy, accounting as it does for over 60% of all spending and given also the further dependence of capital expenditure by private companies on the demands households make on their established capacity, any consistent recovery in the SA and the weak economy – will require the stimulus of lower interest rates. We can hope that a stable or better, a stronger rand and less inflation, makes this possible. We can also hope for a more realistic and helpful narrative from the Reserve Bank that recognises that interest rates influence growth much more than inflation and that maintaining growth rates is a highly appropriate objective for monetary policy – especially when controlling inflation is not within its control. 20 September 2016


The paradox of competition

The paradox of competition. You can lose because you have won the game.

When portfolio managers and active investors value a company, they are bound to seek out companies’ advantages that can keep actual and potential competitors at bay. Moreover, they seek companies with long lasting, hopefully more or less permanent, advantages over the ever likely completion, advantages that will not “fade away”, in the face of inevitable competitors.

The talk may be of companies protected by moats, preferably moats that surround an impregnable castle filled with crocodiles that keep out the potential invaders, that is the competition. Reference may be made to protection provided by loyalty to brands that translate into good operating profit margins; or to intellectual property that is difficult for the competitors to replicate and reduce pricing power. It’s a search for companies that generate a flow of ideas that lead to constant innovation of production methods and of products and services valued by customers; and those with good ideas that will receive strong encouragement from large budgets devoted to research and development that can help sustain market leading capabilities through consistent innovation that keeps competitors at bay.

Such advantages for shareholders will be revealed in persistently good returns on the capital provided by shareholders and invested by the team of managers – managers who are well selected and properly incentivised, and also well-governed by a strong board of directors, including executive directors with well aligned financial interests in the firm. Furthermore, the best growth companies will have lots of “runway” – that is a long pipeline of projects in which to successfully invest additional capital that will be generated largely through cash retained by the profitable company. By good returns on capital is meant returns on capital invested by the firm (internal rates of return: cash out compared to cash in) that can be confidently predicted to consistently exceed the returns required of similarly risky shares available on the share market, that is market beating returns.

Such companies that are expected to perform outstandingly well for long, naturally command very high values. Their high rates of profitability – high expected (internal) rates of return on the shareholder capital invested – will command great appreciation in the share market. High share prices will convert high internal rates of return on capital invested into something like expected normal or market-related returns. The virtues will be well reflected in the higher price paid for a share of the company. Thus the best firms may not provide exceptional share market returns, unless their excellent capabilities are consistently under appreciated. This is an unlikely state of affairs given the strong incentives active investors and their advisers have to search for and find hidden jewels in the market place.

Such excellent companies – market beating companies for the long run – are therefore highly likely to enjoy a degree of market dominance. Their pricing power and profit margins will be testament to this. In other words, they are companies so competitive that they prove consistently dominant in their market places.

But such market dominance – that has to be continuously maintained in the market place serving their customers better than the competition – has its own downside. It is bound to attract the attention of the competition authorities. The highly successful company – successful because it has a high degree of market dominance – may have to prove that it has not abused such market dominance. The fact that the returns on capital are so consistently high may well be taken as prima facie evidence of abuse that will be hard to refute. It may well be instructed to change business practices that have served the company well because they do not satisfy some theoretical notion of better practice. Such companies have become an obvious target for government action.

Foreign-owned companies that achieve market dominance outside their home markets may be particularly vulnerable to regulation. These interventions are designed perhaps to protect more politically influential but in reality less competitive domestic firms. Hence the actions taken by the European competition authorities against the likes of Google, Facebook and Microsoft who have proved such great servants of European consumers.

And so one of the risk of competitive success is that such success will be penalised by government action. A proper appreciation that market dominance is the happy result of true competition that has proved to be disruptive of established markets, through the innovation of products and methods, would avoid such policy interventions that destroy rather than promote competition.

Market forces and market dominance can be much better left to look after themselves, because innovation is a constant disruptive threat for even the best-managed and dominant firms. These firms will know that dominance may well prove to be temporary and so they will behave accordingly, by serving their customers who always have choices and by so doing satisfying their shareholders. 14 September 2016

The golden question

Gold and gold mining companies – is there a case to be made for including them in portfolios?

Gold mining companies listed on the JSE have been enjoying a golden year. The JSE Gold Mining Index (rand value) has gained over 200% this year (see figure 1 below). This outperformance of gold mining shares has much to do with improved operating results, gold mining specifics, more than with the gold price, though in US dollar terms the gold price has enjoyed something of a recovery in 2016. In figure 3, we show the daily price of gold in US dollars and rands going back to 2006. As may be seen the rand price of gold has risen more or less consistently since 2006 while the gold price rose very strongly and consistently in USD until 2011 where-after it fell back sharply – until the modest recovery of 2016.

We show in figure 3 below how far the performance of the gold miners so lagged behind that of the JSE All Share Index until 2016. The weight of gold shares in the JSE ALSI is now about 3.1% up from 1.45% at the start of 2016. In figures 4 and 5 we compare the performance of the gold miners to other sectors of the JSE. As may be seen, the JSE Industrials have been the outstanding performers over the longer run- but not in 2016. The higher rand price of gold clearly did not translate into higher operating profits in rends or USD. As may be seen investors would have done far better holding gold itself rather than gold shares for much of this period – until very recently.

As may be seen in figure 6 above, the JSE Gold Mining Index has been a distinct underperformer since 2005 – though it outperformed briefly in 2006 and again during the Financial Crisis of 2008-09 and then again, making up for some of the lost ground again this year. R100 invested in the Industrial Index on 1 January 2005 would now be worth over R771; and in the Gold Index about R152; while the R100 invested in the All Share Index would now be worth about R423. The rand price of gold rose by 7.7 times over the same period, gaining as much as the Industrial Index as we have shown in figure 3.

The Gold Index has also been twice as risky as the All Share Index. We show daily price moves in 2016 in 2016 in figure 7 below. When measured by the Standard Deviation of these daily percentage price moves, Gold Mining Shares listed on the JSE have been about twice as risky as the JSE All Share Index in 2016. The JSE All Share Index however has proved only slightly less risky than holding a claim on the rand gold price in 2016. The same pattern holds for much of the period 2005-2016, using daily price movements. On average the JSE Gold Index, on a daily basis, has been about twice as volatile as the All Share Index and the rand gold price. Thus the risk adjusted return expected from the gold mines would have to be significantly higher than that expected from gold itself, or from a well-diversified portfolio of JSE listed shares, to command a place in a risk averse portfolio.

Doing well out of gold shares surely would have demanded exquisite timing – both when to buy and when to sell. It is not a sector to buy and hold stocks for the long term. It is a highly cyclical sector of the market, with no long term growth prospects. And as we have illustrated, investing in gold mines, rather than in gold, is much more than an investment in the gold price. It is an investment in the capability of the mine managers to extract profits and dividends out of gold mines that are the quintessential declining industry.

Gold mines run out of gold as SA gold mines have been doing consistently for many years. Deeper mines are more costly and dangerous to operate and green field expansion is subject to more expensive regulation, to protect the environment as well as miners. All these considerations help make the case for gold over much riskier gold mines, though the stock of gold available to be traded will remain many times annual output over the long run. The market for gold is a stock market rather than a flow market. It is demand for the stock rather than extra supplies that drive the price.

It would appear easier to explain the price of gold than the value of a gold mine. Since gold does not pay interest, the cost of holding gold is an opportunity cost – income from other assets foregone when holding gold. Using US real interest rates – the real yield on a US Inflation Linked Bond of 10 year duration has done very well in explaining the US dollar value of an ounce of gold since 2006. The correlation between the daily level of the gold price and the real interest rates has been as high as a negative (-0.91) (see figures 9 and 10 below). In other words, as the cost of holding gold has gone up or down (as measured by the risk free real interest rate) the gold price in US dollar has moved consistently in the opposite direction. Real interest rates in the US fell consistently between 2005 and 2011 encouraging demand for gold – then increased to a higher level in 2013, where they stabilised until declining again in 2016, providing it would seem, a further boost to the price of gold. These real interest rates reflect the global demand for capital to invest in productive assets. They have been declining because of a global reluctance to undertake real capital expenditure and so to borrow for the purpose. Low real interest rates reflect slow global growth. And so gold has been a good hedge against slow growth, as well as insurance against financial disruption.

Inflation-linked US bonds have provided some protection against the S&P 500 – the daily correlation between the 10 year TIPS yield and the S&P 500 Index was a negative (-0.43) between 2006 and 2016 while the correlation between the S&P and the level of the gold price is a positive, though statistically insignificant (0.18). The correlation of daily moves in the S&P and the TIPS yield is a positive (0.23) and negative (-0.20) between daily changes in the gold price and the S&P. As important, the correlation between daily moves in the gold price and the S&P 500 are close to zero. Gold has been a useful diversifier for the S&P Index.

This past performance suggests that gold can be held in the portfolio as a potentially useful hedge against economic stagnation – stagnation that means low real interest rates – and also as insurance against global financial crises. The case for gold shares is much more difficult to make on the basis of recent performance. The problem with holding gold shares is the difficulty and predictability of turning a higher gold price into higher earnings for shareholders. Shares in gold mining companies comes with operational risks. If the gold miners could resolve these operational issues then gold shares could become a highly leveraged play on the gold price. The share price would then reflect the increased value of gold reserves: gold in the ground as well as gold above it.

Not all gold mines will be alike. The search should be on for gold mines with significant reserves of gold and highly predictable operating costs and taxes and regulations. The more highly automated a gold mine, the better the mine will be in this regard. Gold mines with these characteristics could give highly leveraged returns to changes in the gold price – in both directions – making them more attractive than gold itself for insurance and risk diversification.


Taking a bite of the Apple

The European competition authorities have ruled that Apple has wrongly benefitted from a tax deal with Ireland that allowed Apple to avoid almost all company taxes on its sales in Europe, the Middle East and Africa. The €13bn company income tax Apple is estimated to have saved on the taxes has been classified as state aid to industries. Hence illegally and to be refunded to the Irish government in the first instance- plus interest. No doubt other European governments and maybe even South Africa (assuming the Treasury is not otherwise engaged) will be looking to Ireland for their share of the taxes unfairly saved on the Apple income generated in their economies and transferred through their tax haven in Ireland.

The principle that taxes should be levied equally – at the same rate – on all companies generating income within a particular tax jurisdiction seems right. But it is a principle much more honoured in the breach than the observance. The effective rate of tax (taxes actually paid on economic income consistently applied) will vary widely within any jurisdiction, with the full encouragement of their respective governments. The company tax rate may vary from country to country – in Ireland it is a low 12.5% is levied on income that may be defined in very different ways from one tax authority to another from company to company.

A company may benefit from a variety of incentives designed to stimulate economic activity generally and capital expenditure in a particular location, perhaps in an export zone or a depressed region or blighted precincts of a city. They may utilise incentives to employ young workers or to train them. Investment allowances may far exceed the rate at which capital is actually depreciating to encourage capex. And governments may well collaborate in R&D that effectively subsidises the creation of intellectual property. A further important source of tax savings comes from the treatment of interest payments on debt. The more debt, the higher the tax rate, the less tax paid or deferred. And so every company everywhere (not just Apple) manages its own effective tax rate as much as the law allows it to do. It would be letting down its owners (mostly affecting the value of their shares in their retirement plans) if it failed to pay as little tax it can.

But then this raises the issue that Apple has already raised in tis defence as has the US government. How does one value the intellectual property (IP) in an Apple device? And who owns the IP and where are the owners of the IP located? In Europe – at the head office post box in Cork or in California where much of the design and research is undertaken? Operating margins are very large – maybe up to 90% of the sales price in an Apple store. What if Apple California charged all its subsidiaries everywhere heavily for the IP that accounts for the difference between revenues and costs? Profits and income in Europe and Africa could disappear and profits in the US explode given very high US company tax rates. The reason Apple does not or has not run its business this way is obvious enough; it has been able to plan its taxes and cash holdings to save US taxes.

The insoluble problem with taxing companies and determining company income is that company income is not treated as the income of its owners – or as it would be in a business partnership. In a partnership (which can be a limited liability one) all the wages and salaries, interest, rents, dividends or capital gains are treated as income and taxed at the individual income tax rates. Total taxes collected (withheld) by the partnership could easily grow rather than decline given that there would be no company tax to shield. And the value of companies absent taxes would increase greatly, calling for a wealth as well as a capital gains tax on their owners. The problem with company tax is company tax. The world would be better without it.1 September 2016


Point of View: PPC and the debt vs equity debate

Is debt cheaper than equity? PPC shareholders will argue otherwise.

That debt is cheaper than equity is one of the conventional wisdoms of financial theory and perhaps practice. It appears to reduce the weighted average cost of capital (WACC). The more interest-bearing debt as an alternative to equity capital used to fund an enterprise, and the higher the company tax rate, the lower the WACC.

Yet while debt may save taxes it is also a much more risky form of capital. Even satisfactory operating profits may prove insufficient to pay a heavy interest bill or, perhaps more important, allow for the rescheduling of debts should they become due at an inconvenient moment. And so what is gained in taxes saved may be off-set (and more) by the risks of default incorporated in the cost of capital (the risk adjusted returns demanded and expected by shareholders) the firm may be required to satisfy.

Hence debt may raise rather than reduce the cost of capital for a firm when the cost of capital is defined correctly, not as the weighted by debt costs of finance, but as the returns required of any company to justify allocating equity and debt capital to it – capital that has many alternative applications. It is a required return understood as an opportunity rather than an interest cost of capital employed – equity capital included – the cost of which does not have a line on any profit and loss statement.

With hindsight the shareholders in PPC would surely have much preferred to have supplied the company with the extra R4bn of equity capital, before the company embarked on its expansion drive outside of SA in 2010, as they have now being called upon to do to pay back debts that unexpectedly came due. And had they, or rather their underwriters (for a 3% fee) not proved willing to add equity capital – the company would have in all likelihood gone under – and much of the R9 per share stake in the company they still owned on 23 August when the plans for a rights issue were concluded, might have been lost. Their losses as shareholders facing the prospect of defaulting on their debts to date have been very large ones, as we show in the figure below, but the R4bn rights issue promises to stop the rot of share value destruction.

The debt crisis for PPC was caused by a sharp credit ratings downgrade by S&P. This allowed the owners of R1.6bn of short term notes issued by PPC to demand immediate repayment of this capital and interest, which they did. Banks were called upon to rescue the company and the rights issue became an expensive condition of their assistance. That the company could make its self so vulnerable to a ratings downgrade, something not under its own control, speaks of very poor debt management, as well as what appears again with hindsight, as too much debt.

Having said that, on the face of it, the company has maintained a large enough gap between its earnings before interest and its interest expenses to sustain itself. In FY2016 these so-called “jaws” are expected to close sharply, on lower sales revenue, though they are expected to widen sharply again in 2017. According to Bloomberg, in FY2015, PPC earnings before interest were R1.660bn and its interest expense R490m, leaving R1.052bn of income after interest. In FY2016, earnings before interest are expected to decline sharply to R751m, the result of lower sales volumes, while interest expenses are expected to fall to R318m, leaving earnings after interest of R507m. Adding depreciation of R393m leaves the company with earnings before interest tax depreciation and amortisation (EBITDA) of R1.144bn in 2016 – just enough to fund about R1.068bn of additional capex. A marked improvement in sales, earnings and cash flows in the years to come has been predicted.

The rights at R4 per additional share were offered on Tuesday 23 August at a large discount of 55.5% to the then share price of R8.99. This discount is of little consequence to the existing shareholders. The cheaper the price of the shares they are issuing to themselves, the more shares they will have the presumed valuable rights to subscribe for or dispose of. Their share of the company is thus not being reduced even though many more PPC shares may be issued. They can choose to maintain their proportionate share of the company, or to be fully compensated for giving up a share by selling their rights to subscribe to others at their market value.

What is of significance to actual or potential shareholders is the amount of the capital being raised. The R4bn capital raised through the issue of 1 billion additional shares (previously 602m) should be compared with the share market value of the company that was but R5.477bn on 24 August 2016. The capital raising exercise is a large one and the success with which this extra capital is utilised will determine the future of the company.

The discount itself makes it very likely that shareholders, established or newly introduced, rather than the underwriters, will sell or take up their rights that will have some attractive positive value. The larger the discount for any given share price, the more valuable will be these rights (all other influences on the share price remaining unchanged – which they are unlikely to do.). These rights will sell for approximately the difference between the R4 subscription price and the value of the shares to which the rights are attached, between 2 September and until the rights vest on 16 September. The higher or lower the PPC share price between now and then, the more or less will be the value of the right to subscribe at R4, though such rights can only be traded after 2 September, when the share price will fall to reflect the larger number of shares to be issued.

The circular accompanying the Final Terms of the Rights Issue refers to a theoretical value of the shares once they begin trading after 16 September as R5.92 per share, that is given the share price on the day of the announcement, of R8.99. A better description of this theoretical value would be to describe it as the break-even price of the shares. This is the price that would enable shareholders or underwriters to recover the additional R4bn they will have invested in the company when the shares trade ex-rights. In other words it is the future price for the 1.6 billion shares in issue that would raise the market value of the company by an extra R4bn. equivalent to the extra capital raised – or from the R5.66bn it was worth on 23 August to R9.66bn.

Since the additional R4bn raised by the company is assured by the underwriters, the question the shareholders will have to ask themselves is whether or not the extra capital they subscribe to at R4 per share will come to be worth more than R4 per share plus an extra – say 15% p.a. – in the years to come. 15% is the sum of the risk free rate, the return on a RSA 10 year bond of about 9% plus an assumed equity risk premium of 6% p.a., being the returns they could expect from an alternatively risky investment. If the answer is a positive one, they should take up their rights, and if not they should sell their rights to others who think differently. Though any reluctance to take up the rights will reduce their value.

Until the rights offer closes on Friday 16 September and until shareholders have made up their minds to follow their rights or sell them, the target they will be aiming at (for their proportionate share of an extra R4bn of value) will be a moving one, as the PPC share price changes and as both the shares and the rights trade between 2 September and 19 September 2016. The higher (lower) the share price between now and then the higher (lower) will be this break even share price1. The PPC share price closed on Friday 26 August at R8.75, reducing the breakeven price from R6 marginally to R5.91 per share.

The value of a PPC share hereafter, initially with and later without rights, will depend on how well its managers are expected deploy the extra capital they will have at their disposal both now and in the future. Reducing the debt of the company by R3bn, as intended, appears necessary to secure the survival of the company. This reduction in debt will reduce its risks of failure and perhaps add value for shareholders by reducing for now the risk-adjusted returns required by shareholders. That is to reduce the discount rate applied to future expected cash flows.

What however will be the most decisive influence on the PPC share price over the next 10 years or more will not be its capital structure (more or less debt to equity) but the return on the capital it realises and is expected to realise. How the capital is raised, be it from lenders, new shareholders or from established shareholders in the form of cash retained, will be of very secondary importance. Unless, that is, the company again fails to manage its debt and equity competently – a surely much less complicated task than managing complex projects. 29 August 2016


1The breakeven price (P2) can be found by solving the following equation P2=(S1*P1)+k))/S2, where S1 is the number of shares in issue before the rights issue (602m) in the case of PPC and S2 the augmented number (1602m) while the additional capital to be raised, k, is R4bn. P1 is the share price before the rights can be exercised (R5.92 on 23 August) change or the share price plus the market value of the right – in the PPC case the right to subscribe to an extra 1.6 shares at R4 a share.

Competition policy in SA – in whose interest is it?

Mergers and acquisitions (M&A) are vital ingredients for a well performing economic system. Through M&A, the better-managed firms take care of the weaker performers leading to better use of the economy’s scarce resources. The success of M&A will be measured in the returns on the capital (debt and equity capital) so risked. The shareholders and the managers acting for the acquiring companies must hope for returns above the required risk-adjusted returns set for them in the market place. If they succeed, they will be improving the economy (improving the relationship between inputs and outputs) and adding wealth for their shareholders. There is a clear public interest in successful M&A activity.

But any such agreement reached between the buyer and seller of a whole company (or part of it) has a further hurdle to clear. The government may decide that the planned merger should be disallowed in a different public interest or, if permitted, that it should be made subject to conditions that can make the takeover more expensive and the larger business less successful. Increasingly, this has become the practice of competition policy in SA, especially when the intended acquirer is a large foreign-owned company.

What has been demanded of the foreign acquirer, even when the intended merger is judged to increase, rather than reduce potential competition in the market place, can only be described as a shakedown exercised by the competition authorities. For example, the demands made of Walmart in its takeover of Massmart and, more recently, in similar demands made of AB Inbev in its takeover of SABMiller. These are unpredictably expensive interventions in business relationships that add to the cost and risks of M&A. They will discourage such attempted activity and the ordinarily welcome flows of financial and intellectual capital accompanying M&A initiated offshore. It is perhaps good politics, but very poor business practice that is unhelpful to economic growth.

Perhaps more damaging to the economy and to the owners of businesses are the now usual conditions for approval, which stipulate that employment be guaranteed at pre-merger levels. Such demands must make it harder to realise the cost savings that a merger might otherwise make possible. A competitive economy, actively competing for labour and capital, so as to improve returns on capital and the productivity of labour through M&A, is inconsistent with guaranteed employment. There is a public interest in employing labour most productively and in labour mobility – not in guaranteed employment that benefits a few private interests.

In recent rulings, the Competition Commission has extended its reach further to the boardroom, in effect instructing merger intending managers and owners how to run their operations. To approve the merger of Southern Sun Hotels with listed hotel-owning company Hospitality, it demanded that the latter be managed independently by its own executive team “.. that would not include anyone who is involved in management in any capacity at Southern Sun”. Thus the rights and responsibilities that come with ownership were truncated. It came to a similar recent ruling, for similar reasons, the presumed sharing of presumed confidential information, on African Rainbow Capital’s deal to buy 30% of the shares in ooba — a mortgage originator controlled by SA’s biggest estate agencies.

What the Commission seems unable to recognise is that competition of the kind that most effectively challenges established firms will come from innovation and the application of technology, not from current participants and current practice. A good example of this is the large current and future threat to the pricing and other power of hotel owners and operators in Cape Town that comes from Airbnb, which has a large and growing presence in the Cape Town market.

The competition authorities in SA are in danger of overreach, if not hubris. It would benefit from a better understanding of and more respect for dynamic market forces and be much less inclined to interfere with them. And so would the economy and its growth prospects.

Tough Love

National Minimum Wage Panel – do your duty and offer tough love and resist the arguments for economic miracles.

The government has (thankfully) decided to kick the National Minimum Wage (NMW) into touch. The hope must be that the panel come to advise that any NMW high enough to make a meaningful difference to the circumstances of the working poor, is a very bad idea. It’s a bad idea because it cannot offer much poverty relief (to those who keep their jobs) without destroying the opportunity for many more in SA, particularly the young and inexperienced and those outside the cities, to find work.

The problem is that even many of those who find work (mostly in the cities), at the lower end of the wage scales, remain poor. The working poor in SA have been defined as those who earn less than R4000 per month. Yet the problem is that most of those with jobs in SA earn much less than this, while a large number of potential workers are unemployed and earn no wage income at all.

According to a comprehensive recent study of the labour market in SA by Arden Finn for the University of the Witwatersrand, 48% of all wage incomes, representing 5m workers, fell below R4000 per month in 2015 and 40% earned  less than R3000 per month, about 2.7m workers out of a total employed of about 13m. The proportion of those employed who fall below R4000 are much higher in the rural areas, higher in agriculture (nearly 90%) and domestic services (95%). In mining, 22% of the work force earned less than R4000 per month in 2015, while in the comparatively well paid and skilled manufacturing sector, about 48% of the work force were estimated to earn less than R4000 per month.

How many would lose their jobs? And how many would hold on to them to receive the promised benefits of higher minimum wages? These are the numbers that would have to be estimated by the panel. They would have to allow for all the other independent forces at work, other than wages, that could favourably or unfavourably influence numbers employed. For those on the panel who believe that SA can repeal the laws of supply and demand for labour and that wages have little to do with what workers are expected to add to business revenues, and so higher minimums can happen without very unhelpful employment effects – there is a question they will have to answer.

If a higher NMW can make such a helpful difference to poverty without serious consequences for the unemployed and their poverty, why not set the NMW ever higher?  If an NMW of R4000 a month is not enough to escape poverty, why not double or treble these minimums? They must surely agree that the number of job losses would increase as the distance between current wages and the intended minimums widened. Agree, that is, that the only way to avoid extra unemployment would be to set the minimums very close to actual minimum wages in the very different locales where they are earned, a symbolic rather than a practical gesture.

The panel could turn to the well-known relationship between employment, employment benefits and output (measured as value added or contribution to GDP) in the formal sector of the SA for evidence that improved employment benefits, for those who keep their jobs, leads to less employment for the rest. GDP has grown consistently while employment has stagnated and the numbers unemployed have risen as the potential work force has grown. Yet the real wage bills have grown more or less in line with real GDP. In other words, the percentage decline in the numbers employed has been less than the percentage increase in employment benefits paid out. Nice work if you can get it and too many South African have not got it. And wages and profits have maintained their share of value added. Firms have adapted well to more expensive labour; the unemployed have not been able to do so. Their interests should be paramount in policy action.

An NMW set well above market related rewards will reinforce such trends. It will not be fair to the non-working poor nor promote economic growth, the only known way to truly relieve poverty and raise wages over time. It is the duty of economists to practice tough love – to recognise the inevitable trade-offs should a NMW be introduced. We can but hope the panel will do its duty and resist politically tempting actions that have predictably disastrous effects. After all, if we knew how to eliminate poverty with a wave of a wand (the NMW is such a wand) we would have done so a long while ago.


Explaining the strength in emerging equity markets

This year is proving a very good one for emerging markets (EM) after years of lagging behind the S&P 500 (see figure 1 below).


Capital flows being good for EM equities (and bonds) have also been helpful for EM currencies, including the rand, and so the JSE, while it usually performs in line with the EM when measured in US dollars, has offered well above average EM returns to the offshore investor on the JSE this year (see Figure 2 below). As we have explained in earlier reports, strength in EM equities and bonds has a consistently favourable influence on the exchange value of the rand and most other EM currencies.

The question then arises of why are EM capital markets attracting revived interest from global investors? Is it simply the search for yield in a low yield, low expected return world? Or is there more substance to the switches to EM investors are making in the form of improved economic outcomes and better growth in EM economies and earnings from EM-listed companies to come. We provide some answers below that indicate the substance behind the strength in EM equities, including those listed on the JSE.

The underperformance of EM equities since 2011 has been accompanied- by weak earnings – earnings per share that have lagged well behind those generated by the S&P 500 Index. As may be seen in figure 3, S&P 500 earnings measured in US dollars compared to EM or JSE earnings in early 2010 , are more than 80% ahead, when measured in US dollars. The underperformance of EM equities has been highly consistent with this underperformance, as has the strength of the S&P been consistent with the impressive recovery in S&P earnings.


It should however be noted below in Figure 4 that EM and JSE earnings, having suffered a severe decline in 2015 led by lower commodity prices, appear to have reached a cyclical trough and are now increasing from their low base, while S&P earnings are also now pointing higher, after declining since early 2015. This revival in average earnings must be regarded as helpful for equity valuations generally, especially in a world of very low interest rates. That EM and S&P share prices moves have been highly correlated in 2016 is consistent with a similarly higher trajectory for earnings, especially should recent trends be sustained, as has been indicated.

The similar path of JSE earnings and that of the EM average – of which the JSE contributes only a small part, about 8% – should be recognised. It goes a long way to explain the similar direction of the EM Index and that of the JSE, when measured in US dollars. The JSE behaves as an average EM equity market because JSE earnings compare very well with the EM average. This is because JSE-listed companies, including industrial companies, are highly exposed to the global economy, even more than the SA economy.


In figure 5 below, we compare the average prices investors have been paying for average earnings. As may be seen, investors in the S&P Index have enjoyed a significant increase in the average P/E multiples and seen the Index re-rate when compared to the multiples attached to EM earnings. Such reactions are entirely consistent with impressive past performance, especially when accompanied by low interest rates that surely add to the present value of future earnings or cash flows expected. But the fact that S&P earnings have become expensive by the standards of the past and EM earnings can be acquired significantly cheaper than S&P earnings, will have attracted interest in EM compnaies, especially when the global economic and earnings prospects appear to be improving.


One sign of an improved economic state can be found in the Citibank surprise Index calculated for the 10 largest economies. As we show below in figure 6, the high frequency economic data has become much more encouraging. Expectations are being surprised on the upside. These more positive surprises are clearly helping to lift the equity markets. The economic news has been improving, surprisingly so, and global equity markets are responding accordingly. The strength in equities is well explained by economic fundamentals, especially so when the threat of higher interest rates seems so distant. 15 August 2016