The equity markets have reacted favourably to the G20 meeting over the weekend that promised a comprehensive solution to the European debt and banking crises. Stabilise the debt markets, recapitalise the banks and finally deal with Greece: these are all necessary to calm the markets and are now fully recognised in the highest European circles.
The equity markets over the past two weeks have recovered some of the ground lost in late August, so much so that (including dividend income), the S&P 500 is now about flat for the year. The emerging equity markets, including the JSE when valued in US dollars, continue to lag well behind the S&P 500.
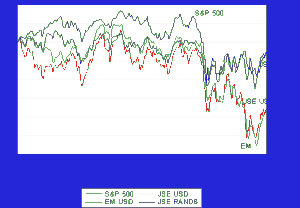
When it strikes, risk aversion appears to infect emerging markets regardless of the sources of the dangers to the global economy that emanate from the developed world. Nonetheless, if the tolerance for risk improves further, the value implicit in emerging market companies and government bonds will attract renewed attention.
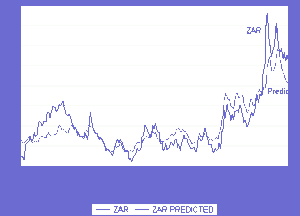
The US dollar value of the rand continued to follow the direction of the emerging market (EM) Index and the JSE (which are so closely connected). As we show below, the rand/US dollar exchange rate, while it continues to track the EM Index on a day to day basis may be regarded as somewhat undervalued relative to the EM Index. Fair value for the rand/US dollar (given the level of the EM Index on Friday 14 October) would have been close to R7.50 rather than the R7.80 at which the rand traded. Where the S&P 500 goes the EM Index, the JSE and the rand will follow if the recent past is anything of a guide to the future.
One of the features of the equity markets in recent months has been the extreme daily movements in the indices. It has been reported by the Wall Street Journal that the S&P 500 moved by more than 1% on 56 of the past 57 trading days.
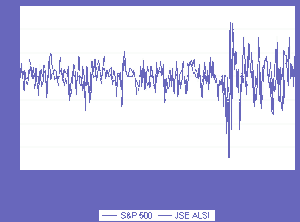
As risks rise and fall, as reflected in daily price moves and the price of options, share prices move consistently in the opposite directions. Volatility is good for the bears but not the bulls in the market: we show below the strong negative relationship between daily percentage moves in the JSE All Share Index and daily moves in the SAVI (the volatility Index priced into options on the JSE). The correlation is -0.710 for the period since 1 July.
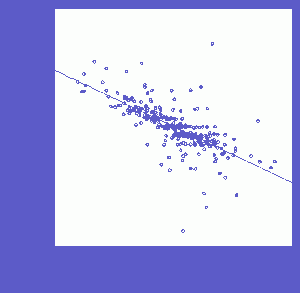
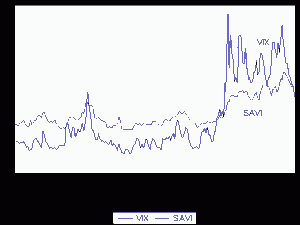
The SAVI and the VIX (the volatility Index for the S&P 500) show a similar pattern. The recent decline in the VIX and the SAVI to below 30 must be regarded as encouraging for equity investors. If this declining trend persists (consequent on any gathering belief that the Europeans will sort out their problems) the share markets will move higher. It is not risks that determine returns or returns that determine risk. It is degrees of uncertainty about the future that simultaneously drives risks and returns in the opposite direction as may be clearly seen in the markets on a daily basis.
