There were two important developments last week for the market in rand denominated fixed interest bonds. Firstly, RSA bonds are now included in the Citibank World Government Bond Index – a widely applied bench mark Index for government bonds. This would have encouraged demand for RSA bonds and the rand, even though the intention to include SA in the Index (the result of growing demands for RSA bonds) was announced well before the actual event.
Secondly, and simultaneously negative for SA long term interest rates and the rand, was the announcement by Moody’s that it was joining S&P and Fitch (the other debt rating agencies) in downgrading SA’s credit rating.
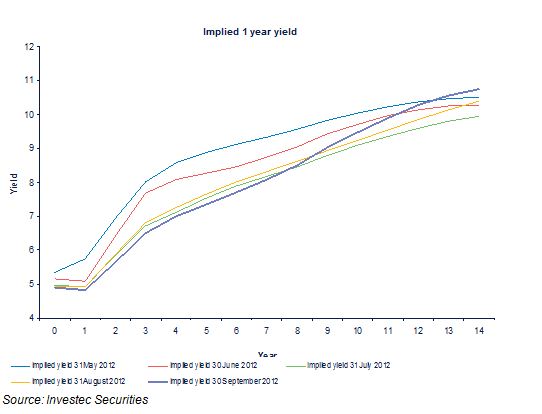
The impact of these events on the bond market was to be seen last week in a steepening of the yield curve beyond three years’ duration. The one year rate of interest expected by the market place in the future can be interpolated from the level and slope of the yield curve. As we show below, the market now expects short rates (one year yields, currently about 5% p.a.) to decline slightly over the next year and a half. They are then expected to increase to 6.5% in three and a half years and thereafter to continue to increase gradually, reaching a level of 10% in 15 years.
By South African standards this forecast or market consensus view would represent low and well behaved short term interest rates. The proactive decision by the Reserve Bank of Australia today to unexpectedly cut its key lending rate by 25bp may well encourage the SA Reserve Bank to follow its example. The market may now well price in a higher probability of an interest rate cut in SA.
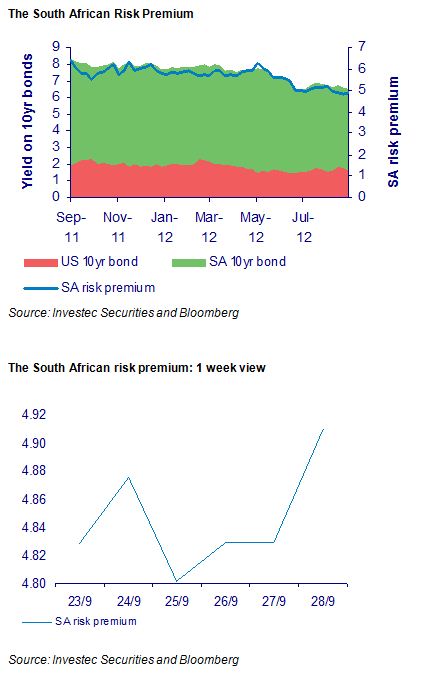
The key to interest rates over the long run will be inflation; and the key to inflation will be global inflation coupled to the performance of the rand. In this regard, the markets are registering less expected weakness in the rand over the next 10 years. The gap between 10 year US Treasury yields and RSA 10 year yields has narrowed from about 6.38% a year ago to 4.9% on Friday.
This difference in yields represents break even depreciation of the rand against the US dollar. If the rand depreciates by more than this it would pay to borrow dollars rather than rands (and vice versa if the rand depreciates by less). In other words, the cost of insuring against rand weakness over the next 10 years in the forward exchange market would approximate this difference in interest rates. This difference may also be described as the SA risk premium – nominal returns on SA securities measured in rands would be expected to exceed US dollar returns by this margin. Last week the SA risk premium widened from 4.83% at the beginning of the week to 4.9% by the weekend (see below). This difference is also described as the interest rate carry.
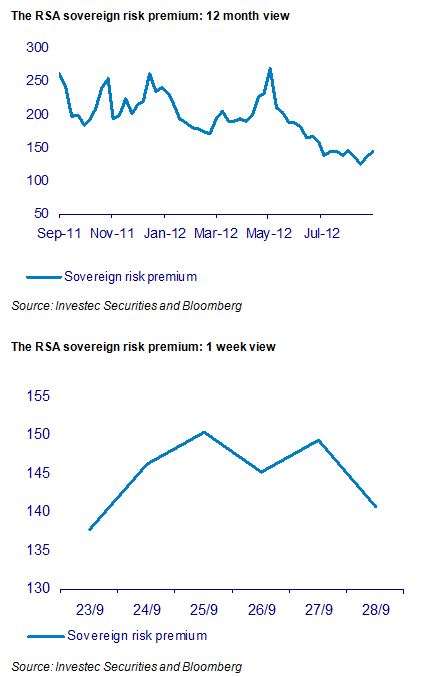
An alternative measure of SA risk is the sovereign risk premium. This is the difference between the yield on RSA US dollar denominated debt and that of US treasuries of similar duration. The reward for carrying RSA default risk has declined over the past year, very much in line with emerging market US dollar-denominated debt generally. Last week, this risk premium ended the week as it started (see below).
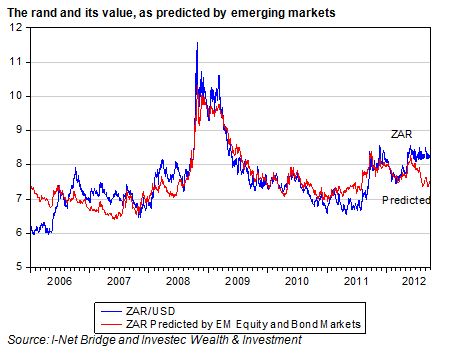
Movements in these bond market spreads on US dollar denominated emerging market debt can go a long way in explaining movements in the rand. However as we show below, the rand is currently significantly weaker than might have been predicted, given the levels of emerging market equities and bonds (about 10% weaker).
Perhaps this extra degree of rand weakness (attributable to SA specific events) is being recognised in less rand weakness going forward – as reflected in the lower interest rate carry. More rand weakness today is associated with less, rather than more, weakness expected tomorrow or next year.
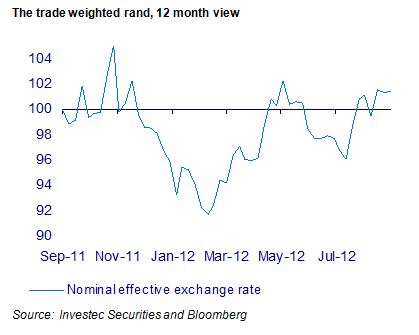
On a trade weighted basis it should be noted that the rand is little changed on a year ago and also was highly stable last week. This implies that little additional pressure on local prices is now being exerted from offshore. Brian Kantor
