It was not a good week for global equity investors with the Emerging Market Index down 2.4%, the S&P 500 down 5% and the small US cap Russell 2000 off nearly 7% by the weekend. The SA component of the MSCI EM Index fared relatively well and was 1.5% weaker in US dollars. The rand investor on the JSE suffered only marginal weakness with Industrials up 2% and Resources off a little more than 2%. The rand ended the week nearly 5% weaker vs the USD and on a trade weighted basis.
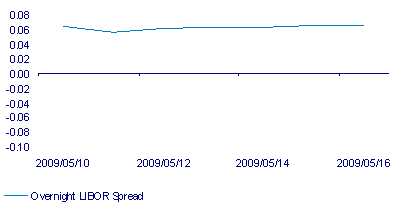
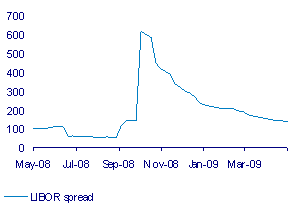
While it was a marginally down week for equities the bond and money markets demonstrated a very encouraging further decline in risk aversion. The overnight spread on interbank loans in Libor in US dollars are now below pre Lehman crisis levels and indeed have largely evaporated, indicating the regained comfort banks have in each others’ solvency. Libor rates form the basis of trillions of dollars of financial contracts worldwide and sterling three month Libor rates tell the same story of much improved risk tolerance (See below).
Libor less Fed Funds overnight
3 month Libor spread (Sterling)
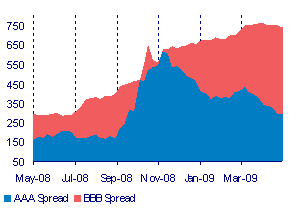
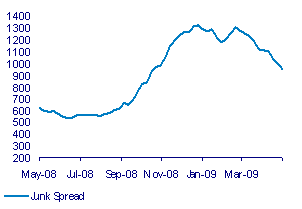
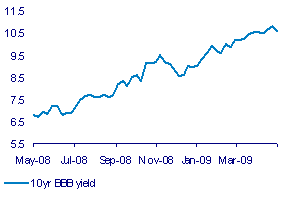
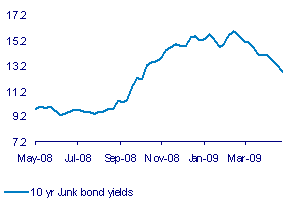
The market in US corporate bonds has also revealed growing risk tolerance, or in other words less fear of default, accompanying very significant increases in issuance. Risk spreads on the high yield bonds have come in even further than on most investment grade bonds as we show below.
US corporate bond spreads
High yield US bond spreads
US Investment Grade Bond Yields
Junk Bond Yields
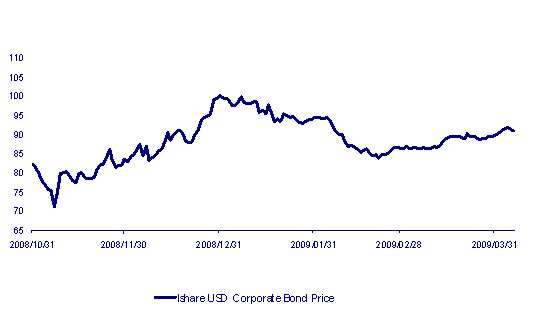
The Barclays corporate bond ETF tells a similar tale as we show below. In early January 2008 it traded at a value of 102. This had fallen to 71 by 10 October 2008 when the credit crisis was at its most severe and is now trading at 91 (See below).
Ishares; US Corporate Bond Exchange Traded Fund
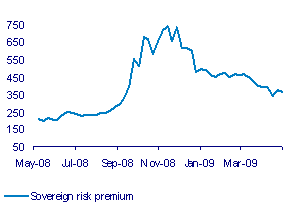
The default risk implicit in the spreads on sovereign debt issued by emerging market borrowers have also come in sharply and especially so in recent weeks in company with other emerging market debt. SA government Yankee bonds were offering a spread of almost 750bps at the height of the crisis. This spread was 364bps on Friday 16 May, a significant improvement. Yet these spreads are still well above pre-crisis levels. Two years ago when the glut of global capital was at its most pressing on yields the spread was less than 100bps. There is presumably still much scope for further reductions in sovereign yield spreads providing global economic conditions actually improve.
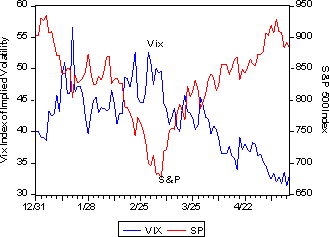
The risks implicit in equity markets have also receded as equity markets have recovered from the extreme weakness of early March 2009. These risks are revealed by the extent of daily price movements and by the risks priced into options on the markets. The almost perfect correlation between daily moves in the Vix Index, the Chicago Board of Exchange’s traded Index of implied volatility in options on the S&P 500, and daily moves in the S&P Index itself has been sustained in recent weeks – with volatility of daily share price movements receding and share values improving.
The Vix and the S&P 500: 1 January to 15 May
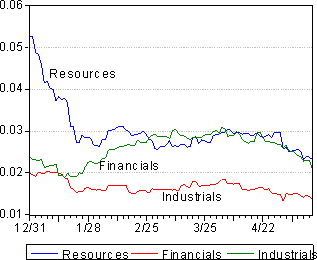
On the JSE the volatility of the market and its key sectors, Resources, Financials and Industrials have all receded helpfully. We measure volatility explicitly as the moving 30 day average of daily percentage price moves. It is notable that the volatility of financial shares listed on the JSE has come in markedly from highly elevated levels. Yet the risks in Financial shares, while much lower still, rival that of Resources, which have also declined. Resources are usually significantly more volatile than Financials.
The volatility of the JSE (30 day moving average of the SD of daily price moves 2009)
These improvements in credit and banking market conditions as well as in equity markets not only reveal expectations of improved economic conditions but will also help bring such improvement about. The interventions in these markets made by governments do seem to have worked.