US earnings: The benefits of going global

A Wall Street Journal Report today by Kate Linebaugh and James Hagerty, Business Abroad Drives U.S. Profits, points to way foreign operations of leading US corporations have contributed to the very satisfactory second quarter earnings season now well under way in New York. One third through the earnings reporting season for the S&P 500 companies, earnings are the highest they have been in four years.

These S&P 500 earnings per share may well exceed $100 for the 2011 calendar year. The drivers for this earnings growth however, as the report points out, is not the struggling US economy, but the off shore operations of these companies.

About three quarters of the companies that have reported so far have done better than analysts expected. As the WSJ report states, “…Many of them – ranging from manufacturers Honeywell International Inc. and Caterpillar Inc. to drug maker Abbott Laboratories – raised their earnings forecasts for later in the year.

The report refers to the bellwether industrial giant GE that reported a 21% increase in earnings to $3.8bn for the second quarter. Yet US revenues in GE’s core industrial businesses shrank about 3.4% while international industrial revenue soared 23% to $13.4bn, accounting for about 59% of the company’s total industrial revenue. This translates into growth in capital expenditure and employment offshore rather than on US shores making the US economic recovery less likely to benefit from the financial strength of US corporations, many of whom have a strong global footprint.

We have been firmly of the view that the most compelling way to gain exposure to the global economy is via the companies listed on the S&P 500. The valuations of these companies appeared very undemanding of earnings growth, trading as they do well below their average price to trailing earnings multiples (which averaged as much as 21 times between 1980 and 2011). The current trailing S&P 500 earnings per share, calculated before higher second quarter earnings have been reported, is US$81.31. This puts the S&P on a trailing 16.5x earnings and a prospective forward PE of under 14 times earnings to be reported in the first quarter of 2012.

This advice has proven apposite as we show below. Since 1 January 2011, the S&P 500 has gained almost 7% (to 23 July) while the MSCI EM is flat and the JSE in US dollars is 2.5% weaker than on 1 January 2011.

However as we also show, S&P earnings year to date have significantly outpaced the share market index, adding to the case for investing in the S&P 500. We remain firmly of the view that the S&P 500 is still very undemanding of future earnings growth and even less demanding than it was. And the unsatisfactory state of the US economy can be expected to continue to keep down interest rates in the US (and so the competition for equities from fixed interest income)

To view the graphs and tables referred to in the article, see Daily Ideas in the Daily View
: Daily View 25 July

Employment: The annual strike (that is the loss of jobs) season is well under way

The annual strike season is well under way. The usual well above inflation increases are being demanded accompanied by the usual marches, highly rhythmical toi-toing and some violent intimidation of workers, less inclined to put their jobs at risk. And after losses of production and presumably also of wages, management and unions settle on still significant increases above recent inflation rates.

The season might well be called the season of further loss of permanent jobs in the formal sector of the economy. Wages and benefits improve for those who keep their jobs, while management are strongly encouraged to proceed with operating strategies that rely less and less on unskilled labour and more on capital equipment employed.

The outcomes are plain to see in the ever widening gap between output growth and formal employment growth. This has become ever more conspicuous after 1995, due to more onerous regulation of the SA labour market (for management).

The labour saving logic practised by management is sensible enough – including their willingness to concede well above inflation increases. The logic driving union action is less obvious to those outside the ranks of union leaders and presumably their generally supportive rank and file who seem to appreciate a good fight with their bosses. One might be inclined to think, given the long established employment trends, that the leaders would rather wish to encourage employment (perhaps of their sons and daughters) and so union membership and the dues they collect with less militancy and less aggressive demands for more. Clearly there is something else at work that makes union militancy, rather than co-operation, the action that keeps the union leadership in their jobs. And so the history repeats itself: higher real employment benefits, fewer formal sector jobs and productivity gains to compensate for more expensive labour.

Shareholders by contrast have no reason to be immediately concerned about these trends, unless they fear, as they may well, the instability threatened by the growing divide between those in good jobs and those increasingly excluded from gaining access to them. But this is an issue that the management of any one firm cannot address. The reality is that management teams have adopted labour saving or especially unskilled labour saving policies that have proved to be consistently profitable and can be expected to continue to be profitable.

Over recent years the share of operating surpluses in the gross value added by the SA corporate sector has if anything tended to rise while that of employees (including managers) in the form of wages in cash and kind has tended to fall. In other words operating profits have been improving despite higher wages for those who hold on to their jobs.

The share of the operating surplus in the value added by non-financial corporations in SA and their gross cash savings is shown below. As may be seen it is a much improved picture, especially in the form of cash flow generated by these firms that has no doubt added to balance sheet strength and added value for shareholders.

The issue confronting the firms, the unions and SA generally, is how these cash flows and profits should best be employed – in reducing debt, paying dividends, making acquisitions or (much more helpfully) for economic growth adding to capital equipment or workers employed.

The answer for SA is obvious enough to all – more jobs. The uncomfortable truth is that management has no good reason to alter its ways. They are reacting to the fact of economic life in SA that the real cost of capital, in the form of a lower risk premium paid by SA firms, has come down materially, given a most helpful political transformation. Over the same period their real cost of hiring labour has increased materially.

It would seem obvious to all but those who find it convenient to deny the relationship between employment levels and employment benefits. That is to say. in the interest of more formal jobs, it is the unions that need to become less militant and more co-operative with management. The unions need to promote employment by encouraging the adoption of policies that would make for a more flexible labour market and a much more mobile labour force that could adapt appropriately to the state of the economy. Maybe only an economic policy Codesa will lead to this.


To view the graphs and tables referred to in the article, see Daily Ideas in the Daily View:

Daily View 21 July

Gold is for the risk averse, gold shares for the risk loving

The gold price in US dollars and in rands has moved ever higher while JSE listed gold shares have moved mostly sideways over recent years. The explanation seems obvious enough. The cost of mining gold in SA has risen every bit as rapidly as the price of gold while the volume of gold mined in SA has declined consistently with these higher costs and the lower grade of ore being crushed. In 1970, before the price of gold escaped the constraints of the gold standard that set the price at $35 or approximately R27 per troy ounce, SA mines produced over 600 metric tonnes of gold a year.

SA gold mines now produce fewer than 200 tonnes of gold a year and this output is falling. The only consolation in this sad tale of events is that presumably the US dollar and rand price of gold would be a lot lower had SA continued to produce as much as it did before.

But the hope that the gold mines will be able to take advantage of the higher gold price in the form of profits and dividends seems to rest eternal. Investors have consistently paid up more for the dividends actually paid by the gold mines. Currently the mines are selling at 122 times their trailing dividends or at a dividend yield of less than a third of one per cent. Gold mining accounting earnings follow no consistent pattern and have often been negative in recent years. For the record , the JSE Gold index reported earnings per share have been positive over the past 12 months and the share prices are on average 315 times their trailing earnings.

The hope clearly implicit in these extraordinary market ratings is that gold mining companies will some day, maybe soon, be able to get more valuable gold out of the ground at greatly improved margins. This makes gold shares the ones with the longest odds in the equity markets. This taste for risk may well continue to provide support for gold shares for some time to come. Presumably the risk lovers assign only a small proportion of their portfolios to this gamble.

Accordingly the relationship between the gold price (much higher) and gold shares (sideways) is therefore a very weak one and may remain so until the mines actually deliver much improved dividends. Since January 2008, for every one per cent daily move in the rand gold price, the JSE Gold Mining Index has moved on average by only 0.42% (the so called gold price beta). However the gold price explains only about 7% of the daily move in gold shares over this period. There is clearly much more than the influence of the gold price at work on gold shares. The gold price expressed in US dollars does only a marginally better job explaining the JSE Gold index (in rands) with a beta close to 0.75 but still with very low R squared or explanatory power of 0.16%.

Gold shares are clearly only for the risk lovers. Gold itself however would have served the risk averse very well over this period. This is because, on average, when the market was down the gold price was up and vice versa. The correlation between daily moves in the JSE All share and the rand gold price was a negative (-0.16). Negative correlations of this order of magnitude provide outstandingly good risk reducing diversification benefits for portfolio managers. The correlation between daily changes in the rand gold price and the S&P 500 in US dollars has been even more negative (-0.44). Thus for South Africans with exposure to developed equity markets, gold would have provided especially good insurance. For the offshore investor the correlation of daily changes in the dollar price of gold and the S&P 500 was close to zero (0.04) over the period indicating that gold would also have provided very good insurance for the US dollar investor.

Past performance may not be a guide to future performance. But if the past is anything to go by the case for investing in gold, especially for South Africans, has been greatly strengthened while the case for investing in gold shares remains at best unproven.

To view the graphs and tables referred to in the article, see Daily Ideas in the Daily View:

Daily View 20 July

The Hard Number Index: Satisfactory but not improving

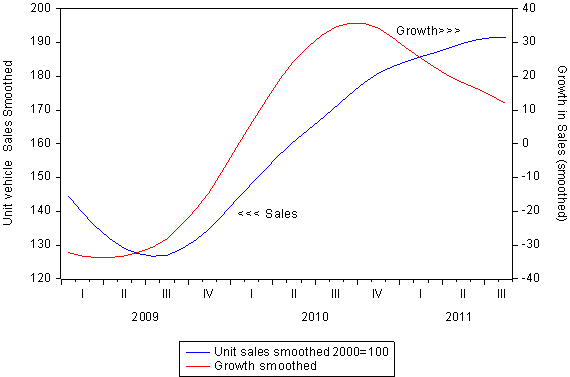
Economic activity in SA expanded in June, but according to our Hard Number Index of Economic Activity (HNI) the pace of growth may well have slowed marginally rather than picked up momentum.

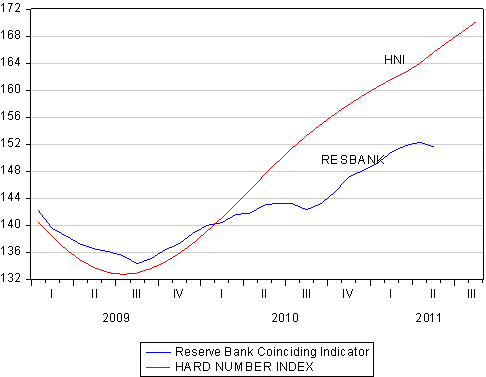
Our HNI attaches equal weights to two very up to date hard numbers, namely new vehicle sales for June, as released by NAAMSA, and the size of the note issue as at the end of June. The HNI may be compared to the Coinciding Indicator of the SA Business Cycle calculated by the SA Reserve Bank. This indicator, with a very similar lower turning point for the current cycle, is however only updated to March 2011, leaving it well behind current economic events.

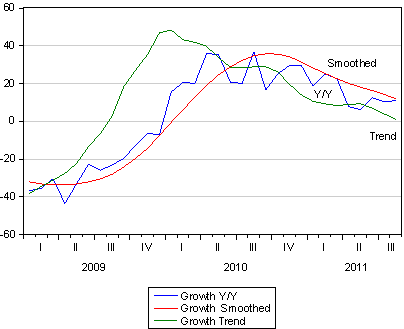
Vehicle sales began a very strong recovery in late 2009. Sales of all new vehicles were particularly strong in March 2011. Actual sales that month were 53 478 units, which, since March is usually a very good month for vehicle sales, translated into a seasonally adjusted 50 101 units. Since March 2011 vehicle sales have fallen back significantly from these levels, though sales in June were modestly up on those of May. On a seasonally adjusted basis sales had fallen from the over 50 000 units sold in March to 43 108 units sold in May and recovered to 44 359 units sold in June 2011. The vehicle sales growth cycle appears to have declined significantly with the current annual growth trend around the 10% annual rate, perhaps to recede further.

We have mentioned before that the Combined Motor Holdings (CMH) share price has consistently provided a very good, even leading, indicator of the state of the new vehicle market. This relationship appears to be holding up with the CMH share price having peaked late last year, consistent with the peak in the new vehicle cycle.

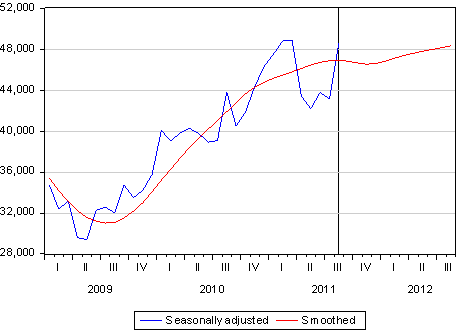
While the news about vehicle sales may be regarded as somewhat less encouraging about the current state of the SA economy, the demand for and supply of notes in June is somewhat more encouraging. The Reserve Bank, when it issues notes, satisfies the extra demands of the public for notes, presumably to spend, and from the banks for cash reserves, presumably so that they are able to lend more. Banks in SA do not hold excess cash reserves of any magnitude and so the supply of notes, adjusted for cash reserve requirements, is equivalent to the money base of the system, adjusted for cash reserve requirements, or what is also described as high powered money. This makes the note issue a reliable coinciding indicator of economic activity, with the great advantage of being a highly up to date indicator.

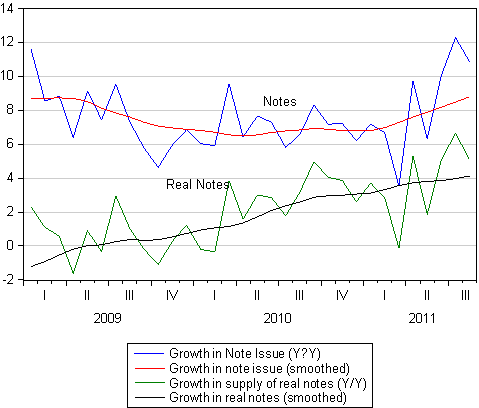
The growth in supply of notes to the economy slowed down consistently between early 2009 and early 2011. This growth cycle appears to have picked up momentum recently. The slower growth in the supply of notes, until recently, was however offset by lower inflation, providing scope for acceleration in the growth in the real supply of notes. This growth was necessary to sustain the economic recovery under way. Now a mixture of slightly higher inflation and slightly faster growth in the note issue has helped stabilise the real money base cycle at about a four per cent rate.

If the economy is to sustain a growth rate that is still below its potential or sustainable rate, a further increase in the rate of growth in the demands for cash, well ahead of inflation is called for. No help in this regard can be expected from lower interest rates. SA does not (alas) engage in money supply targeting or quantitative easing. However it may be hoped that any increase in short term interest rates will be postponed until the demands for and supply of bank credit and the demands for the banks and the public for more cash indicate a clear case for tightening. The case for tightening based on the most recent money supply and credit numbers remains, a very week one. Faster growth in the supply of narrow money, broad money and bank credit deserves encouragement.


To view the graphs and tables referred to in the article, see Daily Ideas in the Daily View:
Daily View 13 July

The economy: Steady as it goes

The Reserve Bank Quarterly Bulletin published yesterday has provided further detail on the highly satisfactory performance of the SA economy in the first quarter. Household spending growth has led the economic recovery and was sustained in the quarter at an above 5% rate. Government consumption spending also grew strongly.

The weakest spot in the economy remained the reluctance of the private sector to add to its plant and equipment. However the consistent run down in inventories had come to a natural end in the fourth quarter of 2010 and a sharp buildup in inventories, from highly depressed levels relative to output saw Gross Domestic Expenditure (GDE) rise by over 8% at an annual rate, much faster than Gross Domestic Output (GDP) that as was previously announced grew by 4.8% in the quarter.

If one is to draw a bottom line on the update provided by the Reserve Bank, it is that the economy is growing satisfactorily enough led by household and government spending. However if these growth rates are to be sustained and improved, as must be the objective of policy, the economy needs a stronger commitment by business to additional capital expenditure and to the provision of more employment. More formal employment would help the housing market and highly depressed construction of housing activity that is labour intensive. A business friendly approach by government and its agencies seems to be an essential and urgent requirement for economic and employment growth.

The almost stagnant money and credit numbers indicate very clearly the lack of demand for plant and equipment and for new homes. They also confirm that the economy is not yet operating at what might be regarded as its growth potential. The balance of trade, including the weakness in demand for imports, also confirms that the economy could be growing faster (given easy access to foreign capital on favourable terms). There is moreover little indication that the economy is picking up momentum.

The concern rather, given recent trends, must be that the economy could easily lose momentum (depending in part on the uncertain state of the global economy and demands for exports). The fragility of business confidence could be another negative influence. The best monetary policy could do in the circumstances, would be leave interest rates well alone and unchanged.

To view the graphs and tables referred to in the article, see Daily Ideas in the Daily View:Daily View: The economy: Steady as it goes

Industrial and employment policy: A new dawn or a false dawn?

The long awaited subsidy for Job Creation has become a reality. The Jobs Fund will make available R9bn over the next three
years as a subsidy for jobs to be created and encouraged with R2bn available this financial year. The fund will be administered by
the Development Bank (DBSA). It will be “…targeted at established companies with a good track record and plans to expand
existing programmes or pilot innovative approaches to employment creation, with a special focus on opportunities for young
people..” (Q&A, Media Briefing, Houses of Parliament, 7 June 2011).

The four areas of focus are Enterprise Development, Infrastructure Investment, Support for Work Seekers and Institutional
Capacity Building, including internship and mentorship programmes. The focus seems broad enough to cover almost any aspect
of business activity.

The approved programmes will be “..cost and risk shared by participants..to ensure real ownership..” In other words, private sector
participants will have to provide matching funds on a 1 to 1 ratio. A reduced own contribution is intended for “non-private sector
applicants” These would include municipalities and public enterprises. It may presumably include NGOs and their like. Applications
must be made by 31 July for funding this year.

The scheme will clearly be employment creating among the ranks of the consultants. It should prove particularly welcome to firms
with well established training programmes. “Support for Work Seekers; assistance with job search, mobilisation and enhancement
of training activities, support for career guidance and placement services” (Media briefing) will surely prove a boon to the well
established and much maligned labour brokers. The statement above reads like an accurate description of their business model.
The SA government is trading off a significant proportion of its corporate tax base for new industrial projects and subsidies for
employment. In addition to the R9bn Jobs Fund the newly defined s12i Tax incentives are backed by a 2011-12 Budget allocation
of R20bn. These are by no means trivial amounts in absolute terms, or relative to all the tax collected from SA companies. It would
be of interest to know the proportion of company taxes paid by manufacturers. Would it be as much as R20bn allocated in the
2011-2012 Budget?

In the 2010-11 Budget estimated revenue from companies was R150bn or 24% of all estimated tax revenues of R643bn. The SA
government’s dependence on income from companies is unusually large. In many other tax regimes the corporate tax rate may be
comparable to the rates levied on company profits in South Africa. But when taxes actually paid are reduced by investment and
many other allowances provided by government to stimulate investment and job creation, the effective (economic) tax rate
becomes much lower than the nominal company tax rate.

SA is following this route. More subsidy and allowances provided for companies, in one way and another, tax concessions and job
subsidies included, that lead to less tax paid and a lower effective tax on business profits. No doubt these lower taxes paid will be
very welcome to businesses that are able to engage skilfully with the system.

If however the path of government spending is to remain unaffected, as would appear likely, the taxes saved or the subsidies
provided to the companies that benefit, would have to be made up by taxes collected from other taxpayers. This must mean
increased taxes on consumption expenditure or on individual incomes; or companies outside the sectors favoured by industrial
policy will be forced to pay up for the benefits provided to industry.

The SA government clearly thinks, as do governments almost everywhere, that it can do better than simply providing an
encouraging tax and regulation environment for business in general. It clearly believes it can pick the winners in the industrial
space rather than leaving the investment and employment decisions to participants in the market place on a field levelled by
equally generous tax treatment, irrespective of the designated activity and location in which it takes place.

It would promote economic growth in SA if more generous investment or depreciation allowances were offered to business in
general rather than those judged particularly worthy by the bureaucrats involved. This would encourage companies to save and
invest more of their after tax earnings or cash flow. Investment allowances reduce the taxable income of companies, leading to
less tax paid and more cash retained and invested. This would lead in turn to more output and employment. But this is an
argument for lower business taxes in general rather than for particular benefits or subsidies.

One has to question the ability of the government through the Department of Trade and Industry (DTI) or any other of its agencies,
the Development Bank or the IDC, to pick the winners, without fear or favour, among the many proposals that are bound to be
made to it. As indicated there will be a great deal of taxpayer’s money at stake.

The government has proved itself much more capable of raising tax revenues than spending them effectively. The subsidies or tax
concessions will surely add to industrial output and employment. But we will never know how much better the economy might have
done and the employment created had much less discretion been exercised over tax concessions or subsidies. As the saying goes if you want more of something subsidise it, if you want less tax it. SA is doing both – extracting more tax from some
employers, employees and consumers, while subsidising other businesses and their employment decisions more generously.

The government through the DTI (and organs like the competition authorities) seems to show a marked and regrettable lack of
respect for the creative powers of private businesses. The simple recipe for economic growth is one that relies on businesses
directed by their owners and senior managers, to pursue their self interest, constrained essentially by the competition provided by
other businesses for their customers, workers and providers of capital. Economic history has surely proved that the recipe works.
But governing best by governing least does not serve the interest of ambitious policy makers. There is a constant flow of new
regulations and intrusions that SA business has to manage which adds to their costs and reduces their competitiveness with
imported goods. There moreover appears no popular ground swell of support for activist economic policies. The impetus seems to
come directly from officials and their consultants.

The poor protest about the lack of delivery of basic services by government not about the lack of delivery of basic goods and
services by businesses. SA Business, unlike the SA government, delivers very effectively. It would deliver more jobs if the labour
market were less heavily regulated to encourage them to do so.

Industrial policy and the Job Fund have become an expensive and counterproductive alternative to sensible, employment growth
encouraging, de-regulation of the labour market. The intervention by the competition authorities in the employment and
procurement decisions to be made by Massmart and Wal-Mart provide an obvious case in point and a further example of
government officials thinking they know better how business should be run in the interest of more employment. The goods and
services market has been made less competitive to make up for the lack of competition in the labour market. The employment
problem is one of the government’s own making, acting as it has done to entrench the rights of established workers, at the
expense of potential entrants to the ranks of the formally employed.

The government and its officials will no doubt point to the jobs gained through subsidy and perhaps also compulsion to employ
more labour demanded of the government departments themselves and publicly owned enterprises. The jobs lost because of
higher taxes and job destroying regulation will be much less obvious and ignored to the great disadvantage of the poor in SA who
need jobs – not handouts to lift them out of poverty.

The solution to the failures of the SA economy, or rather its formal businesses to provide jobs would seem obvious to all but those
with an interest in the status quo – the trade unions and the officials who write and implement interventions in the labour and other
markets of the economy. This is to rely less on government and its regulatory, taxing and subsidy powers and more on private
business to deliver more of the essential goods and services demanded in a modern economy.

To view the graphs and tables referred to in the article, see Daily Ideas in the Daily View: Daily View 8 June: Industrial and employment policy: A new dawn or a false dawn?
Global markets and the rand: Not all bad news

The flow of disappointing US economic data continued with the Payroll report of Friday that reported a gain of 54 000 in May, well below the monthly average gain in 2011 of 182 000, and an increase in the unemployment rate from 9% to 9.1%. The unemployment rate was not all bad news as, according to the US Survey of households, an extra 272 000 workers joined the labour force only partly offset by a 105 000 increase in household employment.

More people entered the labour force, presumably because they thought they could realistically find work, but not all did so. Hourly earnings in the US are rising very slowly, by 0.1% in April and 0.3% in May. With little growth in wages, any perceived inflationary threat from the labour market has dissipated, providing further reason for postponing higher interest rates and hence the weaker US dollar.

Not all the recent news about the US economy was bad, The ISM non-manufacturing index that covers 90% of the US economy rose from 52.8 to 54.6, marginally ahead of consensus. Numbers above 50 indicate growth. More encouraging was that the employment component of this Index rose from 51.9 to 54, consistent with payroll growth of 175 000, and faster than that indicated by the official payroll report.

The weaker numbers and their implications for low interest rates for longer weakened the dollar and strengthened the euro and emerging market currencies, including the rand. This made the week a better one for US dollar investors on the JSE and emerging markets generally than it was for investors in the S&P 500, that after an extended period of outperformance lost ground to emerging markets last week.

The rand during the week had turned out to be a particularly strong emerging market currency. The rand made gains not only against the US dollar, the euro and the Aussie dollar but also gained about 3% against our basket of other emerging market currencies.

It would appear that the rand had gained from the approval of the Competition Tribunal of the Wal-Mart / Massmart deal after having weakened relative to the Aussie dollar and other emerging markets in the weeks leading up to the decision. SA specific risks, that is policies more or less friendly to foreign investment, would appear to have a modest influence on the exchange value of the rand in recent weeks. The more important influence on the rand will remain those emanating from global markets in the form of commodity prices and flows into emerging market bonds and equities.

The news from the commodity markets was not unsatisfactory as prices held up, helped by the weaker US dollar. The oil price in US dollars was largely unchanged.

The stronger rand and the more uncertain outlook for the US and global economy weakens further the case for higher interest rates in SA. This has been partly recognised in the bond market with a downward shift of the term structure of interest rates. The probability of an increase in the repo rate this year receded the week before last but remained largely unaffected by the news last week.

The US equity markets are undemandingly valued relative to earnings and interest rates and have become less so this past week. The weaker data disturbs the outlook for future earnings as the performance of the S&P 500 this past week made perfectly clear. The key to the outlook for the US economy and the equity markets will be the willingness of US business to put their strong balance sheets to work hiring workers and buying equipment.

The confidence of US business would be greatly assisted by the belief that Washington will deal effectively with the US Budget and US government debt. Any sense that China is loosening rather than tightening its monetary stance will be very helpful too.

To view the graphs and tables referred to in the article, see Daily Ideas in the Daily View: Daily View – June 6: Global markets and the rand: Not all bad news

Vehicle sales: Not much vroom

Naamsa released its new units sold statistics for May 2011 yesterday. The numbers are not encouraging. April 2011 was a poor month for sales, especially when compared to sales in March 2011, and the fall off in monthly sales, when seasonally adjusted, continued in May as we show below.

The sales quarter to quarter and seasonally adjusted have fallen sharply from a very strong March 2011 as we also show. The growth in sales is now barely positive, compared to a year ago, which is a long time in the motor dealing business, and in fact negative on a three month moving quarterly basis as may also be seen.

Making the seasonal adjustment for two months with an unusual number of public holidays, including the Easter holidays that fell in April, has no doubt complicated the analysis of the underlying cyclical trend. Holidays are good for shopping malls but not vehicle show rooms. Also adding complexity are disruptions in the supply chains that start North of Tokyo. Is it a relative lack of demand or an inability to supply that is holding back sales? The Naamsa explanation quoted below appears to attach some (though not major) importance to negative supply side forces.

“..During May, 2011 – constraints on the availability of components from Japan impacted on the production of certain product lines in South Africa and, together with shortages of various models sourced from Japan, this would have contributed to the slow down in the rate of growth in the new car and light commercial vehicle sales cycle for the month. These factors would also have contributed to lower aggregate industry exports. It was anticipated that the supply position would normalize over the medium term..”

Our own interpretation is that the peak of the vehicle cycle has been reached and the growth trend is now a significantly lower one. The market for new vehicles seems to be stabilising at a monthly pace of approximately 47 000 new units sold, well below the heady pace of 60 000 units sold at the peak of the previous motor vehicle cycle of early 2007. That is to say, year on year growth in December 2011 on December 2010 will be about 5%.

The current and projected level of vehicle sales help confirm our impression of an SA economy that is growing satisfactorily, but that the growth is not accelerating. There would appear to be no danger of excess demand materialising any time soon.

The economy, on the basis of these May vehicle sales and the April credit, money supply and house price data, appears to be taking longer to reach its growth potential than previously thought. Moreover the risks have increased recently that the global economy will not support export volumes and prices strongly enough to help take up the slack in domestic demand over potential supply. The danger of a global slowdown has risen in response to signs of slowing rather than accelerating growth in the US. The case for higher interest rates in SA, in the light of domestic vehicle sales and exports of vehicles, has weakened further.

To view the graphs and tables referred to in the article, see Daily Ideas in todays Daily View: Daily View 3 June: Vehicle sales: Not much vroom

Natural gas: Economic development vs the status quo

More than a year ago we indicated the potential of natural gas extracted from shale rock and that the SA Karoo basin covered in shale rock might contain a great deal of this new source of energy. In a report in the Calgary Herald, of 18 April, Peter Terzakian referred to a very recent assessment of shale gas potential in 48 basins in 32 countries released by the US Energy Information Agency.

To quote the Calgary Herald: “ The numbers are staggering: over a six-fold increase in the 1,001 trillion cubic feet (Tcf) of natural gas that was previously known to be “proven” reserves. According to the EIA report, over 6,600 Tcf of shale gas resources are estimated to be technically recoverable”. As the Calgary Herald explains “……..To put this in perspective, 1,000 Tcf of natural gas contains the equivalent energy to 166 billion barrels of oil – a staggering amount considering that the discovery of 10 billion barrels of conventional oil these days is a rare occurrence….”

We might add by way of comparison that the annual global consumption of oil is of the order of 87m barrels per day of which SA consumes about approximately 555 000 barrels per day.

The Calgary Herald produced a table of the largest 15 such shale gas reserves to point to the vast recoverable resource in China. But as may be seen below the estimate of the technically recoverable resource in South Africa at 500 TCF (none yet proven) is no small potatoes either- it is the fifth largest such resource and equivalent to 83billion barrels.

Were this potential output of natural gas, estimated as recoverable by the US EIA, to be captured from the Karoo shale it would be very large potatoes indeed. It would be the equivalent to about 400 years of SA consumption of oil at current rates: 365*550 00 = 202.575m per annum; (83000mb/202.575mbpa) = 402 years

These numbers derived from estimates that are as objective and scientific as any should help concentrate minds at the SA Department of Mineral Resources that has placed a freeze on rights to explore for natural gas in SA until it has formulated a policy. The benefits of discoveries of natural gas in SA of anything like this order of magnitude would very obviously be transformational for the SA economy. It would offer the prospect of much faster growth in national output and in incomes, including the incomes to be received by the SA government and of the poor to whom it may be hoped a good portion of the extra income would be distributed.

There might well be damage to the environment to be traded off for these great potential benefits. Such tradeoffs can presumably be calculated and compensation offered if necessary to those negatively affected. There is too much at stake for any other approach to be adopted.

How much actual damage to be caused will continue to be disputed. However what should be borne in mind is that the damage to the environment caused by extracting other sources of energy in SA especially open cast or even deep level coal mining, would need to be brought into the calculation. Or in other words, less damage to the Waterberg traded off for damage to the Karoo

In many countries the prospects of shale gas have been greeted like the proverbial manna from heaven. Technically recoverable gas is being converted into proven reserves and actual output at a rapid rate. The economics of shale gas are rapidly transforming the energy equation in the US. But in SA the green movement seemed to have sounded an alarm that has deafened any account of the potential benefits. That the Karoo farmers have (recently) been denied any direct benefits from the gas under their land has no doubt added to the cacophony of protest.

Shell Oil, which appears to be well ahead in the race for Karoo gas, has argued (Business Report May 3 2011 p 17) to the contrary, that the process of extracting gas from shale “can be done without significant environmental damage”. That Shell has an interest in such arguments does not make the argument invalid. Furthermore the actual experience of damage to the environment in shale basins where gas is already being extracted in significant volumes will provide very important evidence.

The negative external effects of extraction or of any minerals in the ground do not remove the necessity to actually calculate the relevant tradeoffs as best as science will allow. Without such calculations and tradeoffs, economic development itself becomes much more difficult to realise. This is a fact of economic life well enough known to the greens who have no taste for the rising incomes and especially the rising consumption power of the masses.

Such an environmental assessment would then enable full compensation to be actually paid out to those damaged directly. The great potential extra income to be generated from natural gas potentially available deep under the Karoo shale rock is very likely to greatly exceed the damage caused to neighbours. If this is not the case then the project should not be allowed to go ahead.

The Department of Mineral Resources should however be well aware when establishing its policy that not only will natural gas discoveries on this potential scale be transformational for the SA economy, it will prove even more transforming of the energy sector of the economy. The Department should know that transformation of this order of magnitude will naturally not only be resisted by those directly in the path of discovery. Resistance would also come from those who think they may lose the race for supremacy for natural gas from SA sources because they have been slow out the blocks. The national interest in economic growth will count for little when opposed by vested interests.

To view the graphs and tables referred to in the article, see Daily Ideas in todays Daily View: Natural gas: Economic development vs the status quo

Good news about home loans and employment

In a previous note on the state of the SA economy we pointed to the weakness in bank lending and the slowing growth in the money supply, particularly in the supply of Reserve Bank cash to the banks and the public. This indicated to us that while the SA business cycle was firmly in an upswing phase, the pace of recovery was not accelerating.

We showed that the housing market leads the credit market – higher house prices both encourage home owners to spend and borrow more and encourage entrants to the housing market. Higher house prices also mean larger mortgage bonds issued by the banks.

We suggested that what was needed to add momentum to the housing and credit markets market was growth in employment. Get a good job and the credit to buy a house and a car will likely follow.

In this regard the news from both the job and home loan markets in March, released this week by the leading employment agency Adcorp and the bond originator Ooba, was very encouraging. Ooba reported via I-Net Bridge that the number of bond applications in March had reached a three year high, that the average number of bond application in March was the highest level recorded since May 2008 and 36% higher than the average monthly application intake recorded in 2010. Not only applications but approved home loans were also strongly up and represented the highest value of approved home loans since October 2008. Yet these much improved volumes of potential bond business were still only 36% of the application volumes recorded at the peak of the market in May 2007.

Adcorp monitors the labour market very comprehensively and reported in its March Employment Report that in February employment in the formal sector was up 7.3% on a year before while informal employment grew by 2.0% “, the first time since January 2006 that the formal sector drew workers out of informal employment..” Its Index of Employment, having moved sideways, is now pointing higher.

The business of Adcorp is to find jobs for workers, something it has proved very successful at but whose success has inspired a Cosatu led thrust to close its business down.

The news from the labour and housing market must be regarded as encouraging, but not yet encouraging enough to lead the Reserve Bank to become less cautious about the state of the economy. As the IMF suggested, and as we have done, any early move to higher interest rates would be highly premature. Hopefully also the SA government will leave what is working well in the labour market (the demand for and supply of temporary employment) well alone.

To view the graphs and tables referred to in the article, see Daily Ideas in todays Daily View: Daily View 13 April: Good news about home loans and employment

The state of the SA economy: Moving forward but not picking up speed

We have updated our Hard Number Index (HNI) of the state of the SA economy to March 2011. The HNI combines two very up-to-date hard numbers, unit vehicle sales and the note issue of the Reserve Bank adjusted for Consumer Prices to form a business cycle indicator.

The HNI continued to move higher in March, though the speed at which the economy is moving forward (the rate of change of the HNI itself) has probably stabilised and may well slow down. We also compare the HNI with the Co-Inciding Business Cycle Indicator of the Reserve Bank that is only updated to January 2011. The turning points of the two Indexes are well aligned making the HNI a good and up to date leading indicator of the current state of the economy.

Read the rest of the story in Daily Ideas in today’s Daily View: The state of the SA economy: Moving forward but not picking up speed

Vehicle sales: Shifting into overdrive

March 2011 turned out to be another strong month for new vehicle sales both domestically and for exports. Sales in SA rose to 53 478 units while exports were a record 29 254. On a seasonally adjusted basis, domestic sales kept up with sales in February 2011 and the industry remains on track to sustain sales of new vehicles at a monthly rate of around 50 000. Seasonal adjustments are always complicated by Easter holiday influences in March and April and so a still clearer picture will have to wait until April sales volumes are released.

To view the graphs and tables referred to in the article, see Daily Ideas in todays Daily View: Daily View 5 April: Vehicle sales: Shifting into overdrive

The underlying growth in new vehicle sales appears to have reached something of a peak at about the 23% year on year rate of growth. Growth rates in vehicles can be expected to slow down as the year on year comparisons become more demanding. Growth rates in new vehicles sales are now approximating the pace realised at the end of the previous boom in 2006-07.

It is of interest to note that sales of heavy trucks and buses in March 2011 were up by 298 units or 21.4% on a year before. Thus it is not only households that are adding to their stock of new vehicles, but firms are doing so too. This indicates a recovering appetite for fixed investment spending in SA that to date has been the weakest component of domestic spending. The banks, short of mortgage business, have clearly welcomed the opportunity to provide credit for vehicle purchases; though no doubt the balance sheets of the motor manufacturers have also been put to work facilitating sales. Brian Kantor

Inflation and interest rates: The glass is half full

While headline annual consumer inflation was unchanged at 3.7% in February, the underlying trend indicates a somewhat faster rate of inflation of about 4.2%. These trends may be calculated as the monthly move in the seasonally adjusted and smoothed CPI, which is then annualised, or as the quarter to quarter annualised increases in the CPI. Both are running at a similar rate of above 4%. If the current trends are sustained the inflation rate will approach 5% over the next 12 months.


To view the graphs and tables referred to in the article, see Daily Ideas in todays Daily View:

Daily View 24 March – Inflation and Interest Rates

The forces pushing up prices are in part global in the form of rising dollar prices for food and energy. These, as the Reserve Bank pointed out in its Quarterly Bulletin, have been rising sharply as a result of increased demands and some supply side disruptions or expected disruptions in the supply of oil from the Middle East.

Breaking down the February data
The counter to such pressures has been the strength of the rand over the past 12 months. This counter pressure has been more effective in the case of food and less so for the petrol price. The food price component of the CPI is up by 3.6% compared to a year ago. Food prices actually fell by 0.1% in February 2011. The petrol price rose by 3.1% in February and higher oil prices, as well as higher excise taxes on petrol, took the year on year increase in petrol prices to 12.1%.

Food and non-alcoholic beverages account for 15.68% of the CPI basket while transport costs have a large weight of 18.8%. However Purchase of Vehicles carries by far the largest component of transport costs with a weight in the basket of 11.8% out of the 18.8% allocated to transport generally. Petrol has a weight of 3.93% and Public transport also influenced by the petrol and diesel prices has a 2.73% share of the CPI.

Owing to the downward pressure the strong rand placed on new vehicle prices, the overall transport component only increased by 2.6% over the past 12 months despite the higher petrol price. Including the prices of new vehicles rather than their implicit or explicit leasing or rental rates is surely an anomaly in the calculation of the CPI. It is the opportunity implicit or explicit leasing costs of owning a vehicle rather than the price of a vehicle that matters to households. The price of a new or used car furthermore is hardly something clearly indicated on any price list. It will be affected by financial arrangements and by warranties as well as residual and trade in values, all designed to help make a sale.

This anomaly (rentals or prices) is avoided in the case of another important category that makes up the CPI. That is the item Owners’ Equivalent Rent that makes up 12.21% of the basket with Actual rentals for housing making up a further 3.49% of the basket. Electricity prices, which rose by 18.6% over the past 12 months, have a weight of but 1.87%. Actual rents are estimated to have increased by 5.4% and owners’ equivalent rents by 3.9% over the past 12 months. Rentals were unchanged in February, presumably because they were not surveyed last month.

The future of rentals and the rate of inflation will be determined by the state of the housing market. Short term interest rates and the availability of mortgage bonds will clearly influence house prices, rents and rental returns and these will take their cue from the rand. However if house prices rise rapidly landlords may well accept a lower rental rate of return and vice versa. When house prices fall rental may prove much stickier leaving the direction of rentals somewhat independent of house price inflation.

Nevertheless home owners are likely to spend more rather than less as their balance sheets improve with higher house prices, which is unlike the case when most other prices rise. Higher (relative) prices generally restrain rather than encourage extra demands.

The right medicine
This brings attention to the most important contributor to the monthly increase of 0.7% in the CPI. Increased costs of insurance, especially medical insurance, rose by 5.2% in the month and contributed 0.4 percentage points of the increase in prices. These insurance costs are also only surveyed annually rather than monthly and revealed a year on year increase of 4.2%. Are not such increases reflective of the increasing real shortages of skilled medical personnel rather than demand side pressures on prices?

Such shortages of skills are exacerbated by the difficulties imposed by our immigration policies. They show up also in the rate of inflation of educational services provided to households. Primary and secondary education became 10.2% more expensive over the past twelve months and tertiary education was up by 7.9% over the same period.

The forces that restrain domestic inflation and the pricing power of local suppliers are the prices paid for imported goods and services and also the employment benefits received by the internationally mobile owners of scarce skills. Thus the value of the rand is the key to the underlying rate of inflation in SA.

Efforts taken to weaken the rand mean more rather than less inflation. They would also mean slower rather than faster growth, particularly in household spending, which responds favourably to lower prices and lower interest rates that follow lower prices. Growth and inflation in SA over the next twelve months will depend mostly on the global forces that determine resource and commodity prices and capital flows to emerging markets, including SA.

The most favourable outcomes for the SA economy – faster growth with low rates of inflation – will be those associated with rising commodity prices and so a strong rand. High prices for metals and minerals and inevitably also the price of oil (and also coal that we export so much of) represents good news for the SA economy. These forces proved most helpful in reviving the economy in 2010. We must hope for further fair winds to blow in from the global economy in 2011 and restraint from the SA Reserve Bank.

Hard Number Index: Maintaining speed

The February 2011 reports on new unit vehicle sales and the Reserve Bank note issue have been released and we are able to update our Hard Number Index (HNI) of the current state of the SA economy. As may be seen below, the economy continued to pick up momentum in February 2011.
 
The very up to date HNI is proving a reliable leading indicator of both the Coinciding Business Cycle Indicator of the Reserve Bank (updated to November 2010) and the Reserve Bank Leading Indicator of the SA Business cycle (updated to December 2010).  
  Continue reading Hard Number Index: Maintaining speed

Vehicle sales: Why a strong rand is good

It was another big month for unit vehicle sales in February. On a seasonally adjusted basis sales were ahead of the January numbers, which in turn were well up on December.
 
Year on year growth in unit sales has remained in the plus 20% range. However the quarter to quarter growth rates, which are not dependent on base effects, have surged ahead and are now running well above a 40% per annum rate.
  Continue reading Vehicle sales: Why a strong rand is good

Currency markets: Explaining the weak US dollar and the strong rand

Recent trends in the currency markets following the spike in the oil price raise two questions: why has the US dollar weakened and why has the rand strengthened? It should be recognised that the rand has gained not only against the weaker US dollar but also against the crosses, including the Aussie dollar. In the figure below we show the trade weighted value of the rand and the oil price in US dollars based to 1 February 1 2011. The oil price is up about 13% while the trade weighted rand had gained nearly 3% since the oil price spiked in mid month.

The full version of this article can be found in the Daily View here: Currency markets: Explaining the weak US dollar and the strong rand

2011-2012 Budget: Getting value for government money

The first impression one has of the Budget proposals is just how strongly government revenues have grown over the past fiscal year, something around 13%. Also, how strongly tax revenues (not tax rates) are expected to increase over the next few years. At around a 10% per annum rate, or in real terms by about 5%, government expenditure is planned to grow at around an 8% rate or around equivalent to a 3% rate in expected inflation adjusted terms.

Read the full story in the Daily View here: 2011-2012 Budget: Getting value for government money

SA economy: Moving in step

 
We have made the point recently that the companies listed on JSE, have become increasingly exposed to the state of the global rather than the SA economy. Hence the close links between JSE earnings (and performance) in US dollars and emerging markets earnings.  

Continue reading SA economy: Moving in step

The rand: A hopeful portend of better markets to come?

Last week was a better one for the rand. After an extended period of rand weakness that began at the turn of the year, the rand, on a trade weighted basis held its own.

Accordingly the JSE proved to be one of the better emerging equity markets last week (measured in US dollars) though emerging markets again lagged behind the S&P 500 – a trend that has persisted since the beginning of the year. Until the year end the JSE had been an outperforming emerging market during a period when emerging markets had outperformed the S&P 500.

Continue reading The rand: A hopeful portend of better markets to come?