Money supply and credit: Seeking encouragement

The news from the credit and money supply fronts is not very encouraging. Money and credit supplies need encouragement from lower interest rates, not discouragement from ill timed regulatory intervention

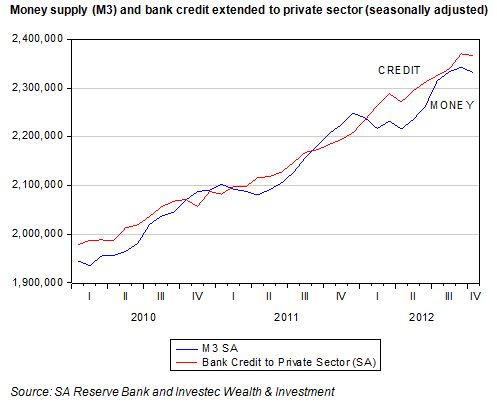
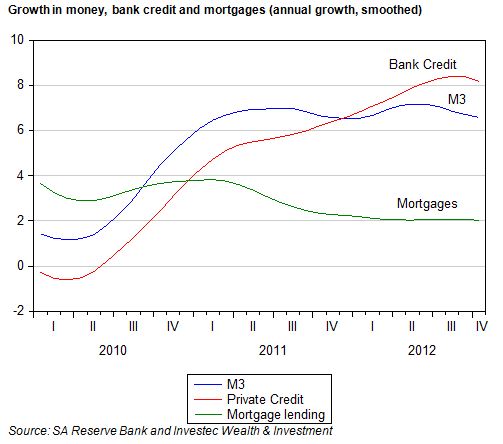
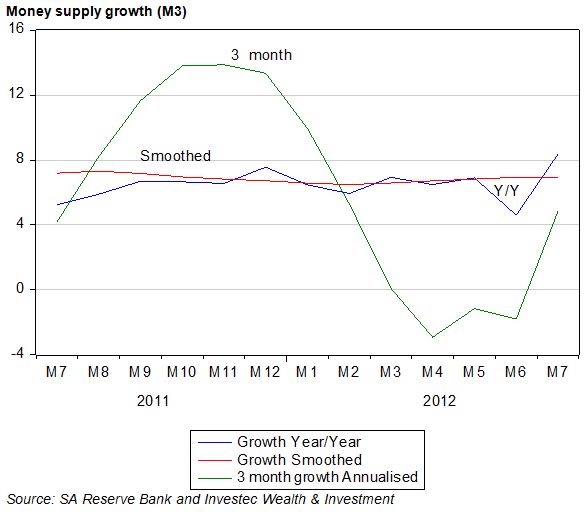
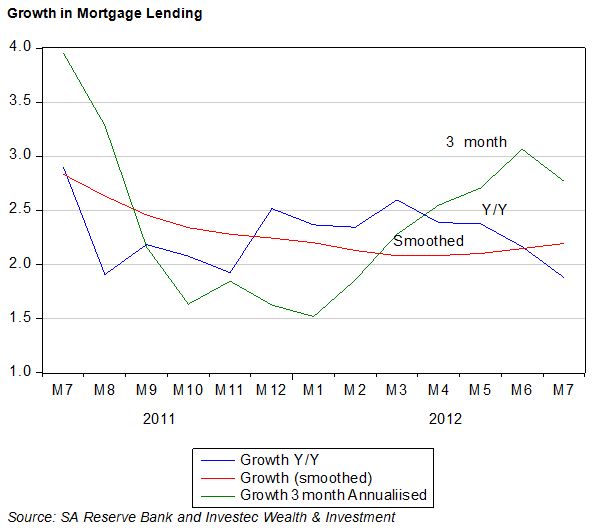
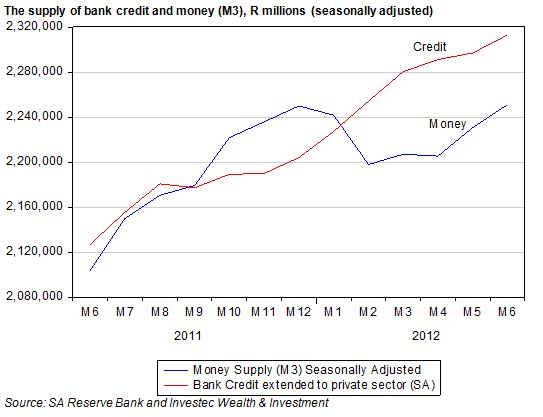
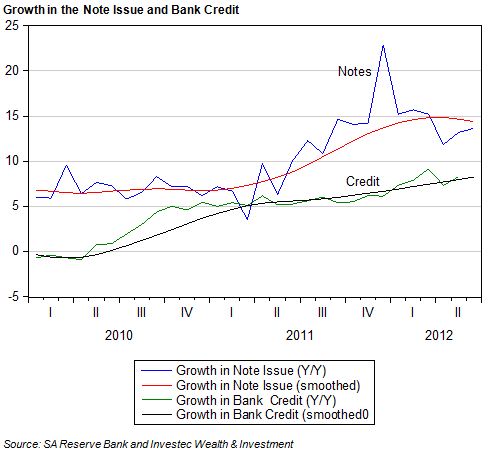
Broadly defined money supply (M3), as well as bank credit extended to the private sector declined marginally in October 2012 on a seasonally adjusted basis. Annual growth in these aggregates, when smoothed, also declined marginally. The broadly defined money supply, mostly made up of deposits with the banks, is now growing at an underlying rate of about 6.6% p.a. while underlying growth in credit extended to the private sector is about 8.2% p.a. Mortgage lending by the banks is growing at an even slower rate of about 2% p.a.


It should be appreciated that these are very modest growth rates, especially given inflation of the order of 6% p.a. With the economy operating well below its potential, it needs all the help it can get from domestic spending and the support money supply and credit growth give to domestic spending. With export prices and especially export volumes under severe pressure, household spending has been supporting economic growth and so the employment and incomes of employees. This helps them maintain their credit.

At this especially vulnerable stage for the SA economy, attempts to reform the credit system in SA are especially likely to lead to less credit being offered, less spending and still slower growth in incomes. Any additional restraints on the willingness to supply credit or to secure credit are precisely the wrong recipe. They are likely to lead to more, not less, distress in credit markets as the economy slows down. Brian Kantor

Domestic spending: Encouraging October

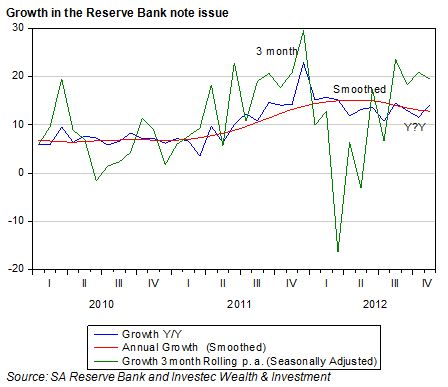
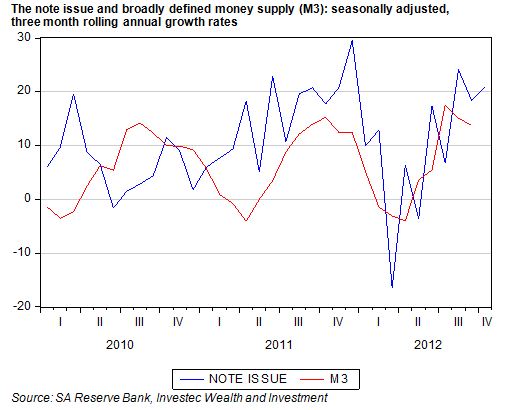
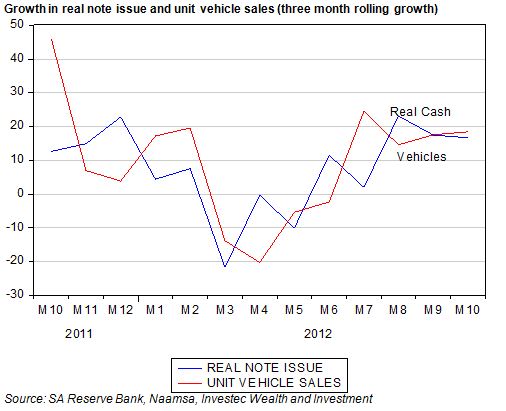
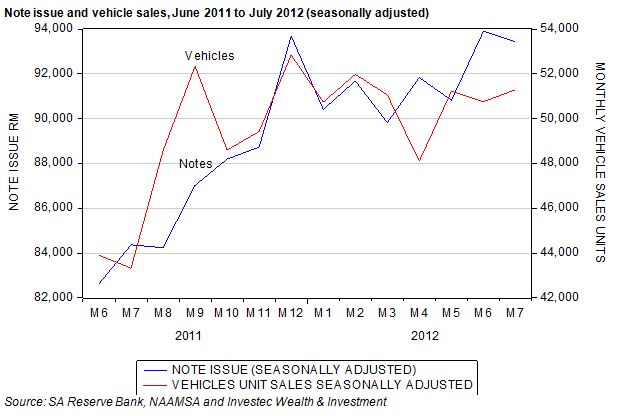
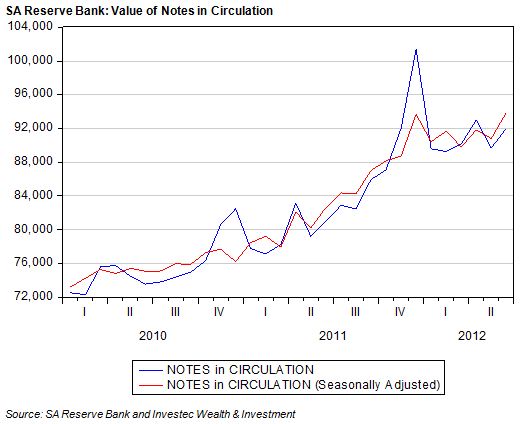
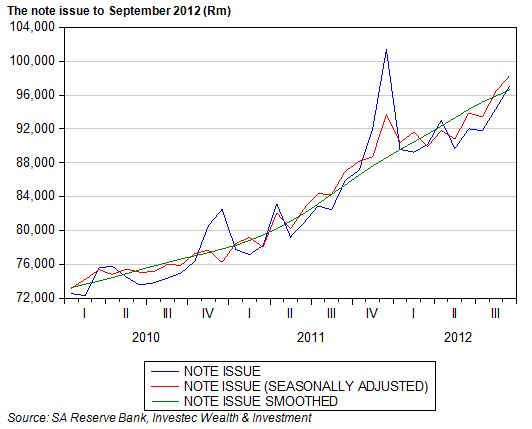
The demand for cash supplied by the Reserve Bank continued to grow strongly in the three months to October 2012. As we have explained before, the Reserve Bank note issue has proved to be a very good indicator of the spending intentions of SA households.

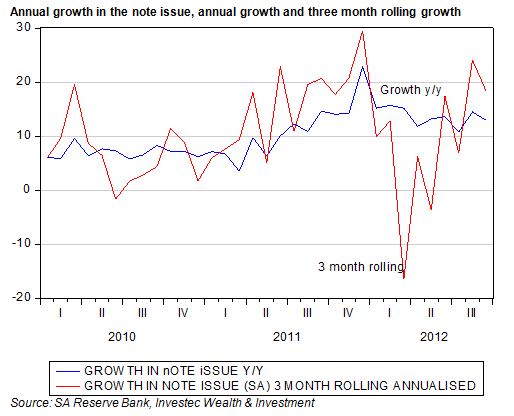
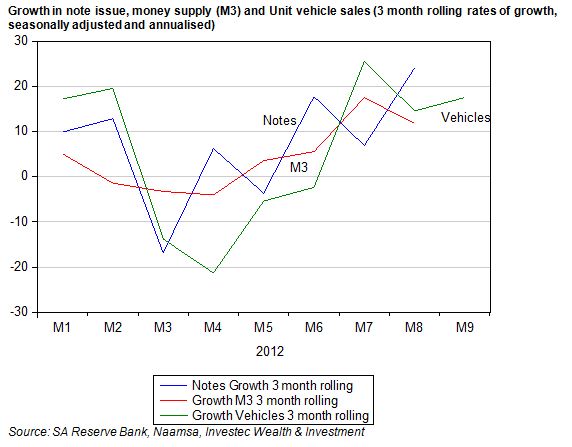
As we show below, the demand for cash fell off in early 2012 but picked up very strongly from mid year. Over the past three months the note issue, seasonally adjusted and annualised, grew by a robust 21%. As we also show, the growth in the broader money supply – mostly in the form of deposits issued by the banks – grew similarly in the three months to September month end.

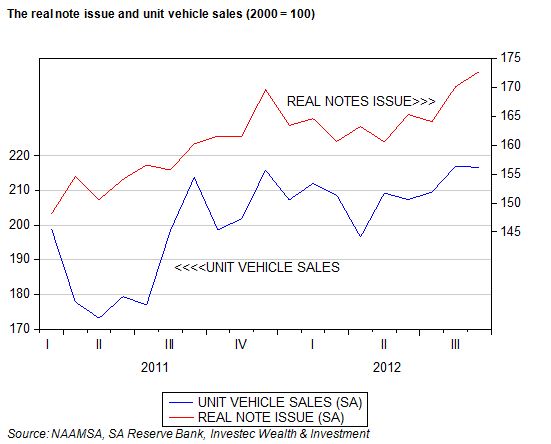
Unit vehicle sales have followed a very similar trajectory to the note issue (adjusted for inflation), losing momentum in the first half of 2012 and then recovering strongly to October.

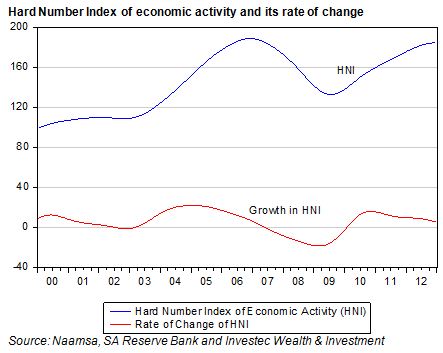
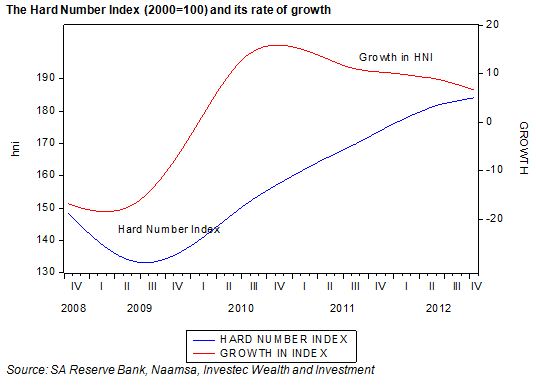
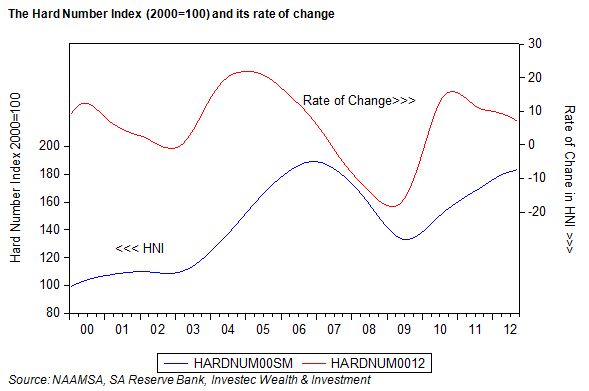
Unit vehicle sales and the note issue (adjusted for the CPI) make up our Hard Number Index (HNI) of the state of the economy. The HNI has two advantages: it is very up to date (updated to October 2012 month end) and it is based on actual recorded volumes (hard numbers) rather than the estimates made from sample surveys.

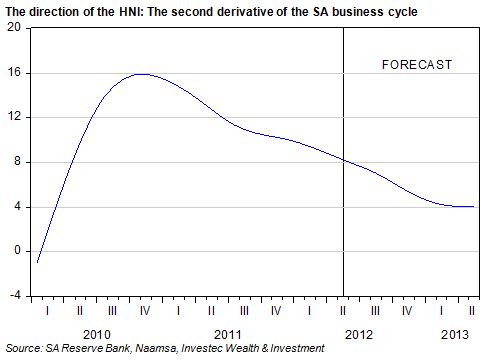
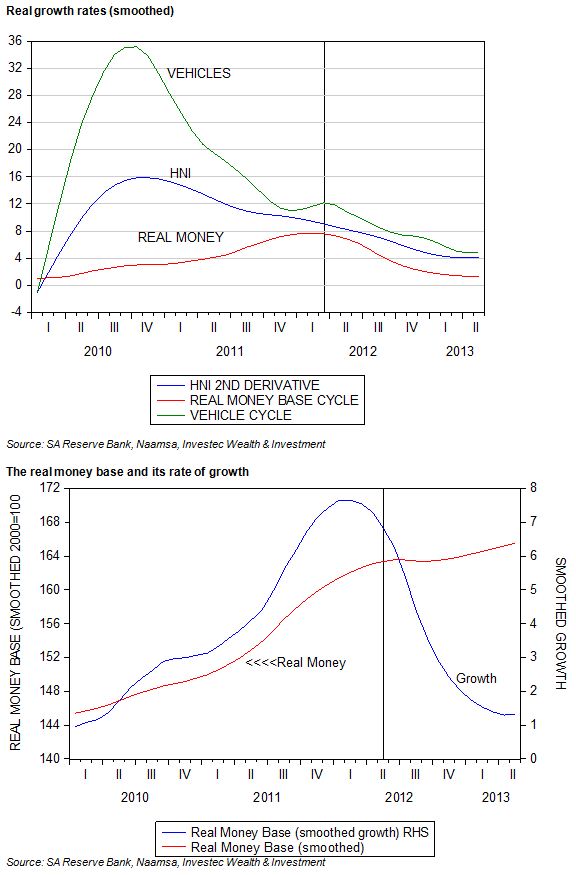
Given the strength in both vehicle sales and cash volumes, the HNI indicates that the economy has continued to move forward at a good pace. Its rate of growth – what can be regarded as the second derivate of economic activity – however continues to slow down. The indications therefore are that the SA economy is continuing to move forward at a good pace but that its forward momentum is slowing.


Other data releases for October – to be released in due course – are likely to confirm that domestic spending intentions and actions remain robust, surprisingly perhaps to the market place.

The figures for the note issue and unit vehicle sales are the first data posted for the economy post Marikana. It would appear that the strike action on the mines and roads of SA have had little negative influence on spending intentions. This resilience of domestic demand is very welcome when foreign demand is growing as slowly as it is, given the weak state of the global economy. If the economy is to retain its growth momentum, which is essential for political stability and a satisfactory fiscal state of affairs, it will continue to depend on the domestic spender. Domestic spending is being encouraged by low interest rates, which can be expected to stay low until global economic conditions improve.

The Census reports good real progress in household incomes and household numbers

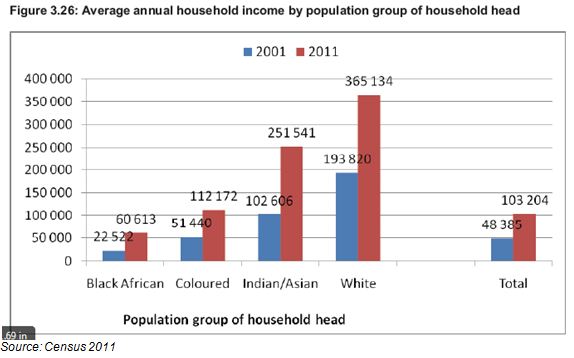
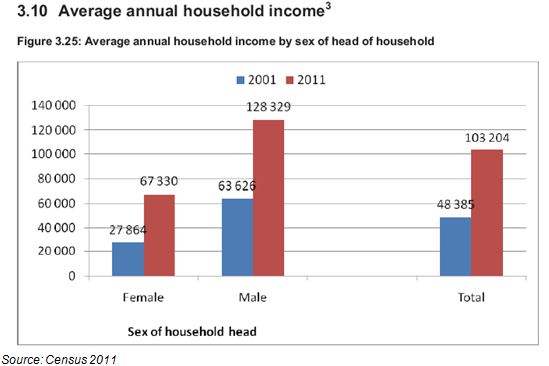
The general impression provided by the census is that significant economic progress has been made in SA over the past 10 years. There are now 14.45m identified households, 28% more than were counted in 2001. Average household incomes of R103 204 were reported compared to R48 305 in 2001. That is an increase of 113% in money of the day terms. Given that the CPI increased by 77% over this period, this implies a real increase of approximately 36% in average household incomes over the 10 years.

The poorest SA households are those led by black Africans. However they did significantly better than the average SA household. Households headed by black South Africans increased their average household incomes by 169% in current prices or by nearly double, when adjusted for inflation between the censuses of 2001 and 2011. The objective of advancing the previously disadvantaged has been met about as well as the government could have realistically hoped for.

The census is consistent with National Income estimates

These increases in self assessed incomes, in response to the question asking respondents to estimate “gross monthly or annual income before deductions and including all sources of income” compare very well with the growth in per capita incomes as estimated by the National Income Accounts. Gross National Income per capita in real terms grew by 35.5% between 2001 and 2011 or at a compound average growth rate of 3.04% p.a. Such growth rates in per capita or average household incomes represent much more than the much despised trickle down. If growth is maintained at this rate over the next 10 years this would represent a doubling of average incomes in 20 years and significant economic progress indeed.

One of the benefits of higher incomes is more and smaller households

It is not surprising, given an improved standard of living, that the number of identified households has increased much faster than the population itself. The population grew from 40.58m residents in 2001 to 51.77m in 2011, an increase of 14.2%, compared to the larger 28% increase in the number of households. Many more family members have had the means able to form households of their own.

The average SA household therefore consists of a surprisingly few 3.58 average members in 2011 compared to a similarly few 3.62 members in 2001. Perhaps this small average household is attributable to the large number of female led households with presumably no males of working age to add to household income or numbers. Households led by women earn significantly less than the average. (see below)

The composition of the housing stock

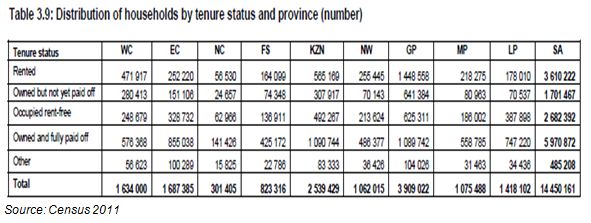
Of the 14.4m housing units identified by the census the great bulk are formal houses or apartments. 1.14 units are described as traditional, 1.249m as informal dwellings (stand alone shacks) with a further 713 thousand shacks in back yards. The ownership structure of these housing units makes interesting reading. Nearly 6m of the units are identified as owned and fully paid off (See below). It is these owners who surely make the most reliable and sought after recipients of unsecured loans.

Stuff at home

These homes – owner rented and mortgaged – seem very well provisioned with household appliances and consumer goods. 10m refrigerators and 11m stoves were identified, together with 4.5m washing machines and more computers, 3m, than vacuum cleaners. 10.7m TV sets entertain the stay-at-homes backed up by as many as 8.5m DVD players and unsurprisingly, 13m cell phones.

Large differences in provincial income –or is it an urban / rural divide?

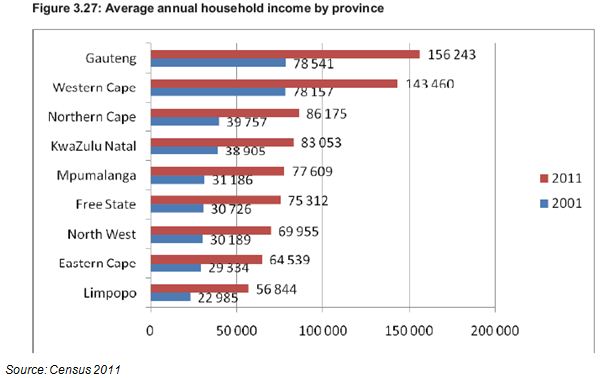
Much larger differences in household incomes are however recorded by the different provinces. Average household incomes are highest in Gauteng (R156 243) and the Western Cape R143 460 – almost three times as high as average household income in the poorest provinces (See below).

These income differences may be regarded as more of an urban-rural divide than a provincial one. The gap between household incomes in the Durban metropolitan region and that or rural KwaZulu-Natal is probably every bit as wide as it is between Gauteng and Limpopo.

Higher incomes mean greater opportunity and so migration – a force to be recognised in advance and encouraged

It is these differences in incomes and income earning opportunities that understandably have led to large numbers (presumably mostly younger men and women) migrating to Gauteng and the Western Cape. Over a million people have migrated to Gauteng over the past 10 years and over 300 000 to the Western Cape. The Eastern Cape has seen net outward migration of 278 000 persons, mostly to the Western Cape, and in Limpopo Province: a net 152 000 residents have migrated to other provinces, mostly to Gauteng.

Migration plus population growth has seen the population of Gauteng increase from 9.38m in 2001 to 12. 27m in 2011, an increase of 30%. This makes Gauteng by far the most populous SA province. The population of the Western Cape has increased by 28% over the 10 years to 5.8m people, more than the population of the much poorer Eastern Cape.

Since transfers from the central government to the provinces are based on the size of their populations, these developments have significant budgetary implications. The argument that the governments of the Western Cape and Gauteng will make is that with migration of this order of magnitude, 10 years is too long to wait to adjust budgets in recognition of population growth and the additional demands growth n population makes on provincial budgets.

However the logic behind the allocation of funds to the provinces based on existing populations, rather than their economic potential, should be questioned. If economic and employment growth were the objective of economic policy then it would surely be better to back the winning provinces – those that offer significant employment and income opportunity – rather than redistribute taxpayers’ contributions to those provinces where economic prospects and achievement are so lacking. The economic potential of SA, as everywhere in the world, lies in the urban not the rural areas. Brian Kantor

Retailers: Making sense of retail sales volumes and the value of JSE Retail counters

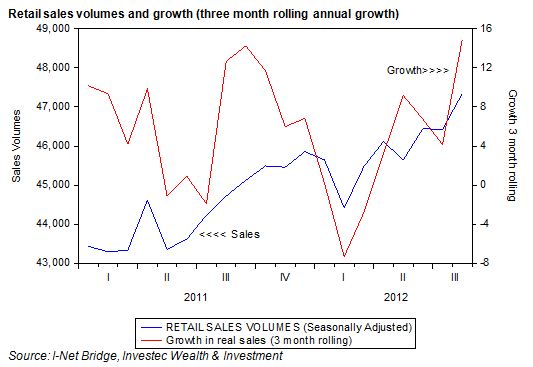
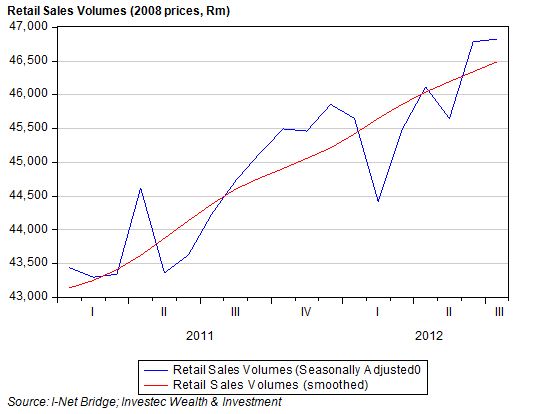
Retail sales volumes in August 2012 were up nearly 2% in August when measured on a seasonally adjusted basis, or 6.5% ahead of their December 2011 volumes. (See below)


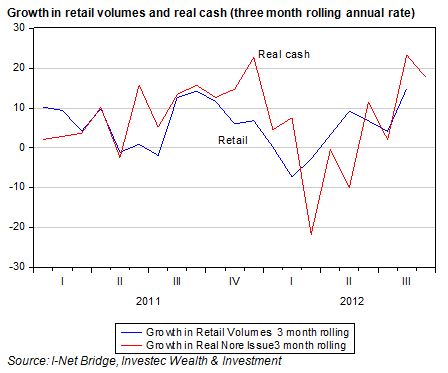
Apparently the buoyancy of sales took economists somewhat by surprise. However observers of the note issue and unit vehicle sales (updated to September 2012 month end) that make up our Hard Number Indicator of the state of the SA economy, should have been less surprised. The retail volumes follow the pattern established by both vehicle sales and the real note issue. That is, growth in volumes, seasonally adjusted, when calculated on a three month rolling basis, picked up strongly towards year end 2011, then fell back sharply in early 2012, whereafter growth accelerated again. (See below)

As we have suggested, and has been confirmed by the strength in retail sales volumes, the SA economy has had more life in it than has generally been appreciated.

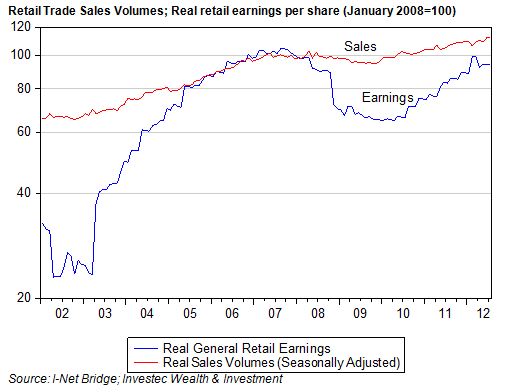
The stock market was perhaps less surprised by the strength in retail sales, given the recent strength of the General Retail and Food and Drug Indexes on the JSE. The value of the JSE General Retail Index, in real CPI adjusted terms, has increased by 35% between January 2011 and 17 October 2012 with much of this strength coming in 2012. Real sales volumes grew by 10% between January 2011 and August 2012.

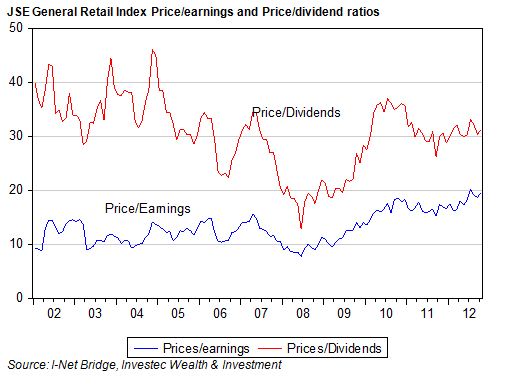
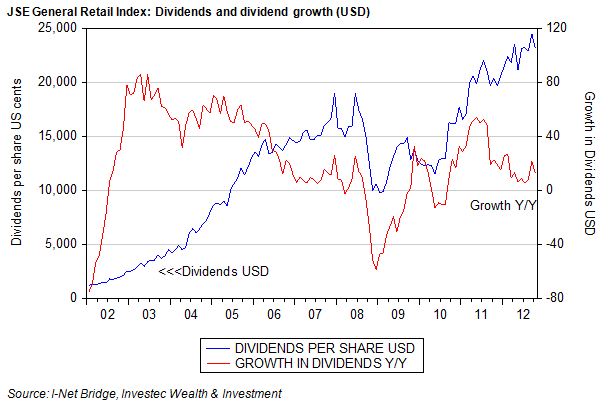
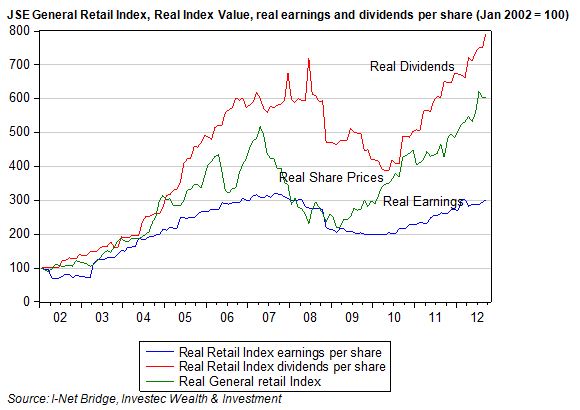
The valuations of retail companies have clearly improved significantly faster than those of real sales. They have also outpaced real retail earnings per share, leading to elevated ratios of share prices to earnings of the retail counters, as has been well documented. However what has not been as well recognised is the extraordinary growth in real dividends distributed by the retail companies. Dividends per retail index share have grown much more rapidly than earnings per share. Dividends in fact have not only grown faster than earnings – 2.64 times as rapidly since 2002 – they have also outpaced the increase in the retail Index as we show below.

Thus, while the price to earnings multiple attached to the general retailers in SA has increased significantly since 2002 (from 9.32 in early 2002 to the current 19.6 times) the price to dividend ratio has in fact fallen since 2002, from R40 paid for a rand of dividends in January 2002 to a mere 31.3 times today.


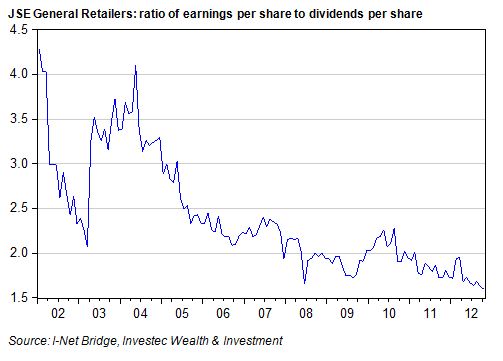
Retail companies listed on the JSE have benefitted from strong growth in sales and stronger growth in bottom line earnings as operating margins have improved. But they have also been able to generate strong growth in free cash flow – that is cash generated after increases in investments in working and fixed capital. The strength of their balance sheets, or perhaps an inability to find sufficient opportunities to deploy cash inside their businesses, has encouraged the retailers to pay out cash to their shareholders in the form of share buybacks and a reduction in earnings cover. The ratio of earnings to dividends per share has declined dramatically over the years, a decline that appears to be accelerating.


These dividends per retail share (in US dollars) have grown at an average compound rate of about 27.1% p.a since 2003 and have clearly had great appeal for foreign investors who have come to hold an increasing proportion of the shares in issue while SA fund managers have (regrettably) reduced their stakes. The Index in US dollars (excluding dividends) has increased at an average compound rate of 24.9% p.a over the same period.


Dividend yield and growth in dividends that SA retailers have been able to generate have had particular appeal in a world of very low interest rates. The exceptional returns provided by SA retailers in recent years are therefore not at all surprising in the circumstances. Their valuations – seen as a dividend rather than an earnings plays – make every sense. Brian Kantor

Outrageous pricing is bad for economy’s competitiveness

SOUTH African Airways (SAA) is a wholly owned subsidiary of the Republic of South Africa, as is Airports Company South Africa (Acsa).

SAA has run out of cash and has been given authority to raise R6bn in debt guaranteed by taxpayers to keep flying.

Acsa, by contrast, is awash with cash. For the financial year to the end of March, it generated R2.9bn in cash flows on customer revenues of R5.8bn — compared with R1.7bn on revenues of R4.6bn the year before. Last year, SAA generated just R278m of cash flow on income of R22.8bn.

This very different state of affairs is not coincidental. Acsa’s gains have been the losses or sacrifice of revenues that SAA and other airlines have had to make in favour of Acsa’s tariffs. SAA is almost certainly Acsa’s largest customer — the collector of the bulk of the fees paid by airlines and their passengers for the use of Acsa’s airports. These fees have risen significantly in recent years and account for a large proportion of what we pay to fly. The revenues the airlines can collect from their passengers is constrained by competition between them. There is no such constraint on the charges Acsa can levy given its near monopoly over all the airports in South Africa.

Acsa has not been shy to exploit its pricing power and neither the regulator nor the Competition Commission has acted as much of a constraint on the exercise of this monopoly power. An increasing proportion of the gross price per passenger flight that the market for air travel will bear, is being collected by Acsa at the expense of the airlines.

This is an issue recognised in economics as the pipeline problem. If you own an oil well or a coal or iron-ore mine and somebody else owns the only pipeline to the port, you are at their mercy. The owner of the transport monopoly can extract all the surplus you might otherwise earn from your mining operations — which is why the mine owners would do well to either own the lines to the market or sign very long-term leases for their use on terms that make economic sense.

Failing that, they may have to rely on the mercy of the regulators, who may control tariffs. The regulators, however, may be inclined to exaggerate the returns required by the owners of very low-risk rail, pipelines and ports, and so allow them to charge more heavily than would be the case were the ports and the lines to compete actively with each other for business. There is every reason to suspect the regulators in South Africa of this bias.

The government has invested on the ground and in the air. The airline business is notorious for the poor returns provided for shareholders while passenger numbers have soared over the years. The major airlines would have done much better to have invested in airports as well as fleets of airliners — as indeed the government, which owns SAA and Acsa, has done. It therefore makes economic sense for the government to keep SAA going — if only to collect the fees Acsa is able to charge. It would also make sense for SAA to be competently managed so that it, as well as Acsa, could contribute dividends and taxes to government revenues and help relieve the burden on ordinary taxpayers.

Another wholly owned subsidiary of the government (and also awash with cash) is Eskom. With much higher prices for the electricity it generates and delivers, cash is pouring into the utility. Some ball-park numbers taken from Eskom’s financial statements will help to make the point. In 2009, Eskom’s cash flow from operations was R5.16bn on revenues from electricity sales of R53.09bn. In the year to March, cash flow from operations was R38.7bn on sales of R114.7bn. Since 2009, cash flows from operations have increased 7.5 times on sales revenues that have grown 2.16 times. This shows how freely the cash flows from all the established capacity when prices are allowed to increase as they have done.

Eskom continues to invest in new capacity. In 2009, it spent R44.7bn on new plants and securing fuel supplies. This year it has spent nearly R59bn for the same purpose. But given the abundant supplies of cash delivered from operations (R38.7bn this year), Eskom needed to raise only R16.5bn of additional debt in the past financial year compared with R30.5bn of debt raised in 2009. Eskom’s debt-to-equity ratio is falling significantly. No doubt this is to the satisfaction of Eskom’s management and the Treasury. But whether such extreme trends are good for the economy is moot.

What is the required return on capital invested in monopoly airports or electricity generators? The justification for higher prices is that they are needed to provide an economic return on the additional capital Eskom is investing in more plant and equipment. The principle of charging enough to cover the full costs of additional capital investment in additional capacity desperately needed by a growing economy is entirely valid. Prices have to be only high enough to cover operating costs as well as to provide an appropriate return on the additional capital invested.

A critical consideration is what return on capital is appropriate for this. The National Energy Regulator of South Africa regards a real return of 8% a year as appropriate for Eskom. Such a return is far too high given the nature of a monopoly utility business that is essentially a very low-risk activity. To aim at a return of about half of this would be about right for the owners of airports or power plants with monopoly rights. A real return of 4% is equivalent to a nominal return of about 10% or about 2% a year above the return on an South Africa long-dated bond. A risk premium of 2%, or about half the average equity risk premium, is consistent with a very low-risk enterprise. The global average real return for utilities of all kinds is about 4% a year.

My own spreadsheet on Eskom indicates that if it gets its preferred way for 90c/kWh, compared with the current 60c, the internal rate of return it would realise on its investment in new power stations, Medupi and Kusile, would be an extraordinary and outrageous 20% a year or more. The potential providers of alternative energy or of contributions to the grid will be cheering Eskom all the way to the bank.

Providing for a real return of 8% or more represents very expensive electricity or airports, even assuming best practice in the management of projects and supplies that may not be justified given such a comfortable financial environment. Inappropriately higher charges by state-owned enterprises, designed to realise much higher real returns on capital, while convenient for the boards and managers of Acsa and Eskom, are very bad news for the economy and its competitiveness. The much better alternative would be an agreed and much lower charge for capital — leading to lower prices for essential services and an insistence on best-practice cost management. It would mean less abundant cash flows for the utilities supplying the service and more debt on their balance sheets (guaranteed by the taxpayer), and so a more competitive economy.

It would also represent a pricing policy that is much fairer to current generations. Under the present practice of forcing savings from consumers through excessive charges for utilities, charges that should better be described as taxes, future generations will inherit the capital stock without the debt that they might appropriately be expected to be still be paying off over time.

Perhaps it might also lead to a fairer labour market in which strike action by relatively well-paid workers is apparently being encouraged by inroads being made on their real wages by ever-higher utility charges.

The SA economy: Hard numbers confirm the reliance on spending

We regard the note issue as a very reliable indicator of spending intentions in SA. It has a particular advantage in that it is updated every month with the release of the Reserve Bank balance sheet, usually within the first week of the next month. The Reserve Bank has now published its balance sheet for September and as we show below, the note issue, on a seasonally adjusted basis, grew strongly towards year end 2011, then moved largely sideways until May 2012 and since then has grown quite strongly. The note issue, seasonally adjusted in September 2012, maintained this strong upward momentum in September and is now well ahead of its level in December 2011.


The strong recovery in the note issue is well demonstrated by the growth measured on a three month rolling basis. This three month growth in the seasonally adjusted note issue, when annualised, turned negative in May 2012, picked up to 17% in June, grew by 24% in August and 18% in September 2012.


When adjusted for consumer prices, the recovery in the real note issue is equally impressive, with the three month growth rate recording about 20% in 2012. These trends in the real cash supply are matched very closely by trends in unit vehicle sales. They too were up strongly in late 2012, moved sideways until May and then also recovered strongly (see below).


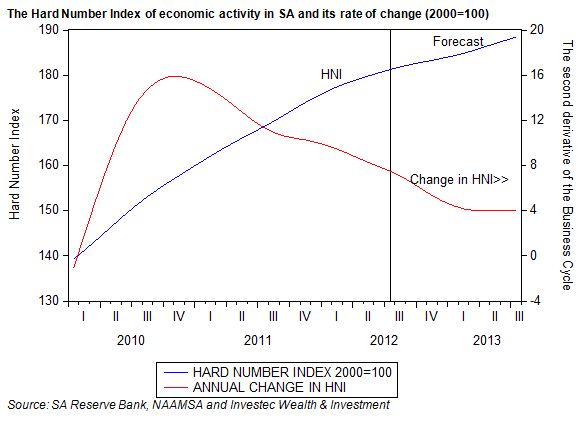
These two series (both up to date hard numbers), rather than based on sample surveys make up our own economic activity indicator that we call our Hard Number Index (HNI). As we show below, supported by the uptick in vehicle volumes and the real note issue, the HNI has continued to move ahead – indicating continued growth in SA economic activity at a more or less stable rate. Numbers above 100 for the HNI indicate the economy is growing and its rate of change, also shown, indicates whether the economy is picking up or losing forward momentum. It would appear that the speed of the economy has slowed down from its peak but has in September almost maintained the speed reached in August 2012. Given the fears of a marked slowdown in activity this outcome should be regarded as highly satisfactory.


It would appear that the SA economy, on the demand side, has shown more strength than is perhaps widely appreciated. Spending appears to have picked up, rather than slowed down, between May and September 2012. These trends have also been confirmed by retail sales and broader money supply trends that we have reported upon. Given the disruptions on the supply side of the economy, this strength in demand is likely to also show up in a wider trade deficit. This might enhance the case for rand weakness – but the underlying strength of demand should also encourage investment and inward capital flows. Brian Kantor
Economic data: Still motoring along

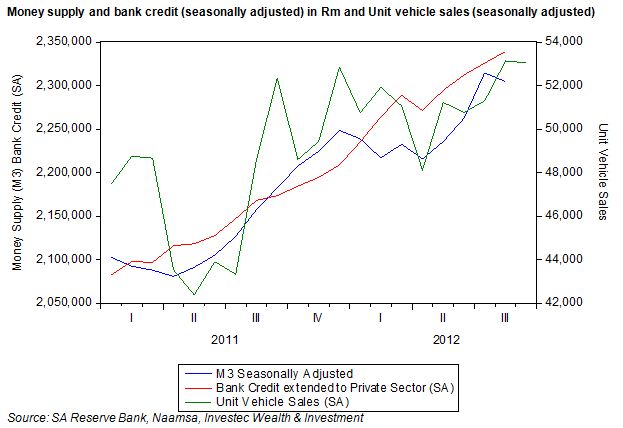
Recently released data on the broadly defined money supply (M3) to August 2012 and new unit vehicle sales updated to September 2012 are consistent with a pattern observed for other indicators of the state of the economy. These include retail sales volumes and the note issue (cash held by the banks and public). The message is that a strong pick-up in activity was recorded in the final quarter of 2011 and was followed by, at best, a sideways trend until May. In June 2012 activity picked up and the higher levels of activity have been sustained since then.

We show this pattern of monthly activity, seasonally adjusted, below. Vehicle sales volumes now exceed the strong sales realised in December 2011 when seasonally adjusted. This recovery in sales volumes should be regarded as highly satisfactory by the industry. The money supply trends, also seasonally adjusted, show a similar pattern, while bank credit extended to the private sector has advanced more steadily as may also be seen in the chart.

Year on year growth rates do not tell the story of what can happen within a 12 month period. That vehicle sales have slowed down (off a higher base) to 1.34% p.a. appears to be something of a disappointment to the Industry but should not be. The growth in vehicle sales on a three month rolling basis – when seasonally adjusted and annualised – tells a much happier story about the state of the vehicle market. It also tells a happier story about the state of the domestic economy more generally when the note issue and the broadly defined money supply, calculated on a three month rolling basis, are taken into account.

The SA economy clearly picked up momentum in mid year while activity appears to be well sustained at higher levels. This strength has perhaps not been widely recognised, given a focus on year on year growth rates. These will come under further pressure from the higher base realised in late 2011. The strength of demand has however shown up in higher imports and (given pressure on export revenues volumes) in a wider trade deficit.

Lower interest rates have been helpful for sustaining domestic demand. Interest rates will need to stay low, and perhaps decline further, to encourage demand in the absence of any likely stimulus for the economy from exports – particularly exports from the disrupted mining sector.

SA economy: Retail strength

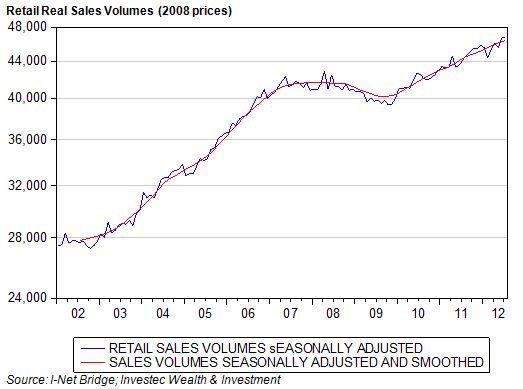
There would appear to be some disappointment with the retail sales numbers for July 2012, details of which were released on Wednesday. We would argue by contrast that sales volumes in July confirmed a strongly upward trend in sales that began in May 2012, gathered strong momentum in June and was well sustained in July 2012. Retailers and their shareholders have every reason to be satisfied with this sustained revival in sales volumes.

The highly satisfactory longer term and shorter term trends in recent sales volumes are shown below. It will be seen that retail volumes have recovered significantly from their recent recession which hit a trough in 2009. In constant 2008 retail prices sales volumes in July 2012 (at record levels as may be seen) were some 17.3% above their lows of October 2009.

The real (CPI) adjusted earnings per share of the General Retailers Index of the JSE has clearly benefitted from the strength in sales. Real Retail index earnings per share have responded even more strongly than sales volumes, having risen nearly 40% from their April 2010 lows – though they have still to exceed pre-recession real levels of earnings.


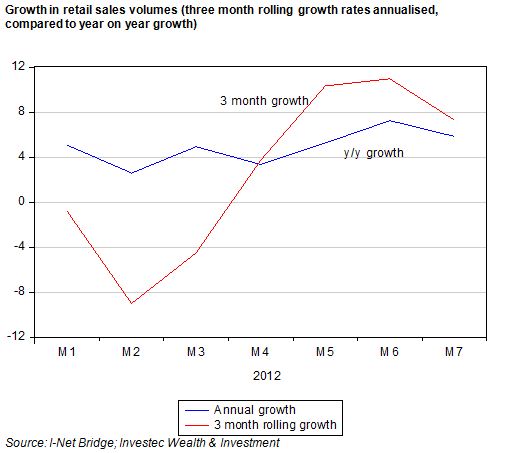
These differences in interpretation of the state of the retail trade sector owe everything to the period of time over which growth is measured. The year on year growth rates, comparing levels this month to the same month 12 months before, are highly smoothed estimates. They can easily miss much of what has transpired through the year. A year can be a very long time in economics as well as politics. The value in looking at retail sales trends over a shorter period than a year is particularly apposite this year.

Retail sales volumes grew strongly in the final quarter of 2011; they were especially buoyant in December 2012 when seasonally adjusted – as they have to be given the strong seasonal influence on sales. This is especially important in the Southern Hemisphere when Christmas spending is combined with summer holiday spending. The seasonal adjustment factor is 1.36 for December and 0.96 for August. That is to say: December sales can be expected to be about 36% stronger than the average month and July sales about 3.3% weaker than the average month.

The growth in retail sales volumes of 4.2% year on year was reported by I-Net Bridge as being well below market consensus that expected a 7.2% rise in sales volumes. The sales volumes reported were based on a new sample survey of the retail sector, making consensus forecasts perhaps less relevant than they usually are.

Based on these new sample sales volumes, seasonally adjusted as they have to be to make good sense of them, the level of real sales volumes in July were only up a marginal 0.1% on June 2012. However June 2012 was a very good month for retail sales volumes. Moreover estimates of sales in June 2012, applying the new sample estimates, were also revised upwards providing a higher base from which growth in July was estimated.

These trends are well captured by annual growth measured on a three month rolling basis. After rising sharply in late 2011, the rolling three month growth in the seasonally adjusted sales volumes fell off sharply in the first quarter of this year and then recovered strongly. The current year on year growth rate in the seasonally adjusted volumes is a robust 5.9% (not 4.2% as per the unadjusted numbers) while the rolling three month growth rates, having risen to over 10% in May and June, have receded to a 7.3% annual pace.


This momentum in retail sales volumes in July is highly consistent with other economic indicators we have reported upon. Retail sales volumes, like unit vehicle sales and the value of notes in circulation, when seasonally adjusted, were no higher in May 2012 than they had been in December 2011. Retail sales volumes, vehicle sales and cash in circulation had similarly demonstrated very strong growth in late 2011,

The economy therefore would seem to have a little more life in it than is usually recognised. Household consumption spending grew very slowly in the second quarter, at a less than 3% rate. It would appear that spending growth has picked up since then and perhaps a lot more so for the merchandise supplied by retailers and motor dealers. This is in contrast with the demand for services by households. Low rates of inflation have helped encourage demand for goods; while much faster inflation of the prices of services (as much as 10% per annum faster) has discouraged the demand for services.

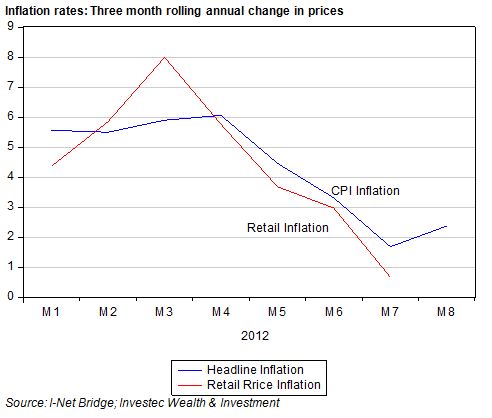
The difference between year on year changes in the CPI (headline inflation) and more recent trends in consumer prices has also become vey significant recently. While year on year the CPI was up very marginally from 4.9% to 5%, recent trends in the CPI have been much more favourable. On a three month rolling basis CPI inflation slowed down to below 3% p.a in August, the result of a succession of very small monthly increases. The CPI increased by 0.24% in August 2012 from 0.325% in July, 0.24% in June and 0.08% in May 2012. Retail goods inflation, as represented by changes in the retail goods deflator, slowed down almost completely in the three months to July 2012, as we also show below.

A sense of inflation trending down (as per the rolling three months growth rates in the CPI) or trending up (as per the year on year growth rates) leads to implications for the inflation outlook and so perhaps to interest rate settings. That monthly increases in the CPI were very high in the early months of 2012 means that there is every chance of a sharp decline in the year on year inflation rates in early 2013. Monthly increases in the CPI in late 2011 were by contrast very subdued, meaning that the year on year headline rate of inflation is likely to rise in the months immediately ahead.

These month by month blips in the headline inflation rate should surely be ignored. It is the underlying trend that will be either friendly or unfriendly for the longer term trends in the CPI. And this trend will be dominated by the rate of exchange for the rand – over which interest rates and monetary policy have no predictable influence if again past performance is the guide.

The notion that year on year headline inflation should lead the direction of interest rates in SA – rather than the state of the domestic economy – is an idea that has fortunately lost credibility at the Reserve Bank if not yet in the media. Brian Kantor

The SA economy: In a holding pattern

The SA economy was in a holding pattern in the second quarter, helped by infrastructure spend, capital inflows and a sympathetic Reserve Bank

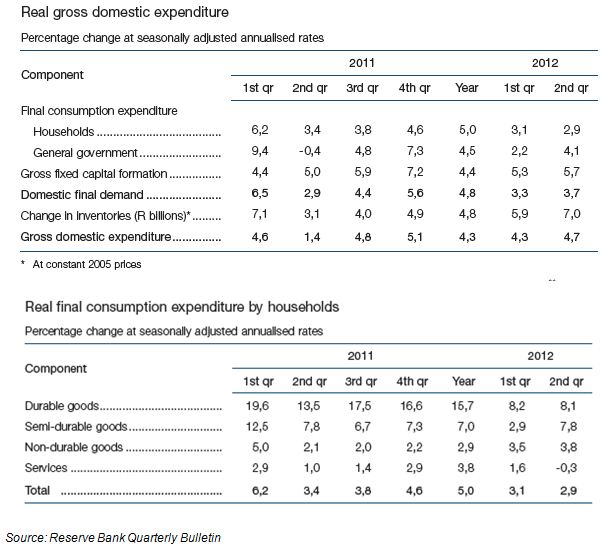
The SA economy did better on the demand side than it did on the supply side in the second quarter of 2012. Statistics on domestic expenditure, only now released by the SA Reserve Bank, complete the national Income accounts for the quarter. They show that Gross Domestic Expenditure (GDE) grew by 4.7 % in the second quarter at a seasonally adjusted annual rate – compared to GDP that grew at a 3.2% rate.

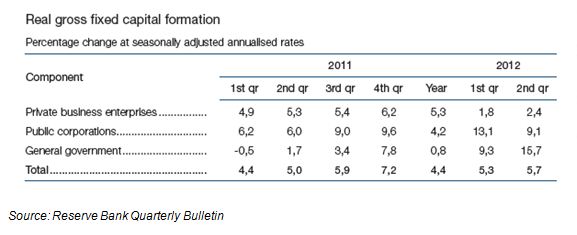
The fastest growing component of demand was Gross Fixed Capital Formation (GFCF) that grew by 5.7%. Households increased their spending on consumption goods by a pedestrian 2.9%, but household spending on durable goods (vehicles and appliances etc) and semi- durables (clothes etc) grew much faster than this while spending on non-durables (food) and especially services grew much slower: spending on services actually declined.


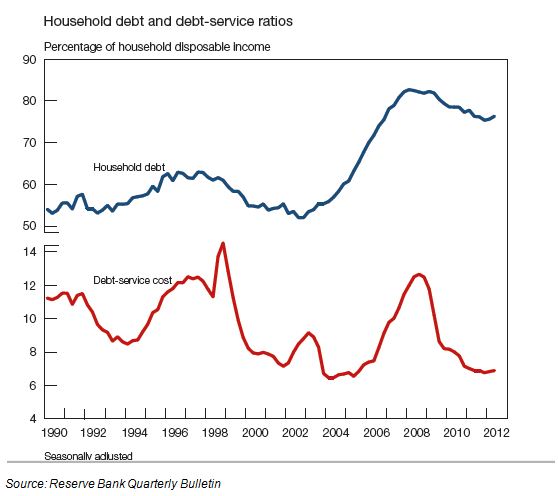
No doubt relative prices and, to a lesser degree, extra credit played a large part in these outcomes. Food and service prices rose faster than the prices of cars, appliances, clothes and perhaps especially services provided by municipalities. Consumers adjusted their spending accordingly, as they have been doing for some time. The Reserve Bank shows that the household debt to disposable income rose slightly after this ratio had fallen for an extended period. Thanks to lower interest rates, the debt servicing to disposable income ratio has stabilised at a very low 6%.

Where is the infrastructure spend?

This is a question often asked. The growth in spending on infrastructure is very apparent in the numbers. Capital expenditure by the government and the public sectors grew very rapidly in the quarter: by 9.1% pa and 15.75 pa respectively. Perhaps the impact is not easily seen or felt because of its high import content.


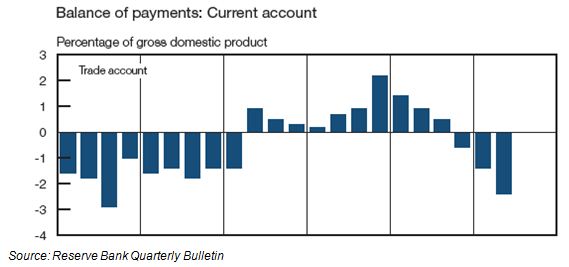
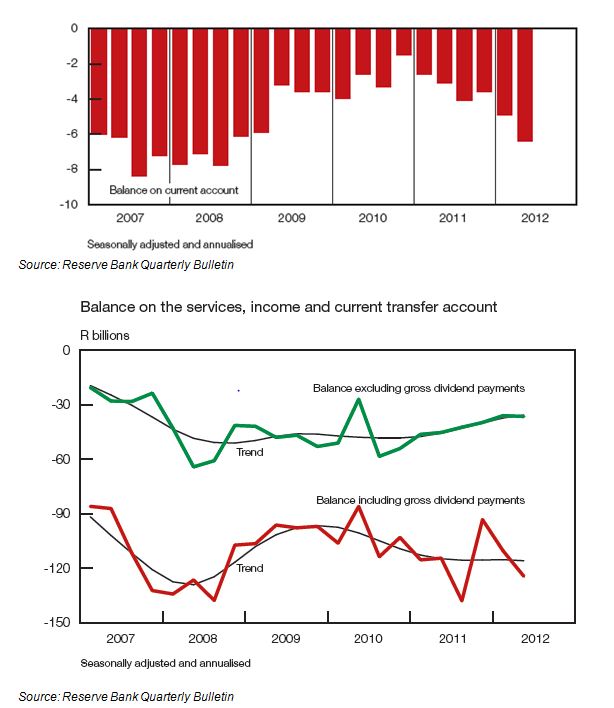
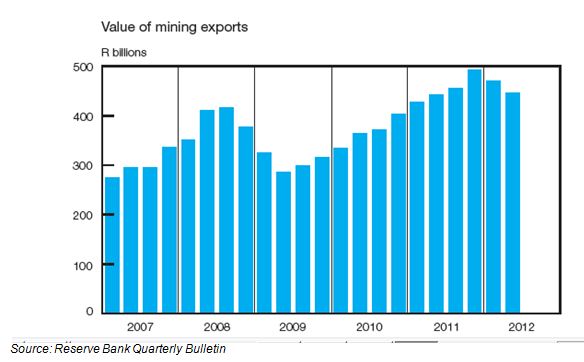
When spending rises faster than output, imports grow faster than exports and the balance of trade deteriorates. The major contributor to the very large current account deficit (which ran at a annual rate of over 6% of GDP in the second quarter) was a weaker trade balance. Export volumes nevertheless grew at a good rate of 5.9%, while imports grew even faster at a 9.7% real rate. Yet while export volumes grew strongly, prices for minerals and metals realised on global markets were less favourable, leading to a decline in rand revenues from the mining sector. Mining sector output in fact recovered very strongly from a low base in the quarter, so making an unusually important contribution to GDP growth in the quarter.

The outflows on the current account were fully matched by net inflows of foreign capital of R48bn. This is not a coincidence – it is much more like two sides of an equation. Without the capital the rand would have been much weaker, prices of imported and exported goods would have been much higher and demand for imports lower.

The economy would also have grown at a still slower rate without support from foreign investors. This makes the current account deficit and the accompanying capital inflows much more of an opportunity than the problem that it is so often and simplistically portrayed as. It is economic growth in SA that drives the returns on capital and the interest rates that attract foreign capital. Less growth means inevitably less capital attracted. Faster growth attracts more capital. Had growth in SA been even slower in the second quarter the current account deficit would have been smaller and capital inflows smaller. The rand might then have been even weaker (it lost 4.8% of its traded value in the second quarter, having gained 4.4% in the first) and inflation higher. These clearly would not have been desirable outcomes.

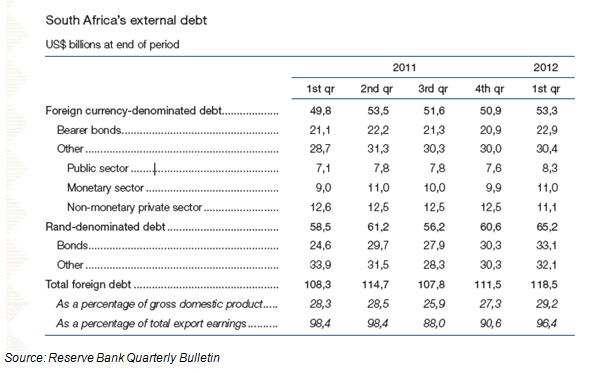
That much of the growth in imports was attributable to capital formation – which adds to the economy’s growth potential – is therefore helpful in attracting capital. Also helpful is that foreign currency debt issued by the SA government and the banks remains at manageable levels and has shown very little growth. A further helpful factor is that foreigners have shown a strong appetite for rand denominated debt, upon which default is technically impossible. Since there is no limit to the number of rands the SA government (via the Reserve Bank) could create to pay off rand debts, this demand for rand denominated debt represents a vote of confidence in SA’s fiscal conservatism and in the strength of its banking system.

The banks raised nearly US$9bn of rand denominated debts from foreign lenders between the first and second quarters. The private sector outside of the banks reduced their foreign debts over the same 12 months.

There are clearly upper limits to the liabilities SA and South African households and businesses can incur. What these limits are, are not known. Until they are known and a lack of foreign capital becomes an actual problem for the economy, it makes no sense to sacrifice growth for fear of reaching these limits. In fact slower growth would in all likelihood exacerbate, rather than help resolve any lack of capital inflow.

If the economy picks up momentum over the next 12 months (hopefully stimulated by faster global growth and higher export volumes and prices) returns on capital invested in SA business will improve and interest rates may well rise. These trends will attract foreign capital and the rand would very likely strengthen in what will be a more risk-on environment.

If the economy fails to pick up momentum in the absence of a recovery in the global economy, domestic demand will need and get encouragement from perhaps lower interest rates. A weaker rand would seem likely in such less hopeful circumstances. Should growth rates remain unsatisfactory over the next 12 months, the Reserve Bank is no more likely to feel restrained in its interest rate settings by the current account deficit than it has been to date. The best monetary policy reaction to the current account deficit or capital inflows is one of benign neglect. The Reserve Bank seems capable of ignoring the balance of payments. Brian Kantor
New vehicle sales: Maintaining a brisk pace

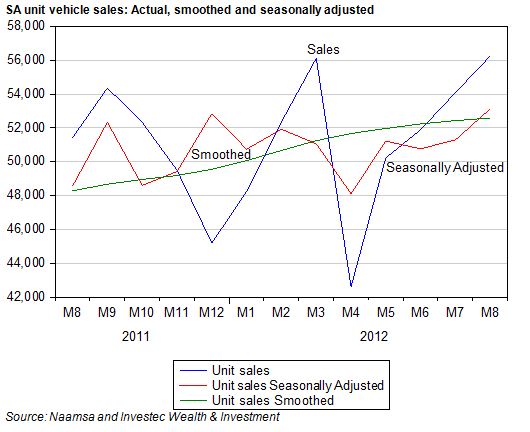
New vehicle sales were at a highly satisfactory level in August 2012. Unit sales have maintained their recovery from somewhat depressed 2012 Q2 levels. Actual sales were up from 54087 units in July to 56253 units in August 2012. On a seasonally adjusted basis unit sales were up by 1831 units.

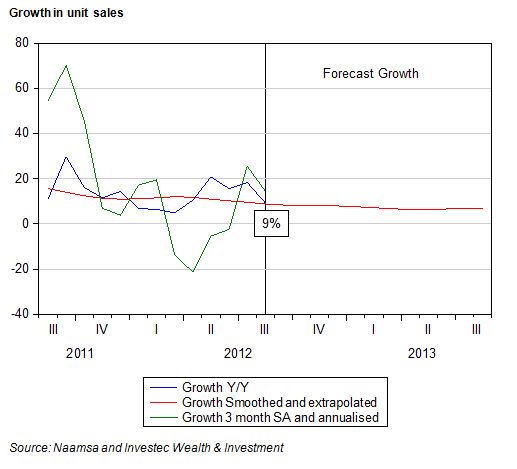
It should be noticed that on a seasonally adjusted basis sales are well up on a year before but are little changed from sales levels (when seasonally adjusted) realised in December 2011. Given the surge in sales that materialised late in 2011, this higher base of sales will make year on year growth comparisons (currently 9% p.a) more onerous in the months to come.

Yet if currently favourable trends persist, the retail sector of the motor industry could look to a monthly sales rate of 56 000 units this time next year, compared to the current rate of 52 600 new units now being sold. This would represent a growth trend of about 7% that, if realized, would be regarded as highly favourable for this sector of the economy. Clearly, lower and stable rates of interest are helping to sustain this important sector of the SA economy. Brian Kantor
Private sector credit: No joy or danger

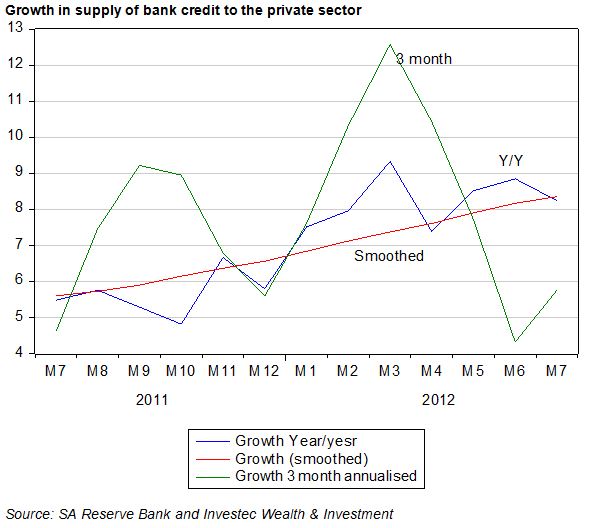
Bank credit and money supply statistics for July 2012, released yesterday, indicate that growth in the demand for and supply of credit and money continues at a sedate pace. The pace of growth appears strong enough to keep the economy moving forward – but at a pace that will not fully engage the economy’s potential.

In line with house prices, that are at best moving sideways, mortgage lending by the banks continues to grow very slowly, at about a 2% per annum rate. Growth in mortgage lending over the past three months however did pick up some momentum – perhaps indicating some reversal of recent trends. Without a demand from their customers for secured credit, the interest the banks have in expanding access to unsecured credit will hopefully be sustained, supplying some impetus to the economy that is sorely needed.

These trends confirm that monetary policy will stay on an accommodative course – designed to encourage domestic spending when little help can be expected from the global economy and demand for exports. Credit and money supply trends help make the argument for lower rather than higher short term interest rates. Brian Kantor
SA economy: Growing, but at a decelerating pace

Retail sales help confirm a welcome recovery of spending in June

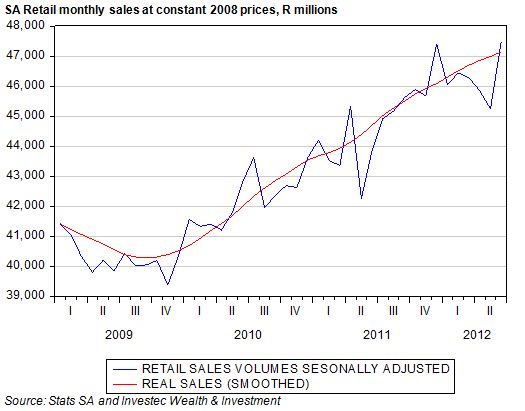
Retail sales volumes reported by Stats SA last week confirm that the SA economy had a rather good month in June. Sales volumes picked up strongly, having grown very little on a seasonally adjusted basis between December 2011 and May 2012. As we show below retail sales volumes(at constant 2008 prices) recovered strongly in late 2009 from their post recession lows, picked up momentum in late 2011, but then fell away rather badly on a seasonally adjusted basis in the first five months of 2012.


We had learned earlier that June 2012 was also a good month for the banks. This is not a coincidence: economic activity tends to lead rather than follow bank lending. The banks respond to demands for credit to fund intended spending decisions by households and firms. Bank credit extended to the private sector grew strongly in June 2012, as did the deposit liabilities of the banking system (known as M3, the broadly defined supply of money). M3 almost flat-lined between December and May while bank credit grew steadily over the period and also picked up momentum in June.

The data for June 2012 may be regarded as encouraging enough to suggest no further cuts in interest rates are necessary to keep the economy going forward at a satisfactory pace. However June is a long time ago. We are more than half way through August and a month can be a long time in economic life.

Updating the state of the economy to July 2012

We do however have some useful additional information about developments in July 2012, in the form of vehicle sales and the notes issued by the SA Reserve Bank. These two hard numbers help make up our hard Number Index (HNI) of the immediate state of the SA economy (or, to put it more precisely, combining the vehicle sales with the note issue adjusted for the CPI, equally weighted, gives us the Hard Number Index). As may be seen below, both series show a very similar pattern to that of retail volumes and the money and credit numbers. They show a good recovery in activity in the second half of 2011 that accelerated towards year end. Thereafter activity flat-lined between January and May 2012 as may be seen below. It may also be seen that in July the faster pace was maintained at the higher June levels.

The Hard Number Index (HNI) – an estimate of the state of the SA economy in July

An HNI above 100 indicate growth in economic activity. As may be seen below, economic activity in SA according to the HNI continues to expand but at a slower pace. When these trends are extrapolated further the outlook is for further increases in economic activity and for the rate of increase to slow down further.

Why the HNI is a good leading indicator for the SA economy

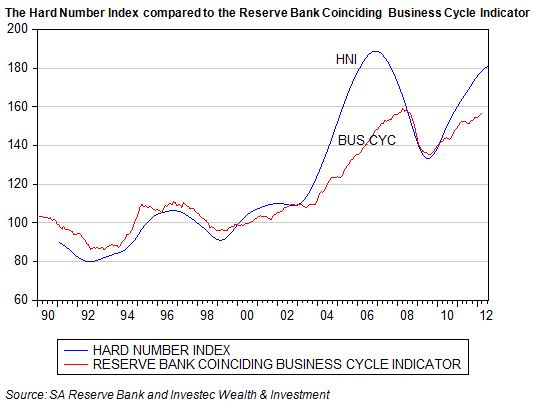
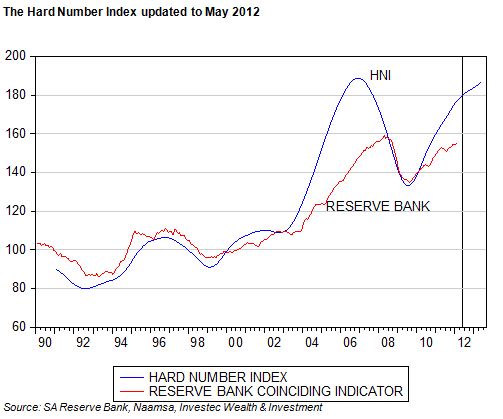
In the figure below we compare our HNI to the Reserve Bank Business Cycle Indicator that is based on a wider number of activity indicators based on sample surveys. Both series indicate very little growth in economic activity before 2003, with numbers that stayed around 100. The measures of economic activity have been consistently well above 100 ever since 2002, indicating that the economy has grown consistently since then, though at a forward pace that accelerated until 2006; slowed down between 2006 or 2007; and then picked up forward momentum in 2010.

The two series have tracked each other very well over the years. They indicate the same time in 2010 when the pace of growth began to accelerate again rather than decelerate. The rate of change of the HNI turned down well before the Coinciding Indicator in 2006 as may also be seen. The advantage of the HNI is that it very up to date – available measured for July 2012 while the Reserve Bank Indicator has only been updated to only.April 2012.

The HNI may therefore be regarded as a very useful and up to date indicator of the SA Business Cycle. There is every indication from it that the SA economy will continue to grow in 2012-2013 but at a decelerating pace that is not likely to threaten any change in current interest rate settings. These have been helpful to date in keeping the economy moving forward, despite a weaker global economy, by encouraging household spending and the extra credit needed to sustain it. Brian Kantor
The Hard Number Index: A good June

We play close attention to two important indicators of the state of the SA economy. These are new vehicle sales and the notes issued by the SA Reserve Bank. The great advantage of these data points is that they are very up to date and that they are based on hard numbers rather than sample surveys that inevitably have measurement issues.

We combine these two hard numbers to form our Hard Number Index (HNI) of the current state of the SA economy. We deflate the note issue by the Consumer Price Index (extrapolated one month ahead) to establish the real note issue that makes up half of the HNI. As we show below, the HNI has provided a very good leading indicator of the SA Business Cycle as calculated by the Reserve Bank. The recent turning points in the two cycles have coincided very closely.

The advantage of the HNI is that it provides an early indication of the state of the economy in June2012. The Reserve Bank Indicator only gives us an estimate of the state of the economy as of March 2012, for which period we anyway have the much broader GDP figures and other national income estimates.

It may be seen from the HNI that economic activity in SA continued to expand in June. The pace of growth in June, as reflected by the rate of change of the HNI (what may be regarded as the second derivative of the business cycle) has however continued to slow. Nevertheless June 2012 was a very solid month for new vehicle sales and the note issue in June showed a marked pick up compared to the note issue three months before.

As we show below, the note issue, having grown very strongly towards year end 2011, fell back between January and May 2012 only to recover in June 2012. Clearly the demand for notes is affected by the spending seasons, especially in December, and can only be interpreted with the aid of an adjustment for seasonal influences. That the value of the notes issued in June 2012 grew so strongly in response to the extra demands for cash from by the public and the banks, is an encouraging sign of improving spending propensities.

It is of interest that the note issue has grown significantly faster than the supply of bank credit or of broader measures of the money supply. This implies that these may take a similar path to that of bank credit extension to the private sector. This would suggest that the additional demand for cash is coming from the public to fulfill spending intentions rather than from the banks. It is the informal rather than the formal sector of the economy that uses cash rather than access to bank deposits as its principal medium of exchange. Therefore this may suggest that the informal sector is growing faster than the formal sector and by so doing is helping to sustain the pace of economic activity.

The Reserve Bank is likely to take much more notice of the slower growth in bank credit than the faster growth in its note issue when deciding on the right level of interest rates. It is the weak credit numbers, combined with threats to the global economy and so to export volumes and prices, which could lead the Reserve Bank to lower its repo rate next week when its Monetary Policy Committee (MPC) reconvenes.

The SA economy is still operating below its potential growth of about 4% p.a. Lower interest rates would encourage more domestic spending and borrowing and help prevent some further economic slippage (in the form of a still wide gap between potential and actual output that exports cannot realistically be expected to close anytime soon). With an improved inflation outlook it would make sense for the Reserve Bank to do what it can to help sustain domestic spending – the one potentially brighter light in an otherwise difficult economic environment. Hopefully the Reserve Bank will make a similar judgment. Brian Kantor
The Hard Number Index (HNI): The foot comes off the accelerator

Our Hard Number Index (HNI) of the current state of the SA economy indicates that economic activity in SA continues to grow but its rate of acceleration (that is, the forward momentum or speed of the economy) appears to be slowing down and may slow down further if current trends persist. In other words, while the SA economy continues to move ahead it appears to be be doing so a slower speed.

Our HNI is based on two equally weighted, very up to date hard numbers, namely: new vehicle sales released by the motor manufacturers (Naamsa) for May earlier this week and the real value of the notes in circulation at May month end. The notes in circulation figure was released yesterday in the updated Reserve Bank Balance Sheet.

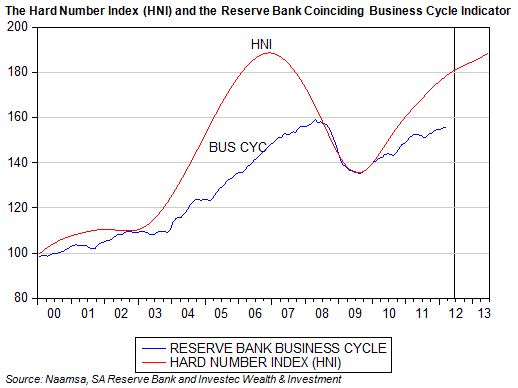
This series we then convert into the Real Money Base by deflating it by the CPI (extrapolated one month ahead). The current level of the HNI and a time series forecast of it is shown below where it is also compared with the Reserve Bank’s business cycle indicator – only updated to February 2012.

In the figure below we show the change in the forward speed of the economy by measuring the rate of annual change in the HNI. This may be regarded as the speedometer of the economy. The fastest forward speed registered recently by the HNI was in late 2010. The foot has come off the accelerator gradually since then, with a further slowdown in forward momentum predicted.

As we show below, it is the decline in the growth of the supply of and demand for notes by the public and banks (adjusted for the CPI) that is slowing the forward momentum of the HNI, more than the direction of the new vehicle growth cycle, which is also trending lower. Growth in new vehicle sales has peaked, but growth is holding up rather well. May 2012 was a better month for the motor dealers than April 2012, even when seasonal factors like number of trading days are taken into account.

However the underlying growth trends are clearly pointing down, as are broader measures of money supply and bank credit growth. This is the case even though the economy may be regarded as growing slower than its potential growth. The Reserve Bank has suggested this will occur in late 2013. The money market has come to predict that the economy may take much longer to realise its potential growth. Decreases, not increases in short term interest rates are now being predicted to help the economy along. Our direction of our HNI supports such a view. Brian Kantor
 

An explanation of the numbers

The HNI and the Reserve Bank Indicator may be regarded as a proxy for the underlying state of the economy. When the indicator registers above a real base value of 100, the economy is producing more goods and services, it is growing, and when below 100 the economy is shrinking. Growth will then have turned negative. As may be seen from the HNI and the Reserve Bank Coinciding Business Cycle Indicator, that hovered around 100 between 1990 and 2002, economic activity did not appear to have expanded at all in SA over these years. Since then the index numbers have remained well above 100.

In 2006 -07 the HNI Index turned lower but still remained well above 100. This indicates that while economic activity was still expanding in 2008-09 it was doing so at a slower rate and that the upper point in the Business Cycle, the period of maximum growth or forward economic speed had passed. The HNI Index turned down before the Reserve Bank Indicator and then picked up forward momentum in late 2009 at exactly the same time as the Reserve Bank Index. This indicated that faster rather than slower growth was under way: the HNI more timeously and usefully than the Coinciding Indicator.

GDP provides another much more comprehensive estimate of the level of economic output and its rate of growth. But based, as it must be, on a large number of sample surveys of activity across the economy, and not on hard numbers, these GDP estimates lag well behind economic events. This is true even of the initial estimates of GDP that capture the headlines but that will be subject to significant revisions. We are already in June and national income estimates for the first quarter of 2012 still are only partly released. These lagging indicators of economic outcomes call for more up to date estimates – hence our HNI. But one does wonder about the usefulness of the Reserve Bank’s Coinciding Business Cycle Indicator, or even its leading economic indicator, that even lags behind the lagging GDP estimates themselves.

Vehicle sales: Post Marikana resilience

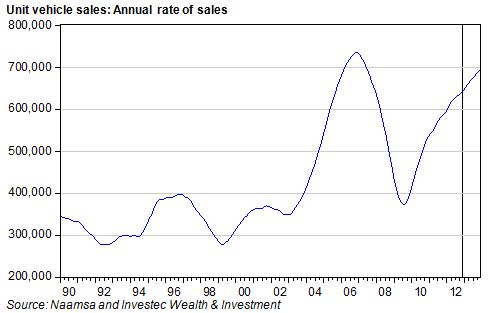
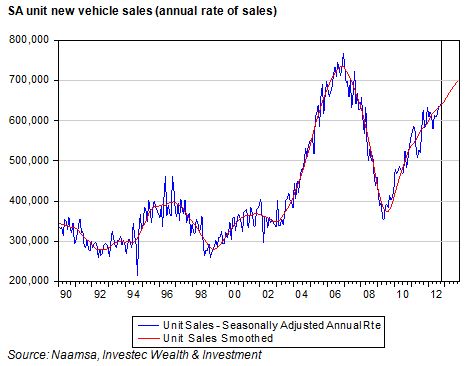
October proved to be another very good month for vehicle sales in SA. On a seasonally adjusted basis, an extra 675 new vehicles units were sold in October than in September. On an annual basis sales are now running at 644 505 units and if present trends are sustained, sales could be about 700 000 units by October 2013. This would leave the industry only slightly behind peak sales of late 2007.

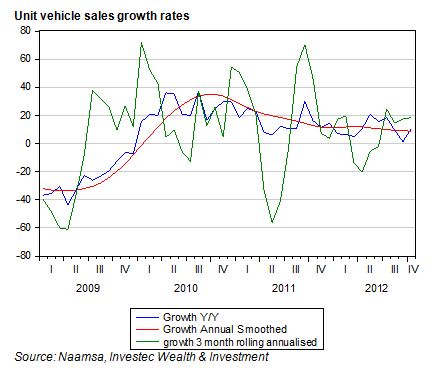
The headline growth in sales – unit sales compared to the same month a year ago – perked up to a 10.5% rate from a sedate 1.4% growth in September 2012. This growth rate will receive most attention but the much more meaningful indicator of sales to come is the more recent growth trends. As may be seen in the chart below, the growth in seasonally adjusted unit sales compared to three months ago was at an 18.5% rate. As the chart shows, this three month growth rate picked up sharply in July 2012 and has been sustained at a very robust rate since then. The annual smoothed rate of growth appears to be trending towards a 9% rate.

Vehicle sales are the first indication of the state of the SA economy post Marikana. That unit sales could have sustained their forward momentum in the face of such a potential shock to confidence should be regarded as highly encouraging. The buyers of vehicles and the banks that finance such sales do not seem to have been much put off by the problems of the mining industry. Such resilience is surely welcome. Brian Kantor
From the global economy to the optimum SA portfolio – Why SA economy plays on the JSE deserve their improved ratings

The global economy is still the main determinant of performance on the JSE. In this note, we break the JSE into three main categories, interest rate plays, commodity plays and rand hedges, and look at how these are likely to perform according to certain global and SA market conditions.

Click here for the full report:
From the global economy to the optimum SA portfolio

SA bonds and the rand: Are the stars for SA infrastructure spending aligning?
The risks of investing in emerging market foreign currency denominated debts have continued to recede as the Eurozone debt threat to global financial markets has diminished. RSA sovereign debt is no exception in this regard. The credit default swap (five year) risk spread on RSA debt was 202 bps at the beginning of 2012 – it is now nearly 30bps lower. The spreads on Russian and Brazilian debt have declined similarly as we show below, with Brazil continuing to enjoy a significant debt premium over RSA debt.

Click here for the full report:
SA bonds and the rand 21 Feb 2012

Retailers and the JSE: explaining a success story

It seems clear that the retailers listed on the JSE are not expected to realise long term growth in earnings at anything like the rate at which earnings have been delivered over recent years. However they are no more demandingly valued today than they have been over the past 10 years. JSE retailers have provided excellent returns over the past year and they may well continue to do so.

Click here for the full report:
Retailers and the JSE Jan 2012 Monthly View

Retail spending: We told you so

Stats SA has confirmed the strength of retail sales volumes in December 2011. Strong intimations of this had been provided by cash in circulation and by the trading statements of the retailers themselves – and indeed by the share prices of the retailers themselves to which we have drawn attention.

Click here for the full report:
Retail spending we told you so 17 feb 2012

Interest rates: MPC stays in the hole it has dug for itself

(From 20 January 2012)
The Monetary Policy Committee (MPC) kept rates unchanged, as expected. We would suggest that this reveals a more dovish, growth sensitive tone with a further strong emphasis on the cost push nature of inflation (to which the Reserve Bank should not be expected to react).

Click here for the full report:
Interest rates MPC stays in the hole 20 Jan 2012