Equity markets and retirement: Back to the future

By Brian Kantor

It is retirement plans for the future that should concern us, not those of the past that have done so well in South Africa.

The weekend newspapers were full of exhortations for South Africans to save more than they appear inclined to do for a comfortable retirement. Personal Finance, in a caption (Weekend Argus 18 May 2013) reports: “You need to save more than you planned to do if you want to have a financially secure retirement, because of interest rates and investment market expectations.”

Given the decline in long term interest rates (and so expected market returns), it will take a larger capital sum to purchase a highly predictable flow of monthly annuity income from a life insurance company. Or, in other words, for any given life expectancy, a million rand of accumulated savings will now buy you significantly less monthly income from an annuity supplier than it would have 10 years ago, when long term interest rates and so expected returns were much higher than they now are.

The article in Personal Finance is accompanied by a figure describing the monthly “inflation-related” pension that could be purchased “by a 65 year old man with provision for spouses annuity and a 10 year guarantee” with R1m. The figure shows the contracted monthly pension as having declined from over R3 700 per month in December 2007 to about R3 000 per month today. A vanilla annuity without any inflation protection would provide about a fixed R60 000- R70 000 per annum for the same retiree.

Interest rates on an RSA bond with 10 years to maturity have declined markedly since 2002 from over 12% for a generic 10 year bond, to their current levels of about 6.3% while inflation linked real yields offered by the RSA government have declined even further, from 4.93% in early January 2002 to their current levels of about 0.6% (see below).

The expected return on a bond is its yield. The expected return on an (on average) risky equity is the bond yield plus an equity risk premium of an extra four or five per cent per annum. If realised returns approximate expected returns – a very large presumption – the lower the market interest rate and the lower the expected returns from bonds or equities, the more you will have to save to secure a given monthly income.

It is these largely certain income streams, a certain nominal 6.3% per annum or so from a 10 year RSA, or a real 0.6% (that is 0.6% plus actual inflation from an inflation-linked 10 year RSA), that form the basis on which a guaranteed annuity of either the inflation exposed or inflation protected variety will be offered by a life insurance company (the R36 000 or R70 000 annuity per annum referred to).

Realised and expected returns may however turn out to be very different. In the US for example, on 31 January 2002 very long dated US Treasury Bonds offered a yield of about 5.43%. Total annual returns from these long dated bonds, calculated each month end between January 2002 and April 2013, averaged approximately 8.75%. Total returns are the sum of interest yield, interest/capital values plus the annual change in the market value of the bond.

As long term interest rates in the US trended significantly lower over the period, long bond prices went proportionately higher, so providing unexpectedly good returns from US bond portfolios – on average 3.3% per annum above the expected returns of 5.43% offered by a 30 year US Treasury Bond on 31 January 2002. By contrast the average US equity investor realised well below expected returns. Equity returns would have been expected to realise about 9% a year in January 2002. Actual returns on the S&P 500, including dividends and capital gains and losses, averaged a mere 2.8% per annum. over the 11 year period. US inflation averaged 2.44% over the period, well ahead of short term interest rates that were an average 2%. Unexpectedly low inflation a brought down long term interest rates and pushed up bond prices to the advantage of bond holders. They did very little for equity investors who would have expected to have earned a premium return over bonds given their greater volatility.

Contributors to a reasonably well managed defined contribution SA pension fund since 2002, that would sensibly have included a good weighting in equities, have realised excellent real returns on their pension funds, than might have been reasonably expected early in 2002. The returns realised in the RSA bond and equity markets over the past 10 years have been well ahead of inflation.

And the actual inflation expected by bond and equity investors and implicit in long dated bond yields in 2002 proved to be greatly overestimated. The fact that interest rates fell over the period, so increasing the market value of any bonds held by a pension fund, added meaningfully to these bond market returns. Very long term interest rates in SA in January 2002 were 14.16%. They have more than halved since then. Actual returns on these bonds since then have averaged over 12% per annum. The return on the All Bond Index (with an average term to maturity of six years) was an average 10.13% per annum. The JSE, represented by the All Share Index, returned an average 15.5% a year while short term interest rates averaged about 8.6%. These returns were especially impressive when compared to inflation that averaged an unexpectedly low 5.9%. A balanced SA pension plan over these 11 years and four months was thus adding real purchasing power to savings at a most impressive rate – a most helpful outcome to those contributors to pension funds intending to retire today.

High real returns from the RSA bond market, combined presumably with excellent real returns from the share market, in which even a conservatively managed pension fund would have benefitted, plus good real returns from the money market, meant that the capital value of any SA pension fund should have grown rapidly enough since 2002 (after management fees) to overcome the reality of lower expected returns in 2013.

Some simulation exercises can help make the point about just how well the current cohort of those facing retirement today have been served by the exceptionally good returns provided by the SA capital markets since 2002.

For example, consider an intended retiree of 65 years today, who had a defined contribution balance of R5m in 2002 and earned a salary then of R500 000. Let us say that his salary grew at 8% a year over the period and he continued to contribute 10% of his growing salary to his pension plan. If the pension plan had a modest 50% weight in equities, 40% in bonds and 10% in cash based on realised returns since 2002, his nest egg would have grown to over R22m by April 2013. Had he not added to his savings, his wealth would have mounted to about R20m. His salary by 2013 would have grown to over R1.1m and his R22m would have bought him an inflation protected retirement income of about R792 000 a year. If he were prepared to take on inflation risk he might be able to secure an annual constant nominal income of about R1.5m for as long as he lived. His post retirement income would thus seem to bear a highly satisfactory relationship to his pre retirement income. It would not make a great deal of difference to these outcomes if part of his 2002 nest egg of R5m was in the form of equity in his own home. The return on homes in the form of implicit rental yield plus capital gains (especially until 2008) would have compared well with alternative investments.

What about the future?

It is therefore not so much the savers of the past that we should be worrying about, but the savers of the future who now have to face lower expected real returns in the market place. Their ability to build up an adequate store of purchasing power for old age is being compromised by low expected real returns. These low expected returns may well turn out to be low realised real returns, in which case a higher rate of real savings is urgently called for by all those intending to retire in 10 or more years.

The danger to investors in long dated fixed interest securities is unexpectedly higher, not unexpectedly lower interest rates. It is not lower nominal interest rates but higher rates that make it more difficult to build savings for the future, as we have shown. Lower inflation can compensate fully for lower nominal interest rates when a fixed annuity is purchased.

Lower expected real returns, all other things equal, demand a higher rate of real savings to sustain a desired rate of post retirement real purchasing power. A higher rate of real saving can be expressed as a larger percentage of nominal income contracted to a pension or retirement savings scheme. But the danger to current savers is that these real and nominal interest rates will rise over time, reducing the value of any bond portfolio. This is the opposite of the benign winds of lower interest rates that have blown over capital markets over the past 20 years.

It should therefore be appreciated that the current level of real interest rates expressed explicitly as the real return on long dated inflation linkers issued by governments is exceptionally low. Real interest rates close to zero are well below long term averages that have been of the order of two or three per cent. In normal times real interest rates can surely be expected to regress back to long term averages. If they do, does it make sense for those retiring today to commit their capital permanently to such low returns? Furthermore, those planning to retire in the next 10 or 20 years might well judge it appropriate to accept more risk in their retirement portfolios – that is the risk that real interest rates will rise as the economy grows and so the demand to invest more capital in real assets raises the competition for savings. Proportionately more equity (that promises higher returns in exchange for more risk) seems to us to be a sensible response to what may be a short lived world of very low interest rates.

Listed JSE property continues to surprise. Can it continue do so?

Exceptional returns all over again.

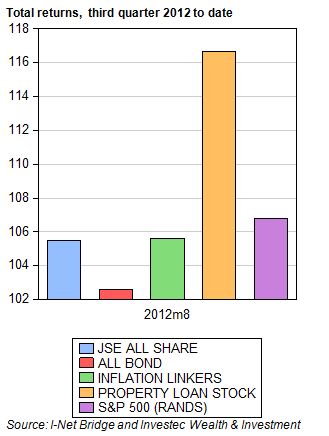
Property stocks listed on the JSE have again confounded the market place. From the beginning of the year to 8 May 2013, the Property Loan Stock (PLS) Index returned nearly 20% compared to 5% from the All Bond Index and 4% from the JSE All Share Index.

Since 30 April 2012 the returns provided by the PLS Index in capital appreciation and dividends have been even more spectacular. The PLS Index returned over 47%, over a period when the All Share and All Bond Indexes also provided still very good total returns of 21% and 18% respectively. Between January 2000 and May 2013 The PLS Index provided average annual returns, calculated monthly, of 23.4%, compared to an average 15.5% for the All Share Index, 11.9% average from the All Bond Index and about 8.8% average returns from the money market. Annual inflation averaged about 5.8% over the period.

What has the market missed when valuing JSE listed property? Interest rates and / or property fundamentals?

The extra value attached to listed property could have come from unexpectedly good rental income and / or unexpected declines in the rates at which those rental flows are discounted. Listed property valuations have very clearly had the benefit of unexpected declines in interest rates. Less obvious may have been unexpectedly good or perhaps also unexpectedly consistent growth in rental incomes after costs. Expected dividends are not made explcit like interest rates and interest rate expectations. At best they can only be inferred from market movements themselves.

In the figure below we show how the dividends distributed by the companies represented in the PLS Index, weighted by company size, have grown over the years. Over the extended period the dividends paid have fully kept up with the Consumer Price Index (CPI). Having lagged behind the CPI between 2002 and 2004, the PLS Index’s dividends per share had caught up with inflation by 2006. Since then they have matched inflation almost perfectly. Such consistent growth in distributions, despite the global financial crisis of 2008 that had a particularly severe impact on listed property elsewhere, might well have taken investors by surprise and justified something of a rerating for the sector. However no such re-rating has occurred.

The benefits of lower interest rates for property valuations

The value of JSE listed property companies has been very clearly assisted by unexpected declines in SA interest rates. As interest rates come down, property companies benefit in two ways. Firstly, their bottom lines benefit from less interest expensed. Secondly, the discount or capitalisation rate attached to expected rental income goes down and values go up with lower interest rates.

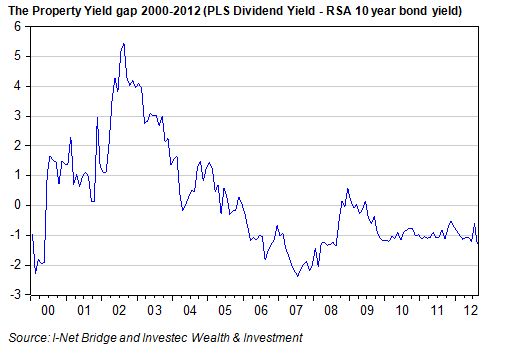
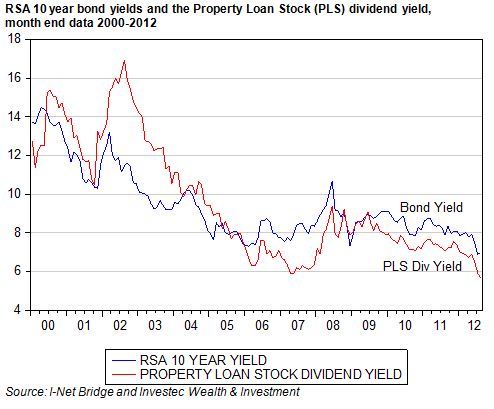
As we show in the figure below, long term interest rates and the PLS dividend yield have declined in more or less lock step. We also show the difference between long RSA bond yields and the initial PLS dividend yield. This yield spread represents the rating of the PLS. A widening spread indicates less market approval (a de-rating) and a narrowing spread indicates a more favourable rating (a re-rating). This spread widened to the disadvantage of the property sector in 2002-03. It then narrowed significantly from a +5% spread to a -2% by 2007. Thereafter the spread widened as interest rates rose in 2008 and narrowed again in 2009. This risk spread has remained highly stable since then.

It may be concluded therefore that the sector has not improved its rating relative to long term bonds since 2009. The improved property returns since then can be attributed to interest rate movements rather than to any sense of improved property market fundamentals.

Given that PLS dividends have kept pace with inflation (and may be expected to maintain this pace), the PLS dividend yield could then be regarded as a real inflation protected yield. Thus a comparison can be made with the real, fully inflation protected yield offered by RSA inflation linkers. The yield on the R197, an inflation-linked 10 year bond, has fallen dramatically over the past 12 months. Yet the spread between the PLS dividend yield and the inflation-linked R197 has remained largely unchanged as may be seen in the figure below. This “real” spread, the extra rewards for holding listed property, has not declined in recent years. This provides further proof that higher PLS values have been driven by interest rates rather than improved sentiment. No re-rating of the PLS sector has taken place according to these metrics.

Making the case for the PLS sector at current levels and yields.

The listed property sector is highly sensitive to interest rate movements. We calculate that for every 1% move in the All Bond Index, the PLS Index can be expected to move in the order of 1.5%. We have shown that the major force acting on the PLS Index in recent years have been lower interest rates. As we have indicated, there is little sign in the market place that expectations of the property sector have become more demanding. It is lower interest rates rather than faster growth in expected rental income (and the dividends associated with better underlying economic performance) that have driven the PLS Index higher.

What then are the required returns that will drive property valuations and development activity in SA over the long run? Our sense is that that the normal risk premium for a well diversified, listed and well traded SA property portfolio should be of the order of extra 2-3% per annum over long term interest rates on RSA bonds.

If that is the case, the expected risk-adjusted return on listed property would now be of the order of 9-10% per annum, that is about 3% above the current 10 year RSA bond yield of 6.13%. The current PLS Index dividend yield is 5.2%. Expected inflation implicit in the RSA bond market is 5.56% – being the difference in the nominal yield on a generic RSA 10 year bond of 6.13% and the equivalently dated inflation-linked RSA197 that currently yields 0.57%.

Adding inflation equaling growth in PLS dividends of 5.57% to the initial PLS dividend yield of 5.2% gives us an expected return of 10.77% per annum, or a PLS risk premium of 4.64% per annum. This is a risk premium significantly higher than our estimate of a required risk premium of 2-3%. It suggests that if we are right about a normal risk premium there is still some upside for the PLS Index at current interest rates.

Subtracting the RSA inflation linked yield of 0.6% from the 5% PLS dividend yield gives us real risk premium of the same magnitude, of about 4% plus. Again this seems too generous a reward for the risks in well diversified real estate.

The fundamental case for investing in JSE listed property today is that the current risk premiums available in the market place are larger than necessary for attracting funds to the sector. Yet it should be appreciated that regardless of the long term case for investing in JSE listed real estate (that may or may not prove compelling), the short term movements in the PLS Index will be dominated by movements in interest rates. In the short, if not the long run, the property sector remains a play on the direction of interest rates, regardless of the investment fundamentals. Brian Kantor

Bond markets: Fair winds from Tokyo for the bond market

Last week was a poor week for equities. JSE listed equities underperformed their emerging market peers and the rand also weakened in sympathy (see below). The trade weighted rand lost about three per cent by the end of the week.

Somewhat surprisingly – given rand weakness that ordinarily implies more inflation to come – the market in rand denominated fixed interest securities, across the yield curve, had a very strong week. The forward rate agreements offered by the banks moved sharply lower (and bond prices higher) implying, in the market’s view, that there was no chance of an increase in the repo rate over the next 18 months.


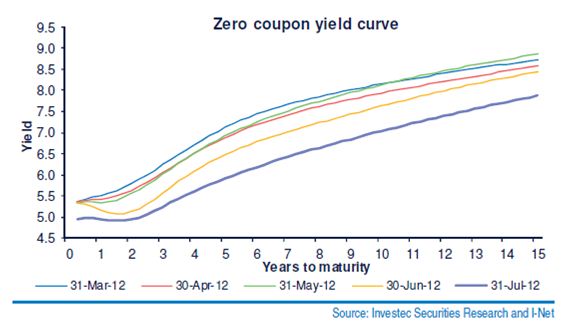
The yield curve represented by the zero coupon bonds also moved sharply lower beyond six years’ duration – by over 40 basis points. The implication of this move is that the RSA one year interest rate, while still expected to move higher over the years, is now only expected to breach the 7% level in 2020.

Consistently with these moves lower (in actual and expected interest rates), inflation expectations have declined. These expectations are implicit in the difference between vanilla RSA bonds that are exposed to the risks of higher inflation and the inflation linkers that are fully protected against inflation. This measure ofinflation expected, or more literally compensation for bearing inflation risk, is given much attention by the Reserve Bank. The argument is that inflation expected causes inflation itself, for which incidentally there is little evidence. The feedback loop is from higher inflation to more inflation expected, not the other way around. This measure of inflation expected has remained stubbornly and very consistently above 6% for much of the past few years. That it declined last week will be welcome news to the Reserve Bank and provides further strength to the argument being reflected in the money market that the next move in the repo rate is down rather than up.

The one consolation in the weaker rand is that it is being accompanied by consistent weakness in commodity prices. Generally a trend from which precious and other metals as well as oil have not escaped, so implying less inflationary pressure.

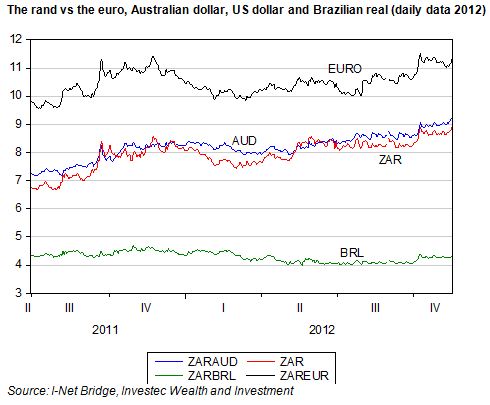
It is the weakness in commodity and metal prices and in emerging equity markets that have weighed on the rand and other emerging and commodity currencies. As we show below, the rand has made some small gains against the Aussie dollar and the Brazilian real since early March, though it did weaken marginally last week.

For global bonds, including the RSA bonds, the commitment to extraordinary money supply growth in Japan and the intention to weaken the yen, brings about the so-called yen carry trade. The difference between interest rates in Japan and almost everywhere else is thus a primary reason for downward pressure on global interest rates. Borrowing in yen and buying rand denominated securities was a poor trade in the first week of April, but a much better one over the past two weeks, notwithstanding the weaker rand against most currencies last week, the yen excepted. Brian Kantor

Equity markets: The stock market always has a message for us – reading the market signs

Published in Investec Wealth and Investment Private View Quarter 2 2013

There is perhaps only one observation one might make with great confidence about the value of a firm: that over the long run its market value will be aligned to its economic performance. The better the realised performance, the more valuable the firm or a share in it will be.

In the long run economic fundamentals account for share values

There is perhaps only one observation one might make with great confidence about the value of a firm: that over the long run its market value will be aligned to its economic performance. The better the realised performance, the more valuable the firm or a share in it will be.

The problem for the analyst or investor is that the market is always attempting to value the expected rather than the realised performance of a company. These expectations can change from day to day, while it is only over the very long run that performance and its valuation will converge in an understandable way. The market does however provide consistent clues about the expectations implicit in market valuations. These clues then allow the investor to make judgments about the realism of these expectations of performance. They may be judged too optimistic (therefore providing reasons to lighten exposure to the market) or too pessimistic (making a case for increasing exposure to equities, that is for taking on more risk).

A firm’s economic performance might be calculated using a variety of metrics: accounting earnings per share (after interest and taxes paid) would be the most obvious measure of performance; dividends per share or operating profits might serve better as a measure of business success or the lack of it; so might cash flow – so called EBITDA (earnings before interest, taxes, depreciation and amortisation) – be preferred as a measure of the economic performance of a company; free cash flow (that is cash flow after investment activity) might indicate how well the company is doing.

These performance measures might best be normalised to exclude extraordinary temporary additions to or subtractions from bottom line accounting earnings. This would give rise to the so called headline earnings reported by JSE listed companies or even normalised headline earnings reported by some companies. The deepest insights into how well a company is performing are most likely to be found in measuring the cash flow return on capital (the return on the cash invested by the firm, suitably adjusted for inflation).

When we aggregate the performance of all the firms that make up a stock market, we find that all of these different measures of performance prove to be highly correlated. They will all tell a very similar story about how well the firms that make up the stock market have done over time.

Expected rather than past performance accounts for the short run behaviour of the market place

The problem for the investor is that while realised performance will be decisive in determining the value of a company over the long run, the market place does not sit by patiently waiting for economic performance to unfold. The day to day value of a company or the share market is determined by expected rather than past performance. And as investment advisors are constantly obliged to remind their clients, past performance is not necessarily a guide to future performance – even though it may be the only useful guide available.

Future economic performance implicit in current market values can as easily be overestimated as underestimated. If such estimates are proven (by subsequent events) to have been too optimistic, market values will tend to fall into line with disappointing economic outcomes. If the estimates of performance are too pessimistic then share prices will tend to rise and thus fall into line with the unexpectedly good economic outcomes.

Prices fall in line with performance – or performance catches up with prices

In any longer run view of the relationship between values and performance, either prices will fall into line with disappointing performance or unexpectedly good performance will drive prices higher. In the long run prices and performance will track each other.

The environment also matters – as reflected in the discount rate applied to future performance

There is a related issue when the value of a firm or a market has to be determined. This is the rate of discount which should be applied to expected performance, measured as a flow of earnings, dividends or free cash flow over time. Clearly future expected benefits from the ownership of an asset or firm are less valuable than current benefits gained from owning any asset or a share. Any market value can be logically regarded as being the result of a present value calculation. A similar calculation will be made by any firm contemplating capital expenditure. Future expected benefits have to be discounted to derive their present value.

This discount rate wlll be very much influenced by interest rates prevailing in the market place. Investing in a share is an alternative to investing in cash or short or long dated government bonds paying a fixed rate of interest with a certain money value. When investing in the shares or the debt of companies, a risk premium will be added to these interest rates to compensate for risk of default or failure.

But it is not only the risk to the firm that will be taken into account when values are estimated. It is the risks posed by government to the economic outcomes for firms and share owners that will be reflected in interest rates offered by government borrowers. For example the risks of higher or lower inflation will be revealed in these minimal interest rates, as will risks that government will tax interest income more heavily or will come to rely more heavily on debt than tax revenues to fund additional expenditure.

Furthermore interest rates will also rise or fall in response to a real shortage of savings. If the demand for savings or capital strengthens, from firms and the government itself, then real, after (expected) inflation interest rates will rise and vice versa. The greater the competition for capital, the higher will be real interest rates, and so the less valuable will be the present value of an asset as benefits are discounted at a higher rate.

Good news and bad news reasons for higher discount rates

This lower present value would occur with higher interest rates (all other things remaining equal). In this case the expected performance of the companies would have to be expected to remain unchanged in the face of higher interest rates. Often however the competition for capital will be most intense when companies are doing well and expect to do well.

These conditions would provide good news reasons for higher interest rates and could lead to higher values, despite higher costs of capital. The bad news reason for higher interest rates is when governments are thought more likely to misbehave by adopting less encouraging economic policies for the firms that make up the economy. Bad news about government policy or about the performance of a firm inevitably translates into higher interest rates and hence less valuable companies. Good news about improving government policies and or better managed firms usually means the opposite.

We may not be able to predict share prices in the short run, but we can know when the market place is optimistic or pessimistic about the economic future.

However accurately predicting the day to day moves in share prices is very difficult because expectations can change significantly as information, the news and its interpretation, percolate through the market place moving market values in a largely random way. Yet it is possible to observe when the market is more or less optimistic about the future. The best that the informed investor can hope to do is to use market values to infer how optimistic or pessimistic the market currently is about the prospects and to agree with or take issue with the prevailing sentiment. We undertake such an exercise for the value of the key share market index, the S&P 500 (representing the largest 500 companies shares listed on the New York and Nasdaq stock exchanges).

In the figure below we show the results of a simple regression equation which explains the value of the S&P 500 with reported dividends and long term US Treasury Bond Yields. This is equivalent to a present value calculation, with long term US government interest rates used as the discount rate.

As may be seen from the figure below, the explanatory power of this model is very good with actual and predicted values closely aligned in general. The goodness of fit of the model, measured by its R squared, is of the order of 95%. Thus the model may be regarded as providing a very good long term explanation of the value of the S&P 500. The S&P 500 over the long run is well explained by reported dividends and long term interest rates.

It should also be noticed that the fit was generally even closer before 2000 than since then, given the influence of the dotcom/tech bubble in the early 2000s and the Global Financial Crisis late in the decade.

The most striking conclusion to be drawn from this exercise is that the S&P 500 at the March 2013 month end, despite its recent strong gains, is still deeply undervalued by its own standards: in percentage terms about 40% below its predicted value. If the past were the guide to current performance, then the S&P 500 (given current dividends and interest rates) would have a predicted value of 2440 rather than the current (still record) level of 1560. In other words, it may be concluded that the market currently remains about as pessimistic about earnings and dividend prospects as it was at the height of the financial crisis in 2009. The same model estimated in May 2009 indicates that the market was then undervalued by 47%. As the chart shows, the S&P 500 recovered very strongly from these depressed 2009 levels over the next 24 months as prices caught up with the improved fundamentals of rising dividends and low interest rates. The same model, when estimated at the height of the stock market boom in May 2000, indicated that the market was then as much as 55% overvalued. Those times were times of extreme optimism about the prospects for listed US companies, an optimism that was not at all borne out by subsequent performance of earnings or dividends per share.

The S&P 500 Index: Actual and predicted values

Source: I-Net Bridge, Investec Wealth & Investment

We use easily calculated dividends per share rather than earnings per share as the measure of shareholder benefits. This is because S&P 500 earnings per share collapsed so precipitously during the Global Financial Crisis of 2009 as financial corporations had to write off their many bad loans. Dividends and operating profits held up much better over this period, as we show below, and therefore provide a much better reflection of the economic performance of the companies valued between 2008 and 2013. Both series have recovered very strongly and are close to or above their pre crisis levels.

S&P 500 Earnings and dividends per share in US cents (log scale)

Source: I-Net Bridge, Investec Wealth & Investment

It may therefore be concluded that if the past is anything to go by, the S&P 500 continues to offer value. By the standards of the past the market is very undervalued for current dividends and interest rates. Pessimism, rather than optimism about economic prospects for the S&P 500, appears to dominate sentiment. The potential investor in the market can make his or her own judgments about whether such essential pessimism is still justified.

It should be appreciated that, by these measures, the market can remain undervalued for an extended period of time. It is also possible that earnings and dividends may collapse to justify such pessimism. Interest rates in the US may also rise for bad news reasons, such as less faith in the US government. They may also rise for good news reasons because US firms become more willing to undertake capital expenditure and compete, pushing up interest rates accordingly. If so, the US economy and the global economy, as well as earnings and dividends that flow from the economy, are unlikely to disappoint. Stock market valuations would then play further catch up through realised performance.

It may be of some comfort to those with a bias in favour of buying and holding shares for the long term to know that by its own standards, that is relative to past performance and current interest rates, the US equity market remains deeply undervalued despite the recent gains made.

 Brian Kantor

From Tokyo to Johannesburg – a move in interest rates and the rand

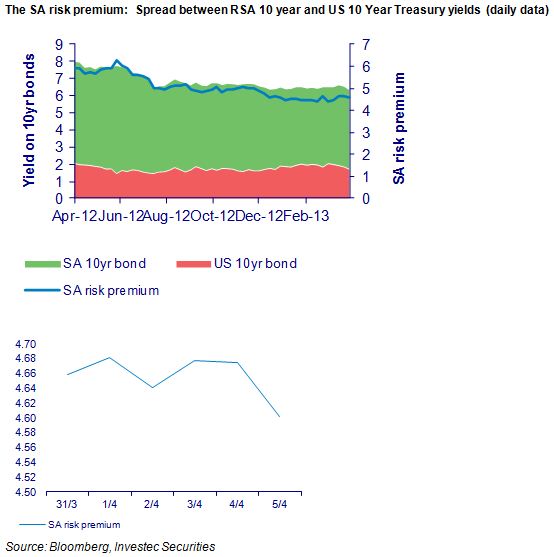
There were some interesting developments on the SA interest rate front late last week. Long term rates in SA declined by more than they did in the US. Thus the spread between the rand yields on long dated RSAs over US Treasury Bonds narrowed.

This spread is equivalent to the rate at which the rand is expected to depreciate against the US dollar over the next 10 years or so. It is notable that as the rand weakened over the past 12 months the spread actually narrowed, indicating less (rather than more) rand weakness to come in the years ahead. This spread, which we describe as the SA risk premium, was over 6% this time last year; last week it had fallen to 4.58% (see below).

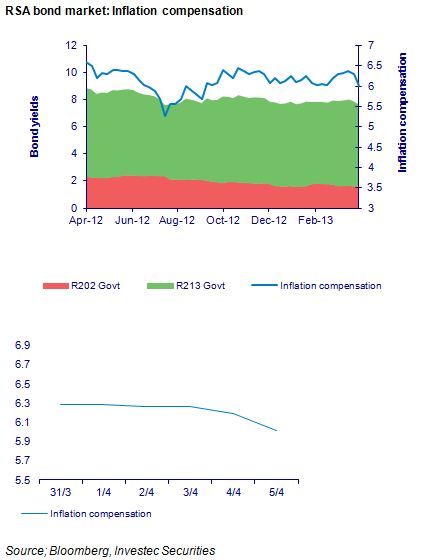
The gap between long dated vanilla RSA bonds and their inflation linked equivalents remains stubbornly around the 6% plus range, though this compensation for bearing inflation risk (implicit in long dated fixed interest) also narrowed marginally.


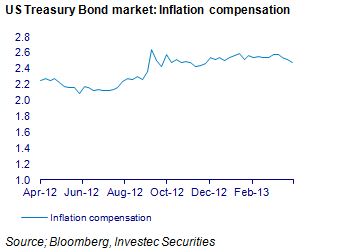
Inflation expected in the US, calculated similarly as the difference in yields on vanilla bonds and inflation linkers of similar duration, is of the order of 2.5%. This spread has widened marginally over the past 12 months (see below).


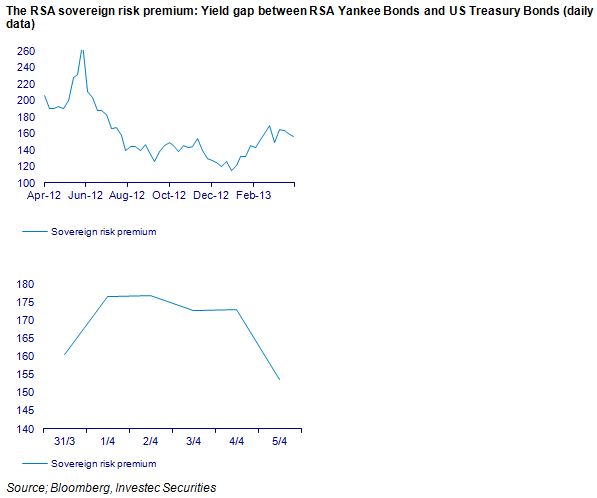
The spread between RSA US dollar-denominated (Yankee) bonds and US Treasuries also narrowed last week to about 150bps. The spread was below 120bps in December 2012.


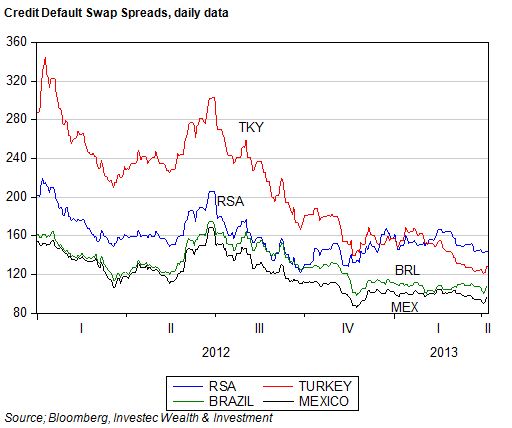
RSA US dollar bonds have not performed as well as most of their emerging market peers over the past 12 months. Turkey now enjoys a superior credit rating to SA. Mexican and Brazilian bonds have been in particular favour with global investors as we show below.

A fair wind from Japan


The force dominating developments on the global interest rate front last week was the carry trade in the yen. Despite the markedly weaker yen – in response to aggressive money creation in Japan – interest rates in Japan remain below yields everywhere else. Thus borrowing yen to buy higher yielding securities everywhere else, including in SA, must have seemed like a good idea late last week. It has certainly proved to have been a good trade this week and may well be judged to offer further advantages in the weeks ahead. The rand and bond yields in SA will benefit from any such further yen carry trade – as should the interest rate plays on the JSE. Brian Kantor

Equity markets: Drawing the investment lessons of the past year and the past decade

Investors on the JSE enjoyed outstandingly good returns in 2012 of about 26%, and have also done well over the past decade. We examine the factors behind this performance and what could wait in store in 2013.

Another outstanding year on the JSE

Investors on the JSE enjoyed outstandingly good returns in 2012 of about 26%. These returns concluded a decade of outstanding performance. Average returns on the JSE over the past 10 years have more than compensated for equity risks, as we show below. An extra four or five per cent a year from equities would have been good enough. The JSE provided much more than this.

A wonderful decade for investors on the JSE and other emerging markets

Over the past 10 years (1 January 2003- 31 December 2012) annual returns on the JSE (calculated each month) averaged 18.4% p.a. The SA All Bond Index (ALBI) returned an average 9.2% p.a and the money market, represented by the three month interbank lending rate (JIBAR) returned an average 7.87% p. a. before any fees. Since inflation averaged 5.5% over the same period, real returns from all the asset classes were satisfactory but not nearly as good as those provided by the equity market.

These returns were also excellent when translated into US dollars. In US dollar terms the JSE returned 16.4% p.a on average over the last 10 years, very much in line with the equally outstanding returns realised by the average emerging market – represented by the MSCI EM Index – that provided average returns in US dollars of 16.5% p.a. over the 10 year period.  The S&P 500 Index realised only 5.8% p.a on average over the same period.  It should  be appreciated that the 10 years includes the very severe impact on share markets of the Global Financial Crisis of 2008- 09; when at its worst in February 2009, the JSE was 49% lower than a year before and 80% lower in US dollars. That same month the S&P 500 was 59% down on February 2008, while the EM Index was 87% lower.

Total returns: US$100 invested on 1 January 2003, with dividends reinvested (2003=2012)

Source: I-Net Bridge, Investec Wealth & Investment

The winner was JSE Industrials, not Resources

Investors on the JSE in 2012 would have done especially well had they concentrated their portfolios on Industrial rather than Resource companies. The JSE Industrial Index returned over 44% in 2012 while the Resource Index provided a total return of less than 3%. (See below)

JSE total returns in 2012


Source: I-Net Bridge, Investec Wealth & Investment

The game changer on the JSE: Industrials or Resources?

Such outperformance by JSE Industrials over Resources is by no means an unusual event. It should be clear that for active fund managers anticipating these differences in returns is the key to beating the market as a whole, so adding value for their clients after fees.

Difference in annual returns: JSE Industrials vs JSE Resources (2003- 2012)


Source: I-Net Bridge, Investec Wealth & Investment

JSE Industrials have provided far superior returns than the average Resource company (for significantly less risk) over the past 10 years. As we show below, R100 invested in the Industrial Index on 1 January 2003, with dividends reinvested, would have accumulated an impressive value of over R900 by the end of 2012. The same R100 invested in the Resources Index would have yielded less than R400.

Cumulative returns on the JSE: Industrials vs Financials vs Resources. Value of R100 invested on 1 January 2003


Source: I-Net Bridge, Investec Wealth & Investment

The outstanding performance of the JSE Industrial Index (a market capitalisation weighted index) is fully explained by the economic performance of the companies included in the index. Rising share values have been lifted by a rising tide of reported earnings and dividends. Both the value of the Industrial Index and the dividends distributed have increased by 7 times since 2003. The payout ratio of earnings to dividends has declined from 3.2 times dividends in 2003 to 2.1 times in December 2012.  

If the past were to be the guide to future action it can be expected that the weight given to Resources in the representative SA portfolio will decline and that given to Industrials will increase. That Resources have a large weight on the JSE All Share Index does not justify anything like the same weight in SA portfolios on a risk adjusted basis. We should expect SA investors to reduce their exposure to resource companies to something like the international norm – which would be about a 10% weighting.

The JSE Industrial Index, dividends and earnings per share (January 2003=100)

Source: I-Net Bridge, Investec Wealth & Investment

Not all Industrial companies on the JSE are alike in their exposure to the SA and global economies

The Industrial Index of the JSE however combines companies with very different exposures to the SA and global economies. Dominating the Index by market value are companies that we describe as Industrial Hedges. These are companies that are heavily dependent for their sales, costs and profits on the global economy rather than the SA economy. Richemont (CFR) is a very good example. Its luxury goods are all produced outside SA and very few of them are sold in SA. SABMiller (SAB) is a global rather than a SA brewer. Aspen (APN) in pharmaceuticals, MTN in mobile networks and Naspers (NPN) in internet, have joined the ranks of the companies with much more at stake outside rather than inside the SA economy. British American Tobacco (BTI), now the largest company listed on the JSE, is another large Industrial Hedge, ie little affected by SA interest rates or the state of the SA economy. Their rand values furthermore will tend to go up and down in line with movements in the exchange value of the rand.

These Industrial Hedges are to be usefully contrasted with the SA economy plays – the retailers, banks, property and logistics companies listed on the JSE whose top and bottom lines react to the SA economy. Their share market performance is SA interest rate sensitive and a strong rand, low inflation and low interest rates are very helpful to their sales volumes and operating margins. A weak rand and the higher inflation and interest rates that may follow a weaker rand will damage their ability to earn profits and grow dividends.

In 2012 these two categories of large industrial companies performed very similarly on both the earnings and valuation fronts as we demonstrate in the chart below. We have created Indexes for these different groups of JSE companies, have measured Index earnings per share and have compared them to each other and to the Resource Companies  (excluding the gold mining stocks), which we call commodity price plays. As may be seen the Industrials gained ground on the commodity price plays in 2012 on the basis of much stronger and more consistent growth in earnings and (not shown here) in dividends.

Industrial Hedges vs SA Plays vs Commodity Price Plays; total returns (1 January 2012 – 31 December 2012)


Source: I-Net Bridge, Investec Securities, Investec Wealth & Investment

Index earnings per share: Industrial hedges vs SA Plays vs Commodity Price Plays (1 January 2012=100)


Source: I-Net Bridge, Investec Securities, Investec Wealth & Investment

The surprisingly good performance of the SA plays in 2012

The surprising feature of 2012 is that while the Resources companies felt the cold draft of a weaker global economy and lower commodity prices, the Industrials continued to grow their earnings despite slow growth. Furthermore the economic performance of the SA economy plays was compromised by the weaker rand that put pressure on imported input costs and pricing power. Yet the SA plays were greatly assisted by low and stable interest rates. The weaker rand and the higher rate of inflation did not lead to higher interest rates, as might have been expected. The SA Reserve Bank in its interest rate settings and commentary helpfully (and correctly in our view) adopted a dual mandate – a concern for growth as well as inflation. It can be expected to continue to influence the economy in this way.

There was no demand side pressure on prices, as the Bank pointed out, and given the weak global economy and the impact this was having on export prices and volumes – harmed additionally by strike action in SA – domestic demand needed encouragement in the form of lower interest rates (and received it). Longer term interest rates also moved lower –despite more inflation – helped by a global search for yield that was found in the SA bond market.

Explaining the performance of the rand in 2012 and beyond

The weaker rand since year end will have been helpful to the value of the Industrial Hedges and perhaps more helpful to the commodity price plays – provided they can maintain or increase output in the face of Industrial action. A weaker rand is not helpful to the SA economy plays. Yet the danger posed to these companies and the service sector of the SA economy in the form of higher interest rates still seems highly remote.

The rand has demonstrated much SA specific weakness linked to the Industrial action and the threat poor labour relations poses to the SA economy and its growth prospects. The rand is about 15% weaker than it would have been if, as before, emerging market risks and market developments had continued to dominate its exchange value. Such forces, including the appetite for emerging market equities and bonds, will continue to influence the rand from day to day and month to month. But strength in the rand will depend also on perceptions of SA economic policy strengths and weaknesses. Any sense that the SA government is making progress on the labour relations front (not an entirely unrealistic proposition) will be helpful to the rand at its current much weaker levels. 

Rotation by SA Fund Managers between Industrials and Resources will not matter very much to the outcomes on the JSE

It should be appreciated however that these outcomes, in the form of relative performance by the different sectors of the JSE will not be decided by SA fund managers “rotating” the weight of their portfolios between Industrials and Resources. All the major companies listed on the JSE, be they Industrial or even more obviously Resource companies have one important thing very much in common. They are all well in the sights of global investors who can hold large proportions of the shares issued by JSE listed companies.

These decisive offshore investors do not compare the relative merits of JSE listed Industrials or Resource companies. They compare JSE listed companies – companies often also listed on other stock markets – with their peers be they retailers or banks or iron ore or gold producers.  The JSE listed companies have proved very competitive over the past 10 years in the flow of earnings and dividends they have delivered and are expected to deliver. Hence the fact that the JSE Indexes in US dollar compare very favourably with other emerging markets. Fair rather than foul winds blowing across the global as well as the SA economy would make it easier for the JSE listed cohort to compete for the attention of global investors.

Drawing the conclusions for asset allocations in 2013

There is good reason for us to believe that global equities will continue to offer good value despite their strength in 2012 and despite further strong advances made in early 2013. However, a repeat of the excellent JSE returns realised in 2012 must be regarded as unlikely.

The more conspicuous equity value opportunity appears in the developed equity markets that have lagged behind the emerging markets over the past 10 years as investors moved large flows of cash out of equities into bonds and cash. When trailing dividends or earnings on the S&P 500, at record levels, are discounted by very low long dated US Treasury yields, the S&P 500 appears to be deeply undervalued. Should the S&P 500 move strongly ahead this would provide strong support for other equity markets. Clearly these S&P valuations would be threatened by any sharp reduction in earnings or an increase in 10 year Treasury Bond yields to something like normal levels of around 4% p.a. from their current less than 2% p.a.

It would however take a strong recovery in the US economy to lift interest rates. And such a recovery would mean further growth in earnings and dividends. The asset class most vulnerable to any strong recovery in the global economy is developed economy bonds. A mixture of faster growth and higher inflation that would raise bond yields would do great damage to the market value of long dated government bonds that are now priced at such elevated levels. The holders of developed economy government bonds, Treasury bonds, bunds, gilts or Japanese bonds could best hope for a further extended period of global economic weakness. Even then long term interest rates would be unlikely to decline further and as in 2012 the appeal of dividend yields above short and long term interest rates would help support equity markets.

Given the danger to holders of government bonds of rising long term interest rates and the opportunity in what we regard as very conservatively valued equities, which provide protection against inflation. Equities become especially attractive when inflation comes with faster growth (as it may well do next time round). We accordingly continue to recommend equities in general over long dated fixed interest.

When it comes to fixed income we would prefer the protection of higher yields offered by high yield corporate credit or emerging market government debt. A narrowing of risk spreads, given any sustained economic recovery, could compensate in part for higher benchmark bond yields.  But if safety is to be sought,  then we would prefer short dated debt – even cash to long dated fixed interest ordinarily defined as safe havens.

These are anything but ordinary times in financial markets that have been made flush with cash issued by central banks in order to save their banking systems. When the banks prefer to lend some of their excess cash reserves, as they appear to be doing in the US – where bank lending and balance sheets are now growing at about a healthy 10% p. a rate – economic growth and more inflation is likely to follow.

The case for global equities seems to us to be improving. When the choice turns to South African equities the Industrial Hedges, exposed as they are to the global economy and protected against rand weakness, offer the prospect of decent returns with less risk than either the commodity plays or the SA plays. The case for the SA plays over the Industrial Hedges depends on a recovery in the rand from its current depressed levels.

The benefits the commodity plays will gain from a global recovery and higher commodity prices could be augmented by any rand weakness associated with SA specific risks. When revenues are priced in US dollars and costs are incurred in rands, operating margins for SA mining operations can widen to their advantage. However any SA specific risks are likely to be linked to labour troubles on the mines, which would be expected to disrupt operations. These expectations would reduce the appeal of the Resources companies with significant operations in South Africa ,even  if the rand weakens. Best for SA mines would be a degree of rand strength, associated with less global risk aversion and higher commodity prices as well as progress in labour relations on the mines.

The performance of the rand will be particularly important in 2013 for relative performance on the JSE. For rand strength we would prefer the SA plays and for rand weakness the Industrial Hedges. The commodity price plays, while undoubtedly offering value, given a cyclical recovery in their earnings, will need a degree of rand strength for SA as well as global reasons to make a strong case for investors. And so – if there is a recovery in the rand – the SA plays might again offer superior returns over Resources in 2013.

Rand weakness for both global and SA reasons would clearly favour the Industrial Hedges over both the SA Plays and the commodity price plays.  Our own inclination is to favour a modest degree of rand strength coupled with a sense that the global economy will remain on the recovery path. Given such circumstances it is difficult to strongly favour any one class of equities over the other. A generally favourable global environment for equities in 2013 will reward good stock picking. The search for companies and their management with excellent long term prospects may prove especially rewarding.

A strange moment for the rand

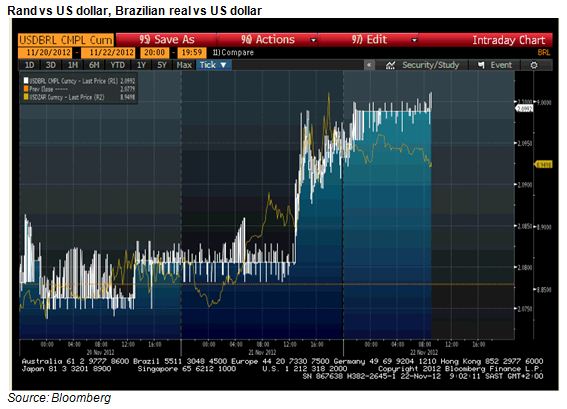
The mystery of the strange behaviour of the rand yesterday (Wednesday) has been solved. Sudden rand weakness had nothing to do with South African events: it weakened suddenly around 11h30 in complete sympathy with a simultaneous decline in the exchange value of the Brazilian real.

As may be seen in the chart below, both currencies weakened significantly at about this time. Hence the rand weakness can be described as a response to emerging market rather than SA specific risk. To deepen the mystery further however, other emerging market currencies, such as the Turkish Lira and the Mexican peso, did not react in anything like the same way. The mystery therefore is to recognise those forces that simultaneously weakened the Brazilian and SA currencies. As for now, this remains something of an unsolved mystery.

The JSE moreover did not react to rand weakness, as might ordinarily have been expected. Retailers, who are particularly vulnerable to rand weakness and the higher import prices that come with it, held up very well and the rand hedges – both of the Industrial and Resource kind – did not outperform.

What Brazil and SA have in common are iron ore exports to China. There was a conference call yesterday organised by one of the institutional brokers on the proposed reduction in Chinese domestic iron ore tax, where it was stated that a more favourable tax treatment of domestic iron ore producers might well reduce the Chinese demand for iron ore imports.

This episode in the currency markets perhaps illustrates once more how important China is to the outlook for commodity prices. Yesterday was not at all a bad day for commodity prices. Iron ore fines were quoted at prices only marginally ahead of the day before and nearly 8% higher, year to date, while the CRB Commodity Price Index was unchanged on the day. Brian Kantor

Striking the rand

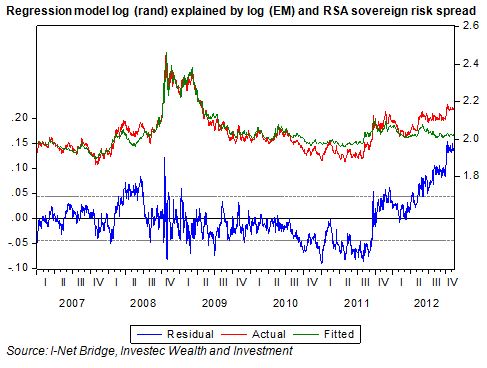
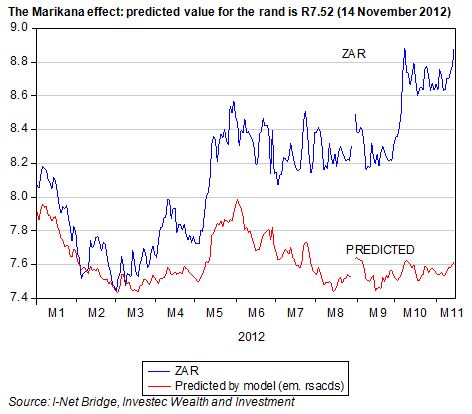
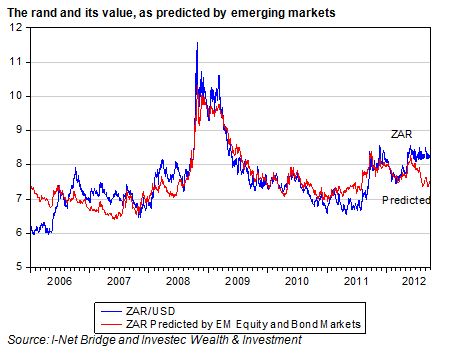
The troubles on the mines and now the farms of SA have hurt the rand. The rand is now significantly weaker than would have been predicted given the behaviour of emerging market equities and RSA sovereign risk spreads.

These two factors provide a very good explanation of the rand/USD exchange rate on a day to day basis. As we show below, the rand is about 12% weaker than predicted by this model of the rand.

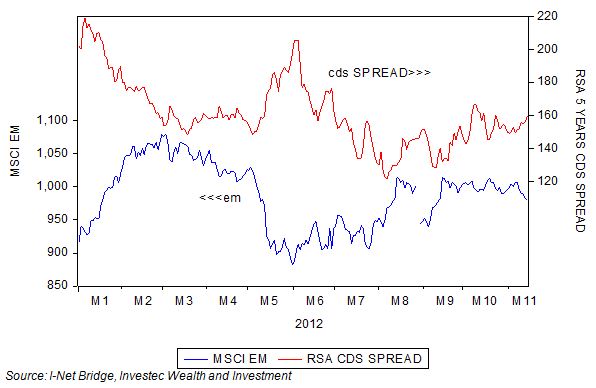
As may be seen below, the MSCI emerging market index has held up over recent months, as has the cost of insuring against a default on RSA foreign currency denominated debt with a five year credit default swap.

However, as may also be seen, RSA debt has derated in recent months. Compared with Turkish, Russian. Brazilian or Mexican debt, the costs of insuring RSA debt has become relatively more expensive.

Yet compared to the past, the SA risk spread remains very low by its own standards, at 150bps above the returns on US five year debt.

The exchange value of the rand will continue to be driven by global economic forces, as revealed by: the value of emerging market equities, the risks associated with SA (shown in the debt markets) and now also by SA specifics in the form of strike action. The markets will assess not so much the incidence of strike action, but its expected impact on the economy, notably exports and domestic economic activity. The challenge for the SA government is to reform its system of labour relations to make strike action less likely and less violent; and employment growth more likely. Brian Kantor

US monetary policy: What Ben may have seen

The scale of QE3, that is of further money creation in the US, the promise of an extra injection of US$85b into the US monetary system each month for as long as it takes until the unemployment rate normalises, is impressive indeed. It comes after QE1 and QE2 that has seen the US money base increase enormously from about US$800bn before the financial crisis to nearly US$2.6 trillion today.

The money base, adjusted for reserve requirements, is dollars in the form of greenbacks issued by the Federal Reserve System held by the public and the banks, not only in the US, but all over the world and in the form of deposits held by US banks, which are members of the Federal Reserve System, at their Federal Reserve Banks. Almost all of the extra deposits held by these banks are in excess of the requirement to hold a certain ratio of cash as required reserves. US banks that held no excess cash reserves before the crisis are now hoarding well over $1 trillion of excess reserves.

Fed chairman Ben Bernanke would much rather have these banks reduce their excess cash by making more loans or buying more assets in the market place. This would be good for the US economy, which suffers from too little demand to engage all its available resources, especially potential workers, many of whom have withdrawn from the labour market and no longer seek jobs. Pumping money into the system is meant to encourage more lending and spending. As may be seen in the figure below, the money base, despite all the prompting it has had, stopped growing in mid year. Hence the case for still more cash – cash that costs the Fed almost nothing to create and might yet do much good.

The injections of cash into the banking system have not been without impact on the broader definition of money, M2, which incorporates almost all of the liabilities of the banking system (mostly deposits with retail banks), and which has been growing strongly. This has been helpful for spending growth. However M2 growth also appears to have peaked and is tapering off. This too would concern Bernanke.

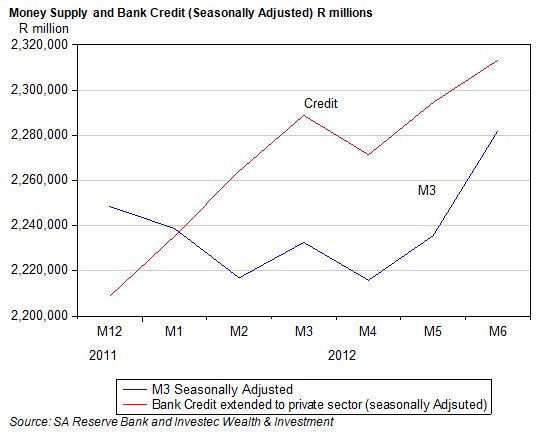
Creating cash is intended to increase the supply of money and bank credit (which it has done) but a faster rate of growth would be better under current circumstances. A further reason for QE3 would be to encourage M2 and bank credit growth to accelerate rather than decelerate (see below).

Bernanke will be doing all he can and he has considerable power to issue cash without limit: he can thus keep interest rates down all along the yield curve. This is until and maybe beyond the time that the Fed is confident the economic recovery is gathering strong momentum and unemployment normalises. What he will also be considering is to no longer offer the banks interest on their deposits with the Fed. This might encourage the banks to use rather than hoard their cash. The markets will to judge when rapid growth in central bank cash starts to succeed too well in preventing deflation and in stimulating economic activity and becomes inflationary (as history teaches it always does).

SA bond markets: That steepening curve

There were two important developments last week for the market in rand denominated fixed interest bonds. Firstly, RSA bonds are now included in the Citibank World Government Bond Index – a widely applied bench mark Index for government bonds. This would have encouraged demand for RSA bonds and the rand, even though the intention to include SA in the Index (the result of growing demands for RSA bonds) was announced well before the actual event.

Secondly, and simultaneously negative for SA long term interest rates and the rand, was the announcement by Moody’s that it was joining S&P and Fitch (the other debt rating agencies) in downgrading SA’s credit rating.

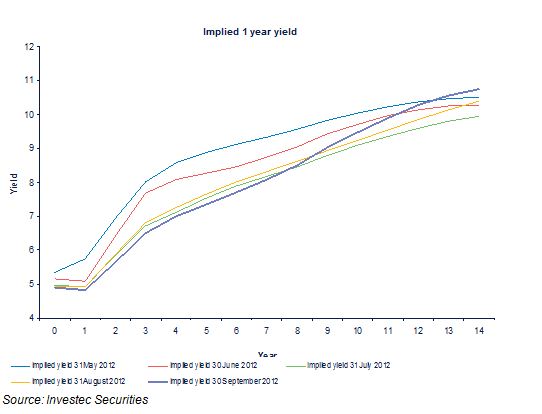
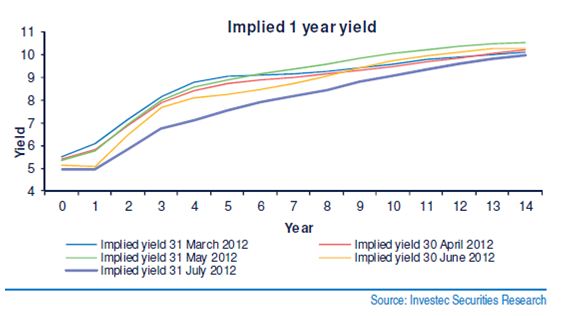
The impact of these events on the bond market was to be seen last week in a steepening of the yield curve beyond three years’ duration. The one year rate of interest expected by the market place in the future can be interpolated from the level and slope of the yield curve. As we show below, the market now expects short rates (one year yields, currently about 5% p.a.) to decline slightly over the next year and a half. They are then expected to increase to 6.5% in three and a half years and thereafter to continue to increase gradually, reaching a level of 10% in 15 years.

By South African standards this forecast or market consensus view would represent low and well behaved short term interest rates. The proactive decision by the Reserve Bank of Australia today to unexpectedly cut its key lending rate by 25bp may well encourage the SA Reserve Bank to follow its example. The market may now well price in a higher probability of an interest rate cut in SA.

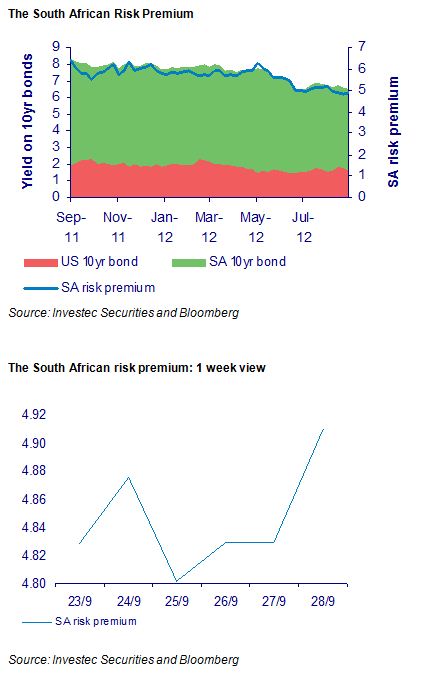
The key to interest rates over the long run will be inflation; and the key to inflation will be global inflation coupled to the performance of the rand. In this regard, the markets are registering less expected weakness in the rand over the next 10 years. The gap between 10 year US Treasury yields and RSA 10 year yields has narrowed from about 6.38% a year ago to 4.9% on Friday.

This difference in yields represents break even depreciation of the rand against the US dollar. If the rand depreciates by more than this it would pay to borrow dollars rather than rands (and vice versa if the rand depreciates by less). In other words, the cost of insuring against rand weakness over the next 10 years in the forward exchange market would approximate this difference in interest rates. This difference may also be described as the SA risk premium – nominal returns on SA securities measured in rands would be expected to exceed US dollar returns by this margin. Last week the SA risk premium widened from 4.83% at the beginning of the week to 4.9% by the weekend (see below). This difference is also described as the interest rate carry.

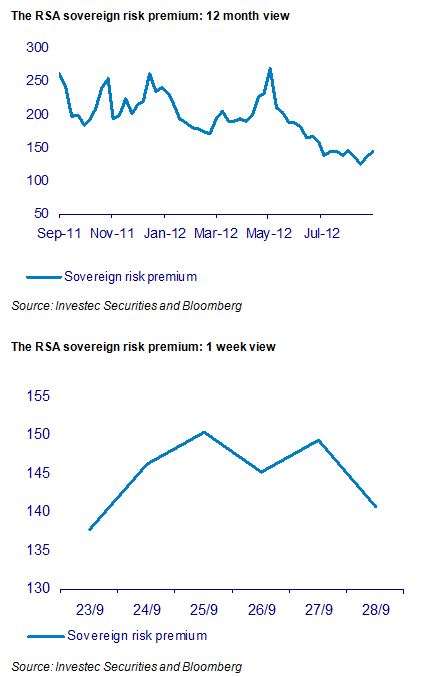
An alternative measure of SA risk is the sovereign risk premium. This is the difference between the yield on RSA US dollar denominated debt and that of US treasuries of similar duration. The reward for carrying RSA default risk has declined over the past year, very much in line with emerging market US dollar-denominated debt generally. Last week, this risk premium ended the week as it started (see below).

Movements in these bond market spreads on US dollar denominated emerging market debt can go a long way in explaining movements in the rand. However as we show below, the rand is currently significantly weaker than might have been predicted, given the levels of emerging market equities and bonds (about 10% weaker).
Perhaps this extra degree of rand weakness (attributable to SA specific events) is being recognised in less rand weakness going forward – as reflected in the lower interest rate carry. More rand weakness today is associated with less, rather than more, weakness expected tomorrow or next year.

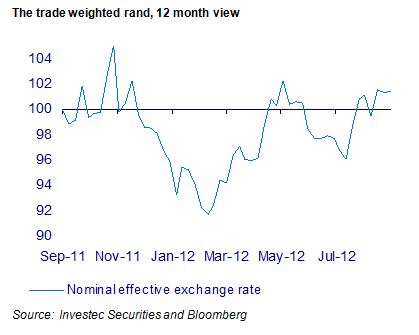
On a trade weighted basis it should be noted that the rand is little changed on a year ago and also was highly stable last week. This implies that little additional pressure on local prices is now being exerted from offshore. Brian Kantor

Equity markets: Is it time to rotate into the cyclical stocks?

A defining recent feature of the JSE and other stock markets this year has been the very good performance of the defensive stocks, especially those with attractive dividend yields and balance sheets to support growth in dividends. By contrast, the performance of the cyclical stocks – especially mining companies – has been very poor both absolutely and relatively, when their performance has been compared to the defensives.

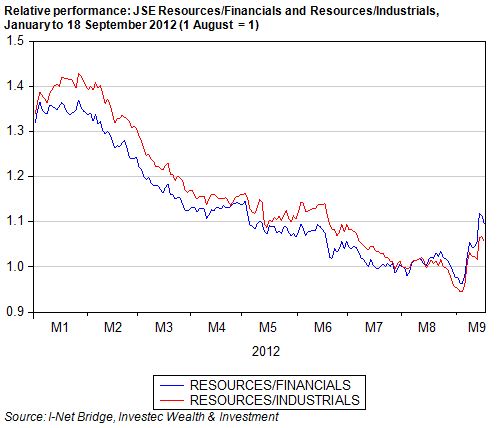
We show below the relative performance of the Resource, Financial and Industrial Indexes between 1 January and 18 September. As may be seen, in 2012 the Financials and Industrials on average have gained about 30% on the average Resource counter listed on the JSE.

Such outcomes are very understandable in a world of exceptionally low interest rates, coupled as they are with grave doubts about the strength of any global cyclical economic recovery (from which metal and mineral prices and the profits of mining companies would stand to benefit).

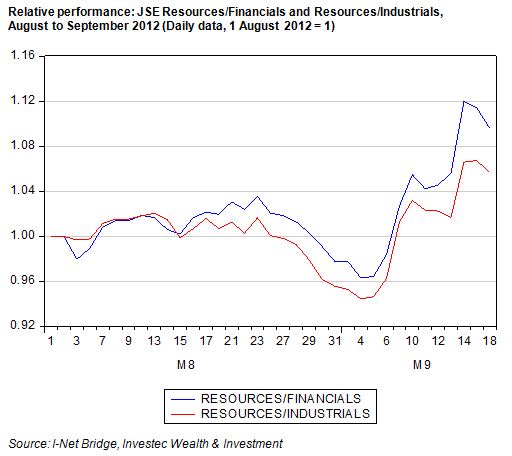
This outperformance was reversed on 13 September when Fed chairman Ben Bernanke and the Federal Open Market Committee announced QE3. The Fed plans to inject an additional US$85bn of cash into the US monetary system each month through additional purchases of mortgage backed securities and US government bonds. The intention is to keep interest rates as low as possible for as long as it might take to revive the US economy and employment or at least until 2015.

The question therefore is not whether or not the Fed will achieve its objective of low interest rates. This it will surely do thanks to its freedom to effectively create as much cash as it deems appropriate and also to twist the yield curve accordingly, that is borrow short and lend long if necessary, to hold down long rates relative to short rates (which are close to zero and will surely remain so for some extended time). The question is whether continued low interest rates can stimulate a more robust economic recovery. If they can then the underappreciated cyclical stocks would especially stand to benefit.

The stock markets on Thursday and Friday last week reacted as if it was truly time for the cyclical stocks. They gained materially against the Financials and Industrials. There also appeared to be some rotation on the JSE away from the Industrials and Financials. On the Monday these trends were partially reversed as we show below.

Our own view, expressed on the day after Bernanke fired his bazooka, was that the promise of a further extended period of low interest rates would continue to make secure dividend yields well above money market rates still appear attractive, given the absence of any assured cyclical recovery. Playing defence, we thought, might remain the best policy in these new circumstances. It seemed clear to us that pumping money into the system would be helpful to asset prices generally – but perhaps not especially helpful to the cyclicals. Still more highly accommodative monetary policy might not, we surmised, provide the quick fix for the global economy. It has not done so to date. The jury will remain out on this for some time we think – or until a global cyclical recovery appears much more likely.

Global markets: A harbinger of a new Spring – or a one day wonder?

On Thursday Mario Draghi spoke and the markets liked what they heard about the outlook for Europe. The judgment was that taking on more risk in the markets might well be rewarded. On Friday we saw a most unlikely set of outcomes in response to a healthier appetite for risk taking. That risky currency, the rand, gathered strength. Resources on the JSE benefitted particularly, despite (or rather because of) the rand strength associated with strength in underlying metal and mineral prices that are linked to an improved outlook for the global economy.
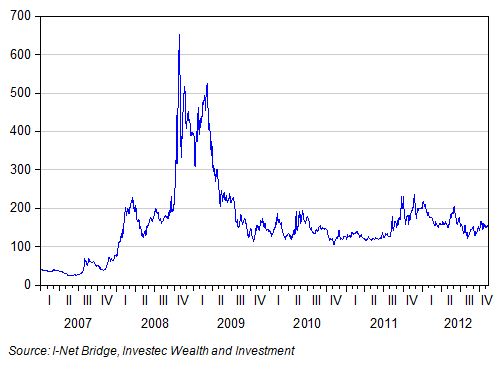
As we have noted often before, resources only benefit from a weaker rand or are harmed by a stronger rand when this occurs for SA specific reasons. Only then do they behave as rand hedges. Ordinarily they are rand plays – doing best when the rand strengthens – for global growth reasons.

SA financials are also mostly rand plays – doing better when the rand strengthens and the outlook for lower inflation and interest rates improves with rand strength. But surprisingly on Friday SA Financials lost ground. While JSE Mining was up 3.75% on the day, the JSE Fini15 lost 0.8% of its value. Financials and banks offshore had a very good Friday by contrast, as we show below:

Given the improved appetite for taking on risk, the large losers on Friday were the globally traded, highly defensive counters. These are the shares that have been coveted for their dividend yields and prospects of special dividends in a world of very low interest rates. For example British American Tobacco lost R14 or approximately 3% of its opening value on Friday. On the FTSE the stock was down 1.5%.

These developments on Friday helped reverse a long running saga on the JSE of underperforming resource counters and strongly outperforming producers and distributors of consumers goods with strong balance sheets paying dividends that are likely to be sustained.

Investors globally on Friday clearly rotated away from demandingly valued defensives to cyclically dependent stocks and financials that appear undervalued by their own standards. Why SA financials should have failed to benefit from this switch and rand strength may be regarded as something of an anomaly. Is this the start of something potentially very big – the reversal of the defensive trends that have dominated market performance over the past 12 months, or merely a minor correction of such trends? Our position has been to maintain a moderately risk on exposure to equities generally with a bias in favour of defensive dividend payers. A few more days like Friday would help concentrate our minds, perhaps leading us to a somewhat different, more risk-on conclusion. Brian Kantor

SA listed property: Running on technically enhanced blades?

The Property Loan Stock (PLS) Index has again performed outstandingly well this year to date, realising returns of over 40%. It has also enjoyed an exceptionally good quarter to date with returns of over 16%. The Index has moreover significantly outperformed the bond market as may be seen below.

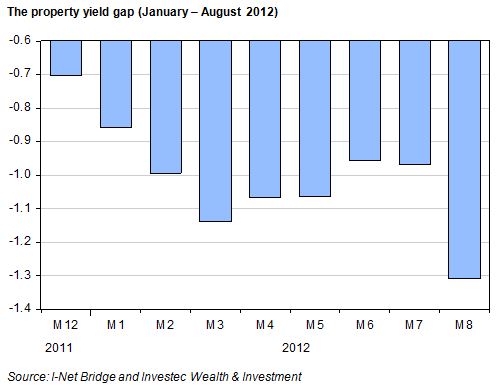
The gap between RSA bond yields and the trailing dividend yield on the PLS Index may be regarded as a way to rate the listed property market. One can presume that the lower this difference in yields (currently negative), the superior the rating enjoyed by the property stocks. Presumably also, the lower the trailing dividend yield on the PLS Index, then the faster the dividends paid are expected to grow.

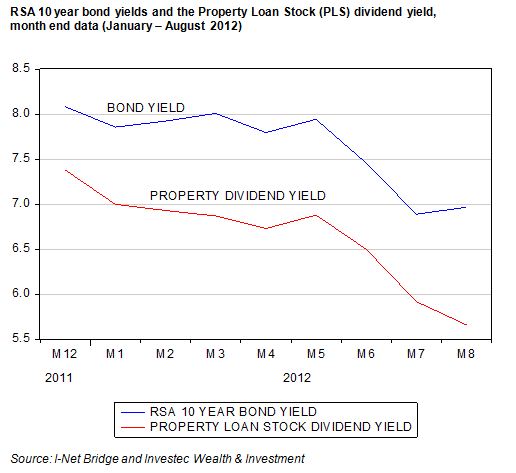
As we show below the yield gap between RSA bond yields and the initial trailing property dividend yield has narrowed markedly over the years. This yield gap stabilised at about a negative one per cent per annum after 2008, indicating very little of a rerating until very recently, when over the past month, the yield gap narrowed sharply (that is became distinctly more negative) to the advantage of PLS valuations.

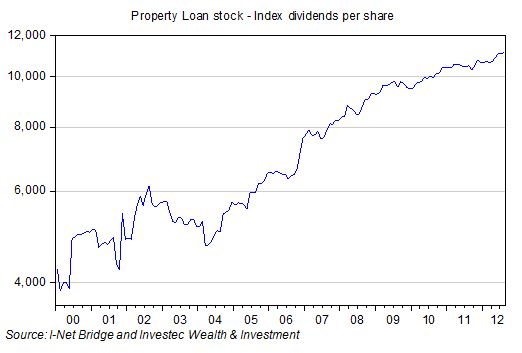
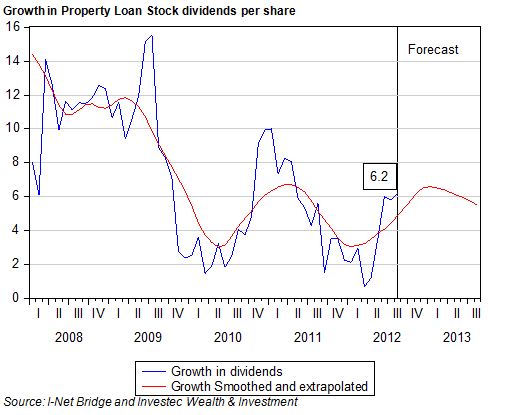
In the figures below we show the performance of the PLS in the form of index dividends per share as well as the growth in these distributions. These dividends have grown consistently and continued to increase through the recession of 2008-2009. Their growth was particularly rapid in 2008. Growth in dividends fell off in 2009 and has since managed to keep pace with inflation. Real CPI adjusted PLS dividends have stabilised since 2008 and are expected to continue to do so. Nominal dividends are currently growing at about 6% per annum – compared to inflation (currently about 5%) and is expected by the bond market to average about 6% over the next 10 years.

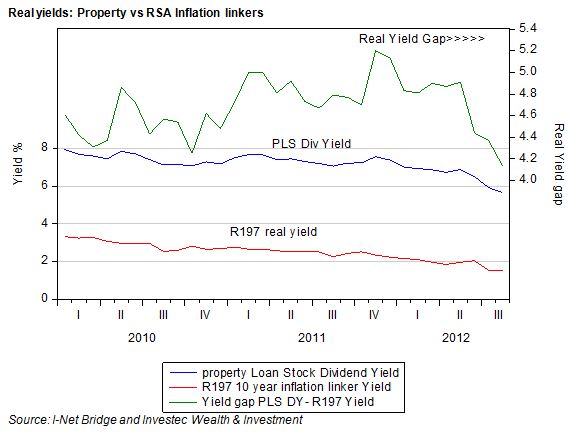
The current PLS trailing dividend yield of 5.66% represents a record low. Should PLS dividends continue to match inflation (as they are confidently expected to do at least for the next two years) this would correspond to a real yield of the same 5.66%. We have long argued that a real yield of 5% should be regarded as appropriate for the sector, given its risk character.This real 5% would represent an expected risk premium for investors in the PLS Index of about 2% over inflation linked government bonds that normally could be expected to offer about a real 3%.

Current RSA inflation-linked yields have however fallen far below the 3% real yield that might be regarded as a normal real return on a default free, inflation risk free government bond. The yield on the 10 year RSA197 has however fallen to a record low 1.53% real yield.

Compared to a certain real 1.53%, a prospective 5.7% real yield from the PLS Index may still appear attractive. If dividends distributed keep pace with inflation, this initial 5.7% converts into a real 5.7%. This prospective extra real return over and above the return on the government inflation linked bond (currently about 4%), may still seem be more than enough to cover the risk that PLS dividends will not be able to keep up with inflation. This extra 4% real risk premium is still well ahead of the 2% risk premium (5% less the normal 3%) that we have argued should be sufficient to the purpose of attracting funds to the PLS sector.

The conclusion we come to is that until real interest rates on the long dated inflation linkers in SA normalise towards the 3% p.a rate, the PLS counters (that promise a real return of over 5% per annum) may still appear attractive. Brian Kantor

You can’t always get what you want: Is platinum mining profitable?

The Rolling Stones captured the disillusion of the 1960s counter culture in their hit song “You Can’t Always Get What You Want”. It was released in 1969 after the initial wave of 1960s optimism had surged to anger and disenchantment. The song offers practical hope by suggesting that we should strive to get what we need since we’re bound to fall short in getting what we want.

The platinum industry has been one of great hope and now disillusionment. Has it been profitable and created value? Is it profitable today and what is implied in the share prices of platinum mining companies? By answering these questions, we can begin realistically to untangle economic wants and needs.

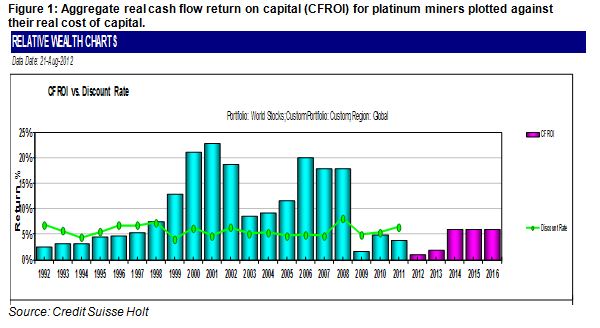
We’ve aggregated the historical financial statements of the four largest platinum miners (Anglo American Platinum, Impala, Lonmin and Northam) and calculated the inflation-adjusted cash flow return on operating assets, CFROI®. From 1992 to 1997, platinum miners were generating an unattractive return on capital, which slipped below the cost of capital. The years 1999 to 2002 provided the first wave of extraordinary fortune for this industry. The real return on capital exceeded 20%, making it one of the most profitable industries in the world at that time. The rush was on to mine platinum and build company strategies around this effort. Lonmin bet its future on platinum.

The second wave of fortune occurred during the global commodities “super cycle” from 2006 to 2008. Again, platinum mining became one of the most profitable businesses in the world as shown in our chart. The good times ended abruptly with the onset of the Great Recession in 2009, and platinum miners saw their real return on capital drop below 2% – well below the cost of capital, i.e., the return required to justify committing further capital to the industry.

Unfortunately, operating returns have not improved much and have remained below the cost of capital throughout the global slowdown due to increasing labour and excavation costs, and lower platinum prices. Suffice to say, platinum miners aren’t producing sufficient returns to satisfy shareholders. This has resulted in cost-cutting, lay-offs and chops to capital expenditure plans. These are natural economic consequences when a business is destroying economic value by not meeting its cost of capital.

And what does the future hold? We’ve taken analyst expectations for 2012 and 2013 and estimated the real return on capital. It remains very poor at a wealth destructive level of 2%. There is no hint of a return to superior profitability in the share prices of platinum miners. At best, the market has them priced to return to a real return on capital of 6%, which is the average real cost of capital.

It looks highly unlikely that platinum miners will be able to satisfy the wants of their stakeholders. All parties should focus on what is realistically possible and economically feasible. The workers and the unions already subject to retrenchment and very poor job prospects would surely be wise to focus on job retention rather than further gains in real employment benefits. Though grave damage to employment prospects in what was once a promising industry has surely already been done, northern Europe’s response to the Great Recession remains a potential template for management and labour. The cold reality is that capital in the form of increasingly sophisticated and robotic equipment will continue to replace labour. Management will have had their minds ever more strongly focused on such possibilities by recent events.

Moreover, SA has a responsibility to the global economy to supply platinum in predictable volume: the motor industry depends on this. Higher platinum prices, while a helpful short term response to disrupted output, would encourage the search for alternatives to platinum for auto catalysts. This would mean a decline in platinum prices over the long term.

Unless the industry can come to deliver a cost of capital beating return, its value to all stakeholders will surely decline. Perhaps they will even decline to the point where nationalising the industry with full compensation might seem a tragically realistic proposition.

Nationalisation will not solve the problem of poor labour relations and the decline in the productivity of both labour and capital in the industry. It would simply mean that taxpayers, rather than shareholders, carry the can for the failures of management. To its financial detriment, government would have to invest scarce funds in a capital-intensive industry that is not generating a sufficient return. Workers might think management (subject to the discipline of taxpayers rather than shareholders) would be a softer touch, but this would lead to the spiral of greater destruction of economic value and ultimately fewer jobs. Government and taxpayers should be very wary of signing a blank cheque. All parties need to focus on what is realistically possible and economically feasible. David Holland* and Brian Kantor

*David Holland is a senior advisor to Credit Suisse and was previously a Managing Director at Credit Suisse HOLT based in London in charge of the global HOLT Valuation & Analytics group.

Global markets: Becoming more cold-blooded

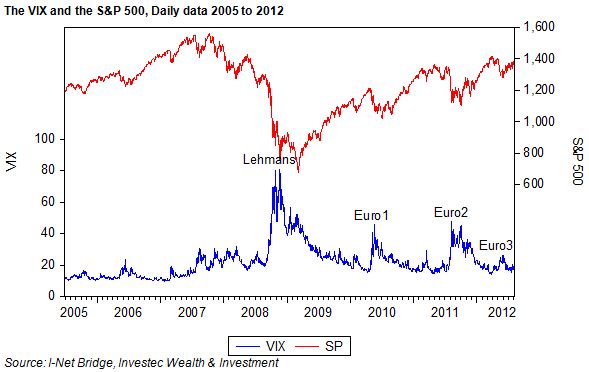
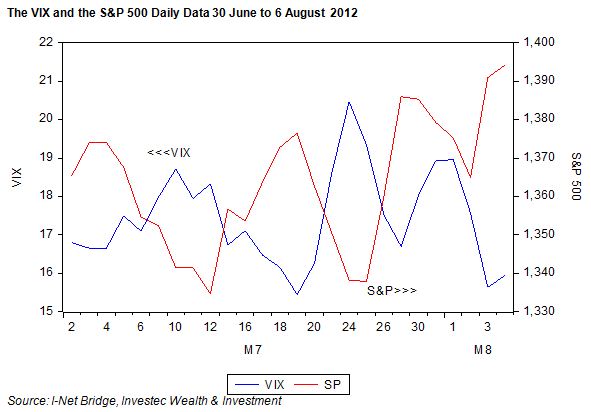
The Volatility Index (VIX), which is traded on the Chicago Board Options Exchange and that reflects the implied volatility of an option on the S&P 500, has been trading at very low levels recently. It has been in the mid teens, or at levels that were common before the Global Financial Crisis triggered by the collapse of Lehman Brothers.

As we show below the VIX rose to as much as 80 in late 2008. We also show how the Euro Crises drove the VIX markedly higher, though never to Lehman type levels of anxiety.

What is noticeable is just how little affected the share markets and the options traders were by the latest flurries in the share dovecote caused by weakness in Spanish and Italian debt. Judged by the behaviour of the VIX this year, the markets have not been nearly as noisy as the commentators.

We also show that where the VIX goes, so goes the S&P 500 in the opposite direction. When risks go up (as reflected by actual or implied volatility of share prices) returns (that is share prices) go down and vice versa. The correlation between daily percentage moves in the VIX and the S&P is (-0.80), which is very close to a one to opposite one relationship.

This may (hopefully) mean that we have entered a much more sanguine market place and if sustained, this degree of detachment will remain helpful to shares and what are regarded as riskier bonds. The safe haven bonds, by the same token, will not then attract the same anxious attention to the point where favoured governments have been paid by investors to take their money for up to two years rather than the other way round.

The attention of the market place may turn much more closely to the outlook for earnings and interest rates rather than the the very hard to estimate (small) probability of catastrophic financial events. These probabilities can alter meaningfully from day to day, so adding to share and bond price volatility of the kind observed post Lehman and post the Euro crises

The JSE in July: Interest rates matter

July 2012 proved to be another good month for the Interest rate plays and the Industrial Hedges listed on the JSE Top 40 Index. It was yet another poor month for the Commodity price plays as we show below.

The Industrial hedges are those large cap companies listed on the JSE that are largely exposed to the global economy and whose values are insensitive to both SA interest rates and commodity prices. British American Tobacco, SAB, Naspers and Richemont have proved highly defensive against the risks to the global economy posed by the Eurozone crisis. The cyclical commodity price plays by contrast have been much damaged by these anxieties and share market trends in July proved no exception.

The interest rate sensitive stocks, especially banks, retailers and listed SA property (all of which are highly dependent on the SA economy) have benefitted from the surprising decline in SA interest rates and especially the July cut in the Reserve Bank repo rate. We show below, with the aid of Chris Holdsworth of Investec Securities, just how significantly lower SA interest rates have moved across the yield curve in recent weeks.

The term structure of interest rates at any point in time makes it possible to infer the short rates expected by the market over the next 15 years. As we show below the rate of interest on RSA bonds with one year to maturity is now expected to remain unchanged over the next year. Then it is expected to increase much more gradually over the next few years and to remain below 7% p.a for another four years. This outlook for interest rates is very encouraging to those companies for whom interest rates are an important influence on their revenues and profits.

The market in fixed interest securities can change its mind and can be expected to do so again. Holdsworth has developed and successfully tested a theory about the forces that drive the gap between long and short rates in SA. The theory is that money supply growth rates lead interest rate moves by about 12 months. The explanation for this is highly plausible. Given monetary policy practice in SA, the supply of money (defined broadly as M3) and bank credit accommodate the demand for money and credit. Economic activity therefore leads money supply and credit growth and so subsequent moves in interest rates. In other words, economic activity leads and money supply and interest rates follow in due course.

The test of this theory of short term rates is shown below. The money supply has done a good job at predicting short rates and has done better, statistically, than the yield curve itself in forecasting short rates. The Holdsworth prediction, given recent money supply trends, is for still lower short rates to come, of the order of 4.6% p.a in 12 months’ time. The forecast of the three month rate in June 2013, implicit in the Forward Rate Agreements offered by the banks, is currently 4.9% p.a.

Whether these forecasts will prove accurate or not will depend upon the state of the SA economy over the next 12 months. The stronger the economy the higher will be interest rates and vice versa. All will be revealed by the growth in the balance sheets of the banking system, that is in the money supply broadly defined (M3). These constitute most of the liabilities of the banks and the supply of bank credit. These money and credit aggregates as well as the state of the economy will be closely watched by the Reserve Bank.

However when these aggregates are converted into growth over three months (calculated monthly), the picture looks rather different. Growth in credit supply has slowed sharply while growth in M3 remains anemic with both now at about a 4% p.a. rate of growth. Such growth rates, if maintained, would mean lower rather than higher interest rates to come. These aggregates will bear especially close watching over the months to come. Brian Kantor

JSE listed retailers: Identifying impressive outperformance

JSE listed retailers listed in the General Retailer or Food and Drug Retailer sub-indexes continue to enjoy great approval from investors. They have outperformed the All Share Index since 2003 by very large margins with the Food and Drug Retailers performing especially well with this Index rising by an extraordinary 1200% over the period 1 January 2003 to 22 June 2012 compared to a still very satisfactory 400% improvement for the All Share Index.

The General Retail Index did twice as well as the All Share. Over the period January 2003- June 2012 the JSE ALSI provided an average return, including dividends, calculated monthly of 15.2% p.a., compared to 25.3% from the General Retailers and 28.7% realised by the Food and Drug Retail Index.

The sector has re-rated: prices have risen further than earnings

The outperformance by retailers was almost as impressive on the earnings front. Retail Index earnings per share have grown twice as fast as All Share Earnings, growing six times compared to the three fold increase recorded by the market as a whole (including the contribution made by retailers. The General Retailers, having seen earnings decline in the recession of 2009, have now caught up with Food and Drug Index earnings per share. Impressively the Food and Drug Retailers were able to sustain impressive growth in their earnings despite the recession.

Over the past twelve months to 22 June the General and Food Retailers, co-incidentally, both provided their shareholders with as much as a 34% return. Clearly investors continue to be surprised by the sustained excellent economic performance of the retailers. Returns of this order of magnitude are far in excess of the risk adjusted returns required to satisfy investors and therefore must represent further unexpectedly good performance over the past twelve months. But having been surprised, investors have come to expect more from their retailers, as revealed by more demanding valuations.

The Food retailers are trading at over 25 times trailing earnings and the General Retailers 18 times compared with the market as a whole that is priced at a much less demanding 12.5 times reported earnings.

Identifying the performance drivers

As we indicated in our previous report on retailers on the JSE, these companies, in growing their earnings, have realised extraordinarily good (internal) returns on shareholders capital they have invested in recent years. The accounting returns on equity capital for the latest reporting period have ranged from 20% to 49% as indicated in the table below.

Given these exceptionally good returns on capital and given what have become demanding market valuations, we thought it helpful to compare the listed retailers using three metrics. In our previous report we compared Shoprite to Pick n Pay and Woolworths. In this report we extend the comparison to Truworths (TRU), The Foschini Group (TFG) and Mr Price (MPC).

Firstly we compare the ability of the different retailers to realise cash from sales revenue. In the figure below we compare cash to sales ratios of three retailers. All three have proven ability to turn sales into cash on the balance sheet but TRU is a clear leader in this regard as may be seen.

But realising cash is not all that will determine the value of the company. It is what is done with the cash that will matter to shareholders. Investing the cash will add more value than paying it out in dividends or share buy backs, provided the returns on capital exceed their opportunity costs. Clearly the retailers meet this proviso by large margins.

We show the ratio of capex to cash flows below. By this criterion TRU ranks behind MPC and more so TFG. TFG appears as the most willing to turn cash into fixed and perhaps also working assets. But all three retailers typically invest only at best to half the cash they generate.

This reluctance, or rather perhaps the inability, to find value adding investment opportunities is demonstrated by rather tepid and variable growth in capital expenditure itself as we show below. As may be seen the rate of capital expenditure appears to have slowed down in recent years.

Conclusion

It seems fair to conclude that these listed retailers have done done much better at the operating level than they have at identifying and implementing growth enhancing investment activity. If they are to surprise the market in the future as they have done in the past, they would need to do both. Brian Kantor

Retailers: What shareholders should expect

What should investors wish of the companies they own a share of? Ideally their management is able to generate an (internal) rate of return on the shareholders capital they invest that is in excess of the opportunity cost of that capital. The larger the excess returns, the more capital the company would be encouraged to invest and the more the share market will approve of such growth over time.

This capital could be raised from operations, from issuing additional shares or by borrowing. As the company expands by undertaking value adding capital expenditure, it can be expected that the gap between the internal rate of return and the cost of capital would narrow. The potential value to be added for shareholders is a multiple of the amount invested and the spread between the internal rate of return from capital invested in working and fixed capital and the opportunity cost of that capital. The objective of the company should be to maximise the value add, not the spread between internal and required rates of return. We would suggest that the required rates of return would be about 4%-5% above the rate of interest on an RSA long dated bond. This is a lower risk premium for food retailers and higher for credit providing retailers.
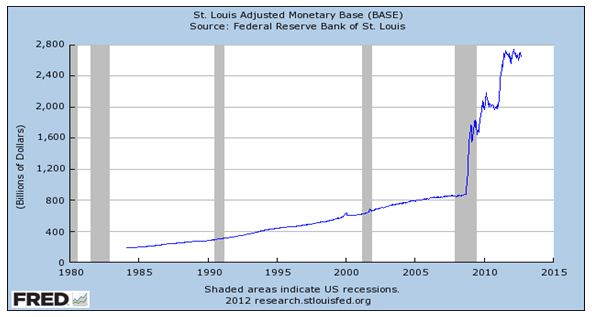
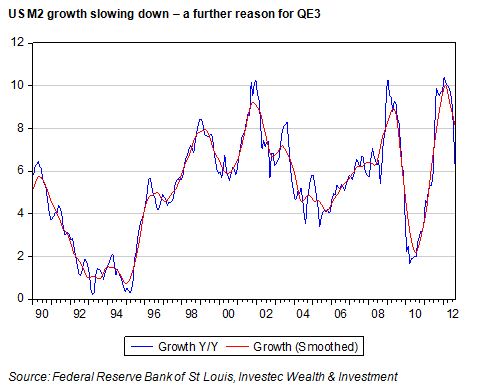
SA retailers have proved highly capable of generating very high internal rates of return from their businesses. Returns realised on equity capital by listed retailers and their market-to-book values are impressively high. The share market has also registered its approval by raising the price to earnings (PE) multiples of listed retailers. The following table taken from Bloomberg indicates the range of outcomes for listed JSE retailers. Market price-to-book values range from over 9 times for Woolworths, Shoprite and Mr Price to under two times for furniture retailers. Return on book equity ranges from nearly 50% to about 20% and the PE multiples range from eight to 22 times reported earnings.

Clearly not all retailers are equal. Given the excess returns potentially available to retailers, those best able to undertake additional value adding capital expenditure for shareholders should be prized above others. If they lack such opportunities, the best they can do for shareholders would be to return capital to them either via the dividend route or through share buy backs.

We have compared three leading retailers below. We compare and examine Shoprite (SHP) Pick and Pay (PIK) and Woolworths (WHL) on two dimensions: by cash flow over capital expenditure and sales; and by growth in capital expenditure. Ideally the more capex relative to cash flow the better it is for shareholders on the assumption that the returns will exceed the cost of capital. If cash flow exceeds capital expenditure then cash will have been used to pay back debt, pay dividends or buy back shares. These are signs that management lacks the confidence or the ability to realise value adding capital expenditure.

The cash to sales ratio indicates the ability of the respective retailers to generate cash from current operations and the growth in capital expenditure provides a leading indicator of future growth. At the operational level, SHP has generated significantly more cash per unit of sales than PIK over all years since 2000 except for 2005 and 2002, by a small margin. WHL has performed much better than SHP over recent years in terms of cash flow per unit of sales, though it lagged behind SHP between 2004 and 2007.

These three retailers seem generally unable or unwilling to undertake capex in excess of cash flow, with the notable exceptions of SHP in 2005 and WHL between 2004 and 2007, when capex exceeded 100% of cash flow. No doubt the improved operational performance of WHL in recent years has had something to do with the capex undertaken earlier. What may also be important is that PIK in 2011 increased its capex to more than 100% of cash flow – something that it conspicuously failed to do before.

The growth in capital expenditure shows an uneven pace: SHP and WHL score better than PIK in this growth league.

It will be clear that SHP has been doing much more of the good stuff for shareholders than PIK. WHL has also been competing strongly with its expansion plans. PIK has lagged behind and is, by all accounts from management and its board, playing catch up (as it needs to do if it is to compete effectively).

The recent capital raising exercise by SHP, when it raised about 10% of its market value with new debt and equity, puts it in a strong financial position to fund growth. The share market is pricing all these retailers for strong growth, as indicated by current valuations, market-to-book and PE ratios. They will have to run hard and continue to grow fast to satisfy demanding market expectations. Thus having to raise additional equity or debt capital, rather than relying on internally generated cash, should be seen a positive rather than negative by shareholders. We will compare in a similar way other listed retailers in subsequent reports. Brian Kantor

Markets: A good week for global equities, RSA bonds and SA risk

Last week was very kind to global equities. The S&P 500 was up nearly 4% as were US small caps represented by the Russell 2500. The SA component of the benchmark MSCI emerging market index was up over 3% and also did better than the average EM market last week.

It was also a very good week for investors in RSA bonds, of both the rand and US dollar denominated variety. The spread between RSA Yields fell across the term structure of interest rates.

Yankee bonds and their US Treasury Bond counterparts declined by over 60bps in the week – strongly reversing wider spreads that had opened up recently with heightened global risk aversion.

The good news in the RSA bond market meant that the spread between RSA 10 year bonds denominated in rands and US Treasury Bonds yielding US dollars, also narrowed by about 20bps. This spread may be regarded as the total SA risk spread offered to offshore investors with the difference in 10 year yields representing the rate at which the rand is expected to depreciate against the US dollar over the 10 years. Should the rand weaken as expected over the next 10 years, that is at an average rate of 6% p.a, it would make little difference to borrow or lend rands or US dollars. What is gained or lost on the exchange rate leg will be made up or given up on the interest rate spread.

Sometimes known as the interest parity condition, these interest rate differences will also reveal themselves in the premiums paid for US dollars to be delivered against rands in the future, that is the premium paid for forward cover. Last week insuring against expected rand weakness became a little cheaper. If risk tolerance should improve further, both the spot rand/US dollar rate should benefit and interest rates in SA decline relative to those in the US. Brian Kantor