Summary- a shorter version of the full analysis to be found below
I recently read Mervyn King’s The End of Alchemy: Money, Banking and the Future of the Global Economy, (2016 and 2017) with some concern. The alchemy of which the former governor of the Bank of England is much concerned is the money multiplier, that bank deposits that serve as money are a multiple of the cash supplied to the banks by their Central Banks. This shibboleth, that banks have some dangerous magical power to create deposits, that is money, has long been disabused.
It was argued by Tobin and others in the sixties that banks are a particular kind of saving intermediary that funds its lending by suppling an attractive payments facility. The willingness of banks to supply this costly service depends on their profitability. Without income from lending – funded by deposits – the banks might not have been able to supply the costly payments system on the scale they have done. And the economy would have had to rely much more on receiving and delivering cash- a very costly alternative.
That is unless the banks could have charged fees to cover the full costs of managing the payments system. However such fees might have discouraged the demand for deposits and increased the demand for cash. Hence the banks in effect cross-subsided the transactions depositors would make with the revenue earned from their lending activities. The profitability of banks depends in part on managing their cash reserves, keeping them as small as possible – and by holding no more than prudent reserves of equity capital to cover non-performing loans and improve the return on shareholder’s capital. In other words from leveraging their balance sheets.
It is not the deposit multiplier but the leverage of the banks that exposes their shareholders (and the broader economy that depends upon sound banks) to the danger that non-performing loans may exceed the equity of the bank – hence bankruptcy or the necessity to raise more equity or debt capital . However it is not only the deposits (liabilities of the banks and assets of depositors) that may be destroyed by the failure of a banking system. Of greater importance is that the payments system, of which deposits are an essential part, can go down with the banks, with truly catastrophic effect for any modern highly specialized economy.
Perfect safety can only come with deposits fully backed by cash issued by the central bank. Banks as we know them however would not have been able to supply transaction balances and be profitable enough to survive- without taking on leverage. Leaving banks to make the trade-off between risk and return, has worked well enough most, but not all of the time. The Global Financial Crisis of 2008 demonstrated why it is very important to be able to deal with a banking crisis – should banks or more specifically, the payments system delivered by banks be threatened with failure. The solution to any run on the banking system is for the central bank to supply more than enough cash to stop the run. Or to prevent it in the first place should it be recognized that the banking system is indeed too important to be allowed to fail
As the responses (on the fly) to the GFC proved it is not beyond the wit of man to preserve the payments system from failing should such a melt-down threaten. It is moreover not beyond our wit to develop bankruptcy laws for banks that will always in all possible circumstances preserve the payments system. Such a fail-safe system does not have to allow bankers and their governors to escape the consequences of failure.
That is the known fear of failure and its consequences will be enough to focus the minds of bank lending officers on the trade-off between reward and risk – enough to reduce the threat of banking failures in the first instance. But there can be no guarantee of permanently responsible behavior- of too much rather than too little leverage and bank lending. Too little bank lending is another danger to an economy as the European banks may be demonstrating today.
What should be guaranteed by the government is the survival of a payments system that is indeed too big to fail and might have to be taken over in a severe emergency. Via a predictable, legitimated process that would forestall any panic by depositors that they would not have access to their deposits to make payments with.
Perhaps modern information technology will in due course allow a 100 percent, central bank deposit backed, fee collecting payments providers to survive and compete with the deposit taking banks. And so eventually take over the responsibility of the payments system from private banks- if the fee structure is attractive enough to compete with the banks for the transactions balances of households and firms. If so deposit taking banks, supplying a bundled service of payments with the aid of leverage may fade away to be replaced by other forms of financial intermediation- with leverage – but without responsibility for making payments.
This brave or rather more cautious new world may be the next wave in the evolution of a financial system. One that would provide for the separation of the payments system from the dangers of leverage. Wisdom would be to let a profit seeking competitive financial system evolve in response to the preferences of lenders and borrowers and for regulators to stay out of the way. Other than to design a predicitable rescue operation- that could be called upon in extremis – and be expected to save the payments system – but not lenders or borrowers from the consequences of their own follies.
The full analysis
Banks and the next financial crisis- a refutation of the Mervyn King thesis
Mervyn King who led the Bank of England between 2003 and 2013, and through the global and British financial crisis of 2008-09, is a very worried man. In his book The End of Alchemy: Money, Banking and the Future of the Global Economy, (2016 and 2017) he argues that another financial crisis is all but inevitable given the essential character of a modern banking system. I have serious reservations about the King monetary diagnosis and prognosis for the banking system. They have stimulated this discussion on the nature and future of banking.
The apparently dangerous alchemy that King identifies, the reason for his pessimism about the financial future, is the ability of private banks to create money. It is not a concern shared by most monetary economists.
Referring to the seminal work of James Tobin
The work of James Tobin, Nobel prize winner and inventor of portfolio theory in the nineteen fifties and sixties was highly influential in this regard. Tobin explained that banks do not magically “create money” in the form of deposits that are a substitute for the cash that would otherwise be held and exchanged.
Rather following Tobin banks are better understood as profit seeking businesses supplying deposits (not creating them) in response to the demands for them. A supply that is accompanied by significant costs of production that have to be recovered through interest charges for the loans they make and the fees they charge customers for the transactions they facilitate. The wealth banks create for their shareholders will depend on successfully covering the significant costs of supplying these deposit facilities and managing the associated payments system. It is the increase in the value of the equity of a bank that constitutes wealth creation. Raising deposit liabilities is a means to this end. Tobin emphasized that the real size of any banking system, its role in the economy measured perhaps by the ratio of bank liabilities to GDP, will be determined by the profitability of banking.[1]
The importance of the payments system provided by banks
A large part of the reason why customers of banks (firms and households) hold deposits with banks, is that they can be withdrawn on demand – to easily make and receive payments. Bank deposits give access to the payments system that is indispensable for the working of any complex economic system. The loans banks provide and the interest spread they earn, help support the provision of a payments system.
A banking and financial crisis does not only threaten the value of deposits and other credit supplied to the banks, and the value of bank shares. It threatens the ability of the banking system to maintain the payments system. This is perhaps the more important reason to rescue a financial system from implosion. If left to its own devices a financial crisis could destroy the payments system causing incalculable damage to the economy.
The money multiplier and how it evolves for good and helpful reasons
King’s alleged alchemy is the fact that these deposit liabilities of the banks are, as may be easily observed, a multiple of the cash supplied to the economy by central banks. This money multiplier (the ratio of bank deposits to central bank money) sometimes described evocatively as “high-powered money” emerges when banks cover only a fraction of their deposit liabilities in the form of cash- notes or deposits issued by the central bank. These reserves of cash are to be found on the asset side of the balance sheets of banks.
The banking regulators usually impose a minimal cash to deposits reserve ratio on the banks. Banks for good business reasons would hold a cash reserve, even when not regulated to hold minimum balances. They would do so to guarantee the convertibility of their deposit liabilities- a prime attraction for the depositor. But given low rates of interest or zero rates of interest earned on their cash reserves they would always have an incentive to minimize such holdings of low return cash. Until the global financial crisis of 2008 banks typically kept minimal excess cash reserves- over and above required reserves. They relied on the ability to borrow cash from other banks or the central bank should they have to supplement their cash reserves, given some unexpected outflows of cash to customers or other banks.
No cash will be lost to the banking system, as opposed to an individual bank, when the loans made by one bank, when drawn upon to pay for goods and services or to pay rent, interest or dividends, end up as deposits with another bank- as they mostly do. That is the banking system will set off credits and debits in an electronic version of an old fashioned clearing house without suffering any net drain of cash. That is unless notes are withdrawn from the banking system should customers in general increase their demands for notes to hold in their purses or pockets. Or funds are transferred to banks abroad to settle in deficit of the financial accounts of the balance of payments.
It is the fraction of deposits that the banks hold as cash that sets the upper limit to the supply of deposits and the money multiplier. The smaller the fraction of cash reserves to deposits held by all banks the larger will be the multiplier. And the more the economic system relies on banks for making payments, as an alternative to cash payments and receipts, the slower will be the rate at which cash drains out of the banks. And the smaller will be the optimum cash reserve ratio.
Individual banks compete with other banks to attract deposits. There is no guarantee that the loans they make will return to them in the form of a deposit made by another customer to automatically fund their loan book. The funds loaned and used to fund spending are very likely to flow to other banks and lead to a claim on their cash reserves held with the central bank.
If the banks kept or had to keep full cover for their deposits – a hundred per cent reserve- against their deposit liabilities – there would be no money multiplier. There would also be no banks as we know them. Because without leverage and an interest rate spread there would not be enough reward for providing the payments system as well as cover the costs of attracting deposits. The access to a comparatively low-cost payments system- transferring deposits (now electronically) rather than delivering cash – is the essential attraction of a bank deposit. The interest spread between the rate offered to depositors and the rate charged to borrowers was used to compete down the fees that banks might otherwise have charged to make or receive a payment. Fees that might have limited the appeal of their deposits. And improved that of other banks offering a less expensive transactions service. The mixture of interest offered to depositors- perhaps even zero interest -was part of a bundled service that included the transaction facility.
By supplying deposits in exchange for cash a banking system serves to mobilise what would otherwise have been idle cash. Cash that would be held under the proverbial mattress and not pooled by a banking system able to extend credit. Surely such a development is helpful to economic growth because it adds to the rewards for saving – if only in the form of convenience and safety – and by adding to the supply of credit- makes it possible for others to borrow more?
Or put alternatively, the more developed a financial system – the more involvement in it by financial intermediaries including banks – the more debits and credits recorded in aggregate and relative to GDP – the more specialization of economic function is likely to follow. The decisions to save and the decision to add to the capital stock can be separated, encouraging more of both.
For their holders the deposit balances they hold with banks are naturally regarded as a part of their wealth -part of their portfolios, part of their bundle of more or less liquid, assets that make up their chosen portfolios. Their bank deposits are as much the result of decisions to save and not spend income as would be any decision to add to a stock of financial securities held by any wealth owner.
As Tobin and others demonstrated banks are but a class of financial institution that offers services to both savers (lenders) and borrowers (spenders) and intermediates between them. What makes banks different and important is more than their often-large share of the total market for financial assets and liabilities. This share is under constant competitive threat from other potential borrowers and lender- sometimes called ‘shadow banks”. It is the role banks play in facilitating payments that makes them a special kind of financial intermediary. A threat to a banking system becomes a threat to the payments system without which an economy could not function.
Banks can fail- so what should be done about such possibilities?
But banks can make mistakes as may any enterprise. They can fail if they make very poor lending decisions. Perhaps so poor that the losses on its loan book are enough to wipe out the equity on its books and on the stock market. Banks are usually very highly leveraged. That is the ratio of all their debts- including deposits – to their assets, is typically very high. Of which cash and other easily liquidated assets at predictable prices are but a small proportion.
The equity capital supplied by shareholders to fund bank lending may constitute as little as 10% per cent of their assets. This means that banks have little room for the mistakes, their non-performing loans with little market value. Such mistakes- poor lending decisions- can exceed the value of their equity and make a bank worthless to its shareholders.
The danger posed by banks to the system is not that they keep fractional reserves of cash to cover their deposit liabilities- hence the money multiplier -as Mervyn King appears to believe. The danger is that bad loans can destroy a highly leveraged bank. The losses made by a bankrupt bank may mean depositors and other creditors of the bank also suffer losses. It is leverage, not the money multiplier, that represents danger to the banks and the economic system that depends on them.
When the failure of one important bank threatens the solvency of other banks, who may be amongst its important creditors, more than the wealth of its creditors may be at risk. A banking crisis threatens the viability of the payments system that the banks provide and that is essential to the functioning of the economy. It is not so much that banks cannot be allowed to fail – it is the payments system that cannot be allowed to collapse. This would bring the economy down with the banks.
Any sustained run on the banks – for fear of depositors that they will not have ready access to their deposits- or because the value of their deposits is threatened by a banking failure- will bring the system down. Banks as we have indicated only hold a fraction of their demand deposits in cash to cover any rush by their depositors to cash in. The attempts to find cash by the forced sale of ordinarily sound assets will destroy the balance sheets of even the most conservatively managed bank.
The solution to any potential banking crisis is obvious enough- create enough cash to meet any panic demands for cash
There is only one solution to a widespread banking crisis. That is for the central bank to create as much cash as is required to allay the panic that there may not be enough cash to satisfy depositors and other creditors of all the banks in the system. Hence the quantitative easing (QE) practiced by the US Fed, the Bank of England, the European Central bank and the Bank of Japan in response to the Global Financial Crisis (GFC) of 2008.
QE made cash available in historically unprecedented quantities to the banks under siege after 2008. It represented a new very special case of central banks acting as lenders of last resort, as such a rescue operation would have been described before QE.
We show below how this money multiplier in the US (bank deposits/cash supplied by the central bank) collapsed after the global financial crisis (GFC) and quantitative easing (QE) The Fed issued very large additional supplies of cash to the US system- in exchange for government bonds and mortgage backed securities they bought from clients of the banks- who deposited the proceeds of such sales with their banks. The banks in turn added to their deposits with their central banks.
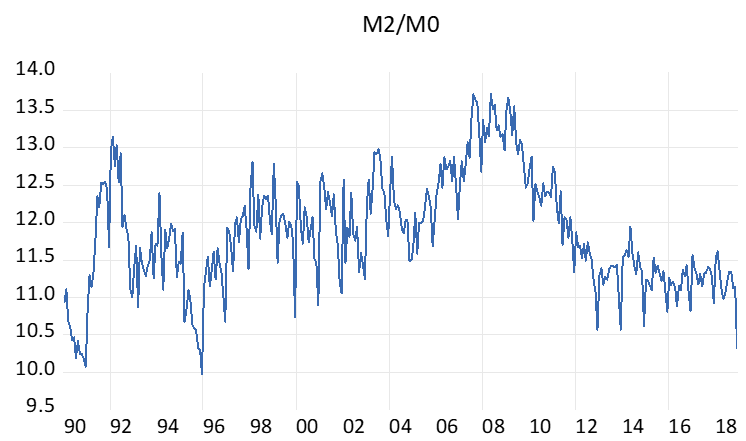
The reserves held by member banks with the Federal Reserve System grew from 10.5 billion dollars in July 2008 to $67.5 billion by the end of August 2008, the first round of (QE) – and increased further to a peak amount of 2.7 trillion dollars in March 2015, after further rounds of QE. The money multiplier, the ratio of broadly defined money M2 (mostly bank deposits ) in the US therefore fell from between 8 and 10 times central bank money before the crisis, to a low of about three times in 2014. (see figure 1 below)
As may be seen in figure 3 below, this growth in reserves were almost all in excess of the reserves the banks were required to hold, approximately 10b in July 2008.
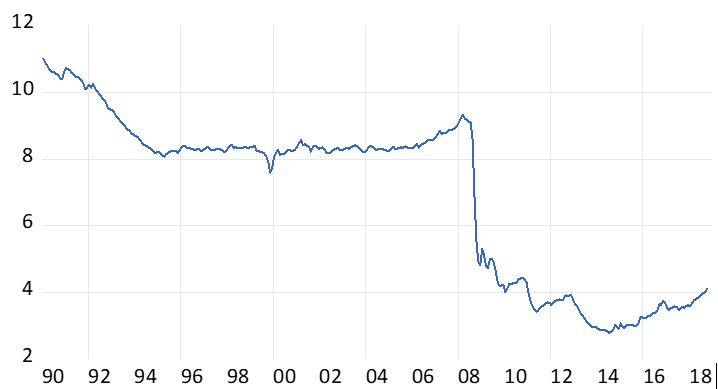
The money multiplier in South Africa has remained consistently at much higher levels. The SA Reserve Bank did not undertake quantitative easing. (See figure 2)
[1] The seminal Tobin paper is Commercial Banks as Creators of “”Money”, Reprinted from Banking and Monetary Studies,edited by Deane Carson, for the Comptroller of the Currency, U.S.Treasury (Homewood,Ill; Richard D. Irwin,Inc., 1963), pp 408-419. Reprinted in Financial markets and Economic Activity, Donald D. Hester and james Tobin, editors, Cowles Foundation for Research in Economics at Yale University, Monograph 21, John Wiley and Sons, New York ( 1967)
Fig.1; The US Money Multiplier (M2/Money Base)
Source; The Federal Reserve Bank of St Louis (FRED) and Investec Wealth and Investment.
Fig.2; The South African Money Multiplier
Source; South African Reserve Bank and Investec Wealth and Investment
US Money Base Currency in Circulation + Reserve Balances with Federal Reserve System
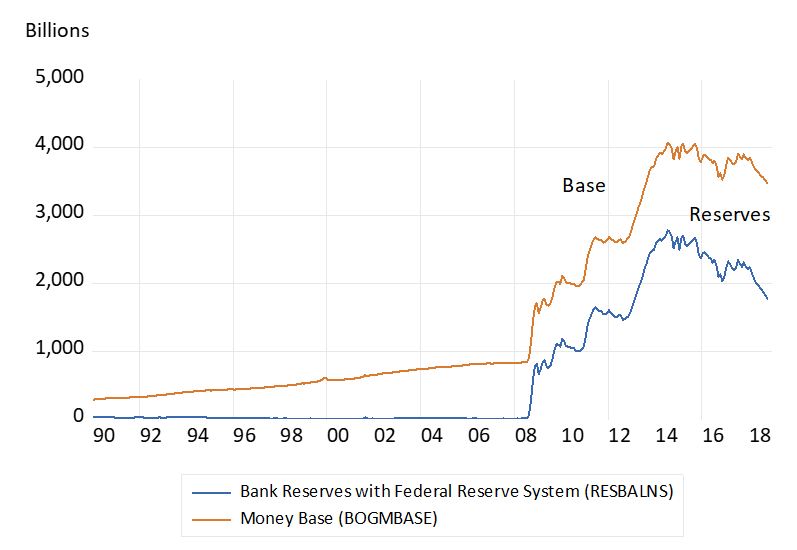
Source; The Federal Reserve Bank of St Louis (FRED) and Investec Wealth and Investment.
The demand for cash reserves by banks in the US increased as rapidly as did the supply of cash after 2008. By holding much more cash as a reserve against their deposit liabilities, the multiplier accordingly collapsed. The more cash the banking system holds the smaller will be any money multiplier. If the banks kept a 100% cash reserves to deposit ratio there would be no multiplier and no danger of a run on banks. But if 100 per cent cover of its deposit liabilities were demanded of banks so there would be no banks as we currently know them. That is banks that take deposits, transfer and receive them at the depositors instructions, and make loans utilizing and leveraging their deposit base to do so.
The quantity theory of money. Did it survive the test of QE?
The unpredictable increases in the demand for cash after 2008 may have disproved the quantity theory of money (QT). That is the based on the observation of many an episode in monetary history that an increase in the supply of money will lead, with variable lags, to proportionately higher prices. This has not happened if the supply of money in the US and elsewhere is defined narrowly – as central bank notes and private bank deposits with it.
But M2 in the US grew much more slowly than the money base. And so the defence or rejection of the quantity theory between 2008 and 2019 will depend on the definition of the money supply. If it is defined narrowly, the QT failed the recent test. If money in the US is defined more broadly to include deposits (M2) the QT can be said to have held up rather better. Since 2008 growth in the US money base has averaged 17.6% p.a, growth in M2, 6.2% p.a and inflation has been 1.8% p.a on average. (see figure below)
Fig.4; US annual growth in money base, money supply (M2) and consumer prices (Monthly data)
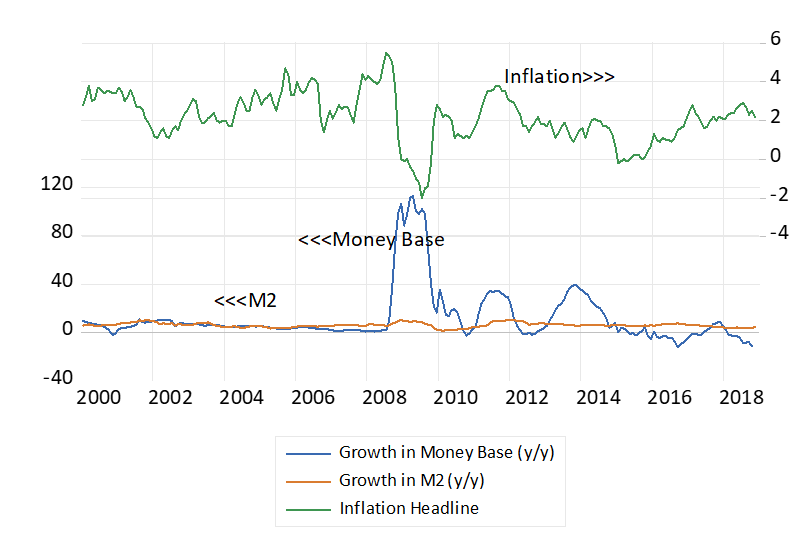
Source; The Federal Reserve Bank of St Louis (FRED) and Investec Wealth and Investment.
There is a very important difference between central bank and private bank money. The central bank – as an agency of the government- can create wealth by creating, printing money (cash) at close to zero cost. This additional supply adds immediately to the wealth of those holding the additional money supplied. But if the quantity theory of money holds, this extra wealth will be dissipated as prices rise. The monetary stimulus to spending becomes a temporary one until prices have risen in the same proportion as the money supply.
Prices will rise when the money is spent rather than held idle. It is the banks extra demands for idle cash reserves after 2008 that has meant not much more bank lending in the US and the spending associated with more lending. We show the differences in the growth rates of the US money base and M2 and consumer prices in figure 4.
It is changes in the supply of money and bank credit that matter – not the amount of money demanded and supplied.
It is not the level of the money supply, defined narrowly or broadly, or the size of the multiplier that can pose an inflationary threat to an economy. It is changes in the supply of money that can threaten inflation, or indeed deflation, should the money supply contract or grow more slowly than the output of goods and services. Usually the source of an inflationary increase in the supply of money will be the role played by government. Governments have the power, exercised through their central banks, to create “print” money that economic agents will accept. They may create money to fund their spending- as an alternative to raising taxes or competing fairly in the market for savings to help fund their budgets. They do so by forcing the central bank to make loans to the government that when utilized by government agencies end up as additional deposits made by customers of the banking system and as additional deposits held by the banks with the central bank. The money-multiplier gets to work with the injection of central bank cash into the system This increase in the money supply so created to initially serve a spendthrift government can be very rapid indeed. Rapid enough to induce hyper inflation as monetary history reveals.
The banking system, on a much more moderate scale, can contribute to money and credit creation by reducing their own demand for cash reserves in order to provide more credit. They may be able to borrow cash from the central bank to fund a larger loan book. They may lend, more or less, by lowering or raising their lending standards. Such developments deserve close attention by any central bank attempting to moderate the business cycle. But banks cannot create or have access to more central bank cash, unless the central bank agrees to supply them with more cash.
The necessity to keep a cash reserve limits the potential size of the money multiplier. And the central bank controls the supply of cash or perhaps more accurately the terms upon which cash is supplied to the banking system. An unlimited increase in the money multiplier or in the money supply cannot occur without government or central bank complicity. Banks cannot perpetuate inflation or deflation on their own- that is without the active involvement of a central bank.
Protecting a payments system from the danger of a breakdown
The challenge to the economy is how the payments system can be rescued and be expected to be rescued without encouraging the banks to take on undue risks with their lending and leverage that can eventually threaten the solvency of banks and the survival of the payments system. That is how can the rules that govern banking can help to avoid the temptation known as moral hazard. Or in other words encourage bankers to seek the rewards that may come with risk taking without depositors, shareholders and the bank management paying enough attention to the dangers of failure.
Insuring depositors against any losses they may incurr following a bank failure is in itself a kind of moral hazard. It relieves depositors from having to choose carefully between different banks to hold their deposits safely and thereby encourage banks to act responsibly- in order to attract deposits.
It is vital that the shareholders in a failed or recued bank must lose and expect to lose all their capital in their bank if it fails. Or be willing to raise additional equity capital enough to meet the claims of their creditors to keep the bank a growing concern. Such fears of loss would normally encourage a bank to manage the risks of non-performing loans with great care. As it would all the other creditors of a bank – including other banks that might be a source of funding.
If shareholders are unwilling or unable to recapitalize a failed bank the government can take over the bank and provide enough fresh capital to keep it and the payments system going. The government can realistically hope to recover its investment in due course. The rescue operation conducted for US banks included infusions of equity capital as well as cash. The recovery of its banks and insurance companies has meant good returns for tax payers money invested by the government- as might have been expected.
Any well governed banking and financial system needs a well-designed (legislated for) process that can be called upon on declaration of a financial emergency. The discretion to do so must be part of executive authority provided in advance. It must include well designed bankruptcy proceedings for banks that can be instituted at short notice. And they should include the certain prospect that shareholders and debt-holders and even bank executives will suffer significant losses should any emergency have to be declared. Claw backs of bonus payments made earlier to managers could be a further deterrent to excessive risk taking. Any certainty of how the system can and will react to the potential danger of a banking and payments shut-down itself will help secure the system. It should not be beyond our wit to design a financial rescue operation that hopefully will not need to be called upon. The best laws are those that are self-enforcing. Cricketers are very unlikely to be given out hitting the ball twice. They just don’t do it.
Safety does not come without a cost
Additional regulations forcing the banks to hold more equity capital as cover for their assets have been widely instituted. Forcing creditors of banks to accept in advance the possibility of a hair cut on the value of their loans to banks – or the compulsory automatic conversion of outstanding loans into equity- should a bank be unable to meet its obligations – can make banks safer. But avoiding the risks banks might otherwise take will inevitably reduce their expected returns and the useful lending role they might otherwise play in the economy.
Mervyn King would have banks hold a significant proportion of safe assets held in some kind of escrow account that can be sold off automatically should a bank have to be rescued. The problem with all such regulations designed to inhibit risk taking may reduce the profitability of banking enough to force banks out of business. Regulations that reduce profits – returns and risk – have a trade-off – it means less of what could be useful economic activity. The economy depends on its financial intermediaries as much as the owners and managers of financial institutions of all kinds – depend on a healthy economy.
Tolerating the discipline provided by market forces with back up in the form of credible and politically acceptable rescue plans for when markets fail- as they do occasionally and unpredictably – may be the right approach. Rather than introducing apparently fail-safe regulations and have undesirable consequences in the form of too little rather than too much credit supplied. It needs to be recognized by the broader society that financial crises may well happen but that we will know how to deal with them.
Will technology provide us with a very low cost fee based payments system that does not have to be combined with leverage?
Technology may be coming to provide a fee paying, low cost payments system that can be provided independently of any lending and borrowing and the interest spread and risks that come with leverage. Pure transactions ‘banks” that cover transactions balances with 100% cash reserves- held with the central bank- and that charge fees high enough to cover all costs, including a return on the capital invested, may change the nature of banking as we know it. And avoid any danger that the payments system can fail.
This brave or rather more cautious new world may be the next wave in the evolution of a financial system. That is provide for the separation of the payments system from the dangers of leverage. It would make banking failures much less dangerous than they now are because the payments system would survive. Wisdom would be to let the profit seeking competitive financial system evolve in response to the preferences of lenders and borrowers and for regulators to stay out of the way. Other than to design a predicitable rescue operation- that could be called upon in extremis – to save the payments system – not lenders or borrowers from the consequences of their own follies.
Mervyn Allister King, Baron King of Lothbury, KG, GBE, DL, FBA (born 30 March 1948) is a British economist and public servant who served as the Governor of the Bank of England from 2003 to 2013.
Born in Chesham Bois, Buckinghamshire, King attended Wolverhampton Grammar School and studied economics at King’s College, Cambridge, St John’s College, Cambridge, and Harvard University. He then worked as a researcher on the Cambridge Growth Project, taught at the University of Birmingham, Harvard and MIT, and became a Professor of Economics at the London School of Economics. He joined the Bank of England in 1990 as a non-executive director, and became the chief economist in 1991. In 1998, he became a deputy governor of the bank and a member of the Group of Thirty.
King was appointed as Governor of the Bank of England in 2003, succeeding Edward George. Most notably, he oversaw the bank during the financial crisis of 2007–2008 and the Great Recession. King retired from his office as governor in June 2013, and was succeeded by Mark Carney. He was appointed a life peer and entered the House of Lords as a crossbencher in July 2013. Since September 2014 he has served as a professor of economics and law with a joint appointment at New York University’s Stern School of Business and School of Law.[2]