Dealing with a financial and economic crisis – by creating money
This is the age of money creation. Money creation à outrance– to the limit – unsparingly[1] that began on a monumental scale in response to the Global Financial Crisis of 2008-9. (GFC) A new phase in money creation on an even greater scale has begun in response to the Corona Virus crisis. Or more precisely in response to the shutdowns of normal economic activity ordered by almost all governments. In the week ending April 10th the US Federal Reserve Banks, as an outstanding example, expanded its assets and liabilities sheet by an extraordinary 2 trillion dollars. It increased its assets and liabilities from approximately 4 to 6 trillion dollars or by 50% in one week. With more money likely to follow in the weeks ahead.
The recipe for curing a banking crisis has long been known- create more and enough money until the panic rush for money abates. It has been done this way many times before in response to one or other financial crisis. But it had never been practiced on the scale adopted after the GFC and now.
Analysing the balance sheets of central banks to find the sources of extra money
On the asset side of the Federal System you will find mostly securities issued by the US government. Its liabilities are mostly incurred in the form of deposits placed by member banks of the Federal Reserve System. The size of the Fed balance sheet has increased more than six times since 2008 – and it is set to rise much further.
These deposits with any central bank are money – central bank money – cash, if you like. Money that can be exchanged without limit for goods and services, other currencies and financial and tangible assets of all kinds. The cash so acquired by banks or others may also be used to make additional loans – bank overdrafts for example- or used to subscribe for new issues of securities offered by governments and businesses of all kinds, including other banks. They are money, because as with notes and coins of the realm, they would not be refused when offered in exchange for goods, services or other assets.
Whenever a central bank on its own initiative buys a security (a US Treasury Bill or Bond for example) or makes a loan to a bank or business, it settles the obligation to pay by crediting (digitally) its very own deposit accounts. In other words a central bank pays for whatever it wishes to buy, by creating its own money, at no extra cost to itself or the government of which the central bank is an agent. It may be described as a wholly owned subsidiary of the government.
A few additional observations are in order. When the central bank buys an asset directly from a bank, that bank will in the first instance deposit the receipts of the sale in its account at the central bank. The money supply increases accordingly. When the asset is sold to the central bank by another financial institution, other than a bank, the proceeds will first be deposited in its account at some private bank. The bank receiving an extra deposit from a client will in turn present the digital equivalent of a cheque to the central bank for settlement and will receive a credit to its deposit account with the central bank. Again the money supply increases in proportion to the value of the transaction.
When however the central bank lends directly to the government in exchange for a newly issued security or against an increased overdraft, as the UK government is now doing, the government deposit account with the central bank will be credited accordingly. This larger government deposit account is not immediately part of the money supply. It is only when the government account is drawn upon to pay for goods and services, and the transactions are banked by suppliers to the government does the money supply increase in the form of extra deposits of private banks banked with the central bank.
Modern money is only convertible into the self-same money
Modern so-called fiat currencies are however not convertible at any fixed rate of exchange into gold or other reserve currencies. Yet they are easily converted into goods, services, assets of all kinds including gold and other currencies at variable exchange values that are continuously determined in the various markets. The purchasing power of its money is therefore not at all certain. It may lose buying power if there is too much of it issued – that is when more is supplied than is willingly held as money. Money may gain value in exchange for other currencies if extra demands to hold the money press upon existing supplies.
Money is held very willingly for its convenience as a transactions balance or as part of some optimal portfolio of assets. It is the most liquid, most easily exchanged of assets, with a certain monetary value. Other assets are less certain in their future value, expressed in money of the day. Though fiat money does have not a certain real or purchasing power value when exchanged for goods or other currencies.
Money as an asset is especially desirable when the prices of other assets are expected to fall in value. That is when the risks of business failure or the prospect of higher interest rates, that may reduce the value of income earning assets, appear more likely. But the owners of money may at any time decide that they have too much money in their portfolios and too little of other assets that they might use their surplus money or cash to acquire. That switch in the composition of any portfolio of assets may be more likely when the supply of money is seen to be increasing rapidly. Money holders may well they fear that their money will lose value over time and accordingly reduce their holdings of it. And by so doing put more upward pressure on the prices of goods, services and assets.
Central bank money is mostly demanded and supplied to banks. Will they hold the extra money or use it to make loans?
The principle owners of central money are the banks. And while they hold notes and coins to meet the demands of their customers in their tills and ATM’s, their major holdings of central bank money will be in the form of deposits with the central bank. Deposits of banks with the central bank may exceed the supply of notes and coin that make up the money issued by a central bank. (see figure below on the composition of the Federal Reserve Balance Sheet)
The decisions the banks take with their holdings of additional central bank money supplied to and received automatically by them will be crucial to the outcomes for total lending and spending in the economy. Essentially the more of the extra cash received the banks prefer to hold as extra cash reserves, the less will be the repercussions for the wider economy. An increase in the supply of money accompanied by an increase in the demand to hold that money cannot lead to extra bank lending. That is to additional supplies of bank credit that can be used to fund additional expenditure. The buck stops there – literally.
But banks are in business to make money – that is profits – by keeping as little cash on their books – as is prudent – and putting their cash to work by making loans. They earn profits on the spread between the interest they pay on deposit and the interest they earn on their loan portfolio- their assets. These deposits, especially those used to make payments are a convenient substitute for the notes and coins issued by the central bank into which they can be converted on demand. They are also described as part of the wider money supply.
The banks therefore not only borrow and lend, they maintain the payments system the reliability of which is crucial for economic stability. They incur costs including wages and rents costs attracting deposits or other sources of funds and transferring them on instruction of their deposit holders. They incur losses should their loans go sour. But without taking some risk with their cash and capital in search of profits they could not hope to succeed in the banking business.
They are in the risky business of lending and borrowing. They are typically highly leveraged businesses in two important senses. The amount of cash they hold in reserve against their deposit liabilities that may be withdrawn without notice is a minimal one – the legal requirement may be as low as a 2.5% reserve of cash against deposits. Banks will also hold equity capital as a reserve to cover losses on their loan book. This reserve ratio is also regulated to be as much as a 15% capital to asset ratio.
After the GFC most of the banks of the world behaved very untypically. They held onto much of the cash and did relatively little extra lending. They held cash reserves far in excess of the regulated reserve requirements as may be seen of the US banks in the figure below. The supply of cash was increasing at enormous rate after the GFC. But so was the demand to hold those reserves. Perhaps because the banks had become very risk averse in the aftermath of the GFC and held much larger cash reserves to feel safer. They did moreover receive interest on these deposits from the Fed. Competitive with the low money market rates available. No doubt this was further encouragement to hold on to cash
Bank credit grew relatively slowly in the US after the GFC and despite the surge in central bank money. as did the deposit liabilities of the US banks which are registered on the other side of their balance sheets. Thus the increase in the supply of central bank money, sometimes known as the money base (MB) or M0, did not lead to any dramatic increase in bank lending and spending associated with such extra lending. It was not inflationary as it turned out.
Recent money supply trends
In the figure below it should be noted how the money base (M0) in the US peaked in 2014 and then declined rapidly in 2018 – as QE was reversed. In late 2019 it rose sharply again to support the banking system that was found unexpectedly short of cash that put unwanted pressure on inter-bank lending rates. The most recent Corona virus-inspired surge in the money base can also be seen. The supply of currency by contrast has increased at a very steady rate- in response to the demands for dollar bills- in and outside of the US.
Fig. 1; Liabilities of the US Federal Reserve System.
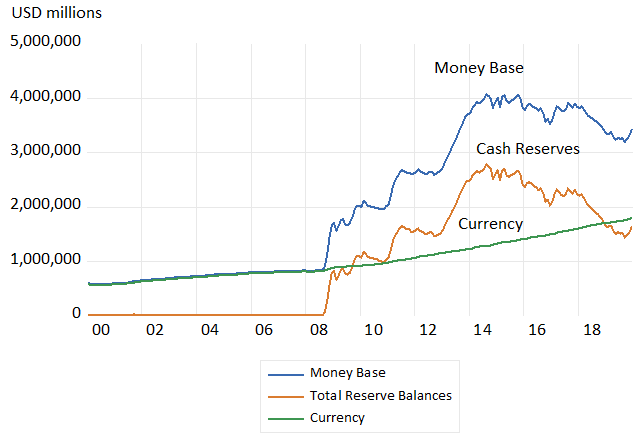
Source; Federal Reserve Bank of St Louis (Fred) Investec wealth and Investment
We show the asset side of the US Fed Balance sheet in the chart below. (figure 2) As may be seen most of the growth in assets – and liabilities – was the result of the Fed purchase of US Treasury Bonds in the capital market. The other assets of the Fed include loans made to banks and mortgage backed securities issued by government agencies.
Fig.2; Total Assets of the Federal Reserve Bank System and Holdings of Treasury Bills and Bonds
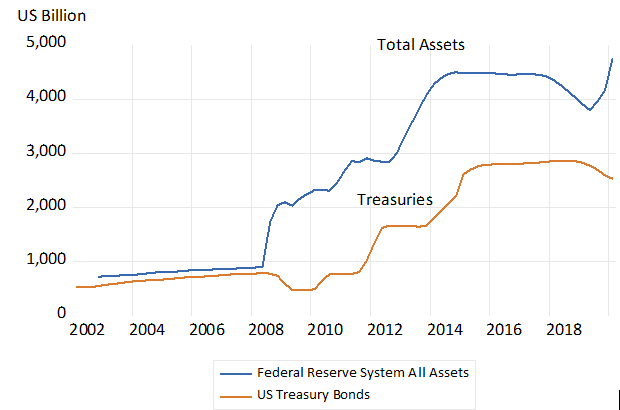
Source; Federal Reserve Bank of St.Louis. Investec Wealth and Investment
These Fed holdings of securities issued by the US Treasury have gained an important share of all the debt incurred by the Federal Government – currently the Fed share is around 12% of all US government debt – as we show in figure 3 below.
Fig.3; Federal Debt and US Government Debt held by Federal Reserve System
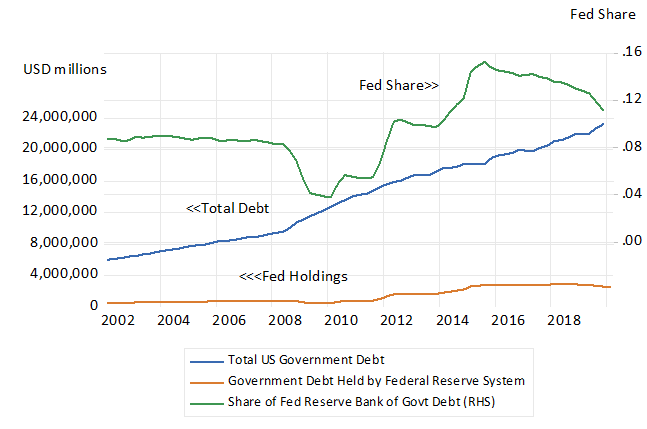
Source; Federal Reserve Bank of St.Louis. Investec Wealth and Investment
Increased Treasury Bond holdings of this magnitude have surely helped to reduce the interest rates paid on US Treasury Bonds. Since the Federal Reserve Bank of the US, while it keeps a separate set of accounts and balance sheet, is a wholly owned agency of the Federal Government. If we consolidated their balance sheets and set off the Reserve Bank’s holdings of Treasuries against the total Fed debt, we would reveal a reduction in outstanding Federal debt, replaced by the increased deposit liabilities of the Federal Reserve Banks. In other words cash – irredeemable non-interest bearing government debt – that is issued by the government or rather its central banks without interest – replacing interest bearing debt. Though, when the interest paid on government debt, short and long dated, is very low- close to zero- as it is now in the US – the distinction between debt and money is largely irrelevant from the perspective of the issuer incurring the liability and not paying (much) interest
Explaining why bank deposits are a multiple of central bank money- but limited by it.
Central bank money, currency and cash reserves in the form of deposits with the central bank can be described more evocatively as “high powered money”. This is because the bulk of the money held and used to pay for goods and services is supplied by the private banking system in the form of transaction balances (deposits) held with them and exchanged on the instruction of depositors. The loans and advances banks make may flow from one bank to another. But the money loaned mostly stays with the banking system. They arrive as deposits with other banks or even as another deposit of another customer of the bank making the loan. The funds lent, borrowed and spent do not drain away from the domestic banking system, except when withdrawn as notes or deposited in a foreign banking account.
It is the cash reserves held by banks that sets the theoretical limit to the sum of the loans in one form or another that the banks may make. It therefore sets the limits to the so -called money multiplier – the multiple ratio of broadly defined money – known as M1 M2 or M3 made up of bank deposits of various kinds from transactions balances to longer term deposits- to central bank money.
That ratio or multiplier as we show below was of the order of 14 times in SA M3/M0 or 8 times in the US M2/M0 before the GFC. It collapsed in the US to about 3 times as the demand of the banks to hold a much greater reserve of central bank money was exercised by the US banking system. It has increased recently to about four times the money base or M0. See figures 3 and 4 below.
South African banks by contrast with their US hold very little by way of excess cash reserves – cash reserves in excess of the regulated ratio- some 2.5% of deposit liabilities. Rather than holding excess reserves SA banks consistently borrow significant sums from the Reserve Bank to meet their demands for cash as we will demonstrate below. SA banks were not caught up short of cash in the GFC. They are now very much caught up in the crisis caused by the responses to the Corona virus. The loans they have made will not be easily serviced when their borrowers are not able to realise any revenue. Solvency and a lack of liquidity will threaten them as much in SA as it will do anywhere else.
Fig 4; South Africa Narrow and Broader definitions of the Money Supply and the money multiplier
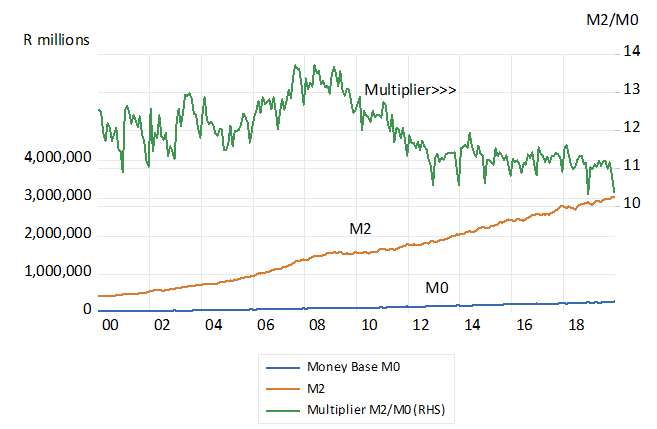
Source; SA Reserve Bank and Investec Wealth and Investment
Fig.5; US Money Supply and the money multiplier
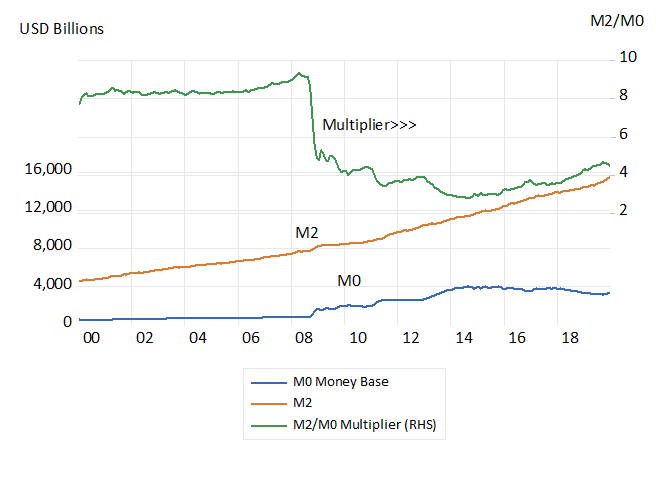
Source; Federal Reserve Bank of St.Louis. Investec Wealth and Investment
Private banks do not create money- they supply deposits that act as money at a cost – and not necessarily profitably
While these bank deposits can be measured as a multiple of the cash supplied to the system this does not mean that the banking system can “create deposits” in some magical, costless way. Supplying deposits to the system and maintaining the payments system to which a deposit account gives access, is a costly exercise. It takes computer systems and ATM machines and premises and people to manage the system and also equity capital that might be better employed in other businesses. And loans may not always be repaid. Banks may go broke if their bad loans exceed the value of their equity which may only be equivalent to 10-15 per cent of their loans and advances. And they may also go under if they cannot meet a run on the bank- a demand for cash in exchange for their deposits – which is their contractual obligation. Only the central bank can create money at will and without cost. The difference between private banks who supply deposits at a cost – and the central bank who can create money without cost is a fundamental one.
The limits to the size of a banking system- the aggregate value of its assets and liabilities -will be determined in any full analysis of the determinants of its size, by its profitability. Profitable banks grow their assets and their deposit liabilities – unprofitable banks shrink away. The profitability of a bank is enhanced by leverage – minimising as far as responsible its cash reserves and equity capital. Banks are typically highly leveraged businesses. But risk of failure in all enterprises comes with leverage and prudence may limit lending activity, and may have to mean larger cash and capital reserves, fewer loans and so reduced profitability and so a smaller money multiplier -as has been the case in the US since the GFC.
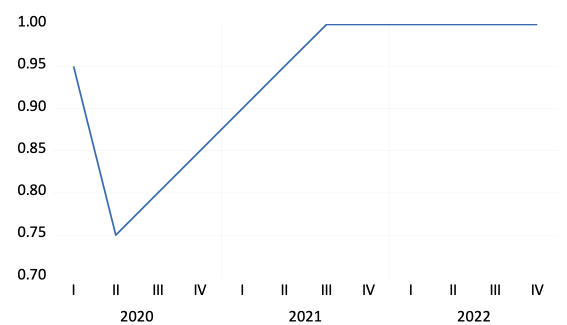
The habits of the customers of the banks, how much they prefer to use notes to make payments rather than accept bank deposits as payment, will also influence the cash reserve ratios of the banks and so the volume of their lending. The money habits of the community – a preference for money in the bank rather than in the pockets or purses or in offshore banks – may change only gradually over time- so limiting the growth over time in the banking system. The relative importance of a banking system might be measured as the ratio of bank assets and liabilities to GDP in money of the day prices. As may be seen in the figure below the real role of banking in the US and SA economies is not dissimilar- with M2 running at about 50 to 60 per cent of GDP. The SA ratio however increase markedly between 1980 and 2010. The US money to GDP ratio was stable even declining between 1990 and 2008, suggesting a relatively less important role for banks in the US economy, but has increased in since the GFC as may be seen in figure 6 below.
Fig.6; The Money (M2) to GDP ratios in SA and the US. Measuring the real importance of private banks.
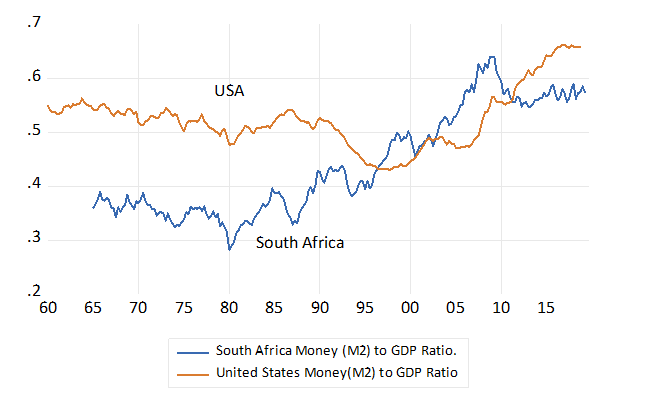
Source; Reserve Bank of SA, the Federal Reserve Bank of St.Louis and Investec Wealth and Investment.
An economy depends on a thriving profitable banking system – able to support growing businesses with convenient credit and a payments system. Zombie banks – undercapitalised banks -that survive only on government and central bank life support – are not helpful for economic growth. They are poorly capitalised because they have not earned enough income to retain cash with which to augment their reserves of equity capital.
Furthermore it should be appreciated that every deposit made with a private bank represents a real saving – of consumption spending – however temporary. Banks pool these savings to make them available to borrowers. Money in the bank is as much a saving- a reduction in potential spending out of income or wealth – as a contribution to a pension fund. It is a more liquid form of saving, they are savings more easily cashed in for goods, services or other assets at a certain money value. Cash is an important component of any wealth portfolio and part of the working capital of any business.
However what is true of the deposits of a private bank that act as money in competition with the notes issued by the central bank – that they are costly to produce- is not true of the cash issued by a central bank. Such cash is almost costless to produce and can be supplied in unlimited quantities. It is convertible only into the same government sanctioned cash.
Why not fund government spending with cheap money? Responses to QE as the exception not the monetary rule.
Why then should any government restrain the amount of money it creates that costs so little to produce? Why do governments fund their deficits from the market place rather than via their own central banks? The value of a currency that can be issued without limit is based on a trust that it will retain to a least some degree, or at least temporarily retain its purchasing power, that is its value in exchange. Otherwise it is not very useful.
The limits to issuing money, is that issuing too much of it – more than would be willingly held as a reserve of purchasing power – is that the money created would consistently and even rapidly lose its value in exchange. That is it would cause inflation – defined as a continuous increase in the price level – and a persistent decline in the foreign exchange value of the currency and its purchasing power. This is usually not a politically popular outcome and so it is to be avoided. Hyper inflation is moreover highly destructive of the real economy.
Economies may adapt to moderate inflation- say inflation that runs between five and fifteen per cent per annum- especially if the rate of inflation though high becomes predictable. But inflation trends may easily slip higher should government come to rely more permanently and heavily on printing money rather than raising taxes or borrowing in a genuine way in the capital market. Inflation and currency depreciation would follow should the supply of central bank money consistently exceeded the demand of the public and the banks to hold that central bank money as a reserve.
QE after 2008—09 representing an extraordinary increase in the global supply of central bank money did not cause inflation because much of the extra cash issued was willingly held by the banks. Had the banks used the extra cash to make additional loans the supply of deposits (money broadly defined) and the supply of bank credit would have grown proportionately – say at the eight times multiple normal before the GFC. And spending would have grown much faster than it did with the aid of much more bank credit and prices would have risen much faster than they did. Thus it is not the supply of money that automatically leads to more spending and higher prices. It is the excess supply of money- central bank money- over the demand to hold that money that causes bank credit to increase and prices to rise.
Time will tell what use is made of the extra cash created to fight Corona Virus. Will it be held mostly as additional cash reserves by the banks? Or will it stimulate a burst of extra bank lending and a multiple creation of deposits and a rapid expansion of bank credit and the extra spending associated with freely available bank credit? That is prove more inflationary than QE was last time round- post the GFC? The reactions to QE in SA – the scale of it and the trends in money supply and bank credit will be of particular interest.
The case of SA – how much QE will and should be undertaken?
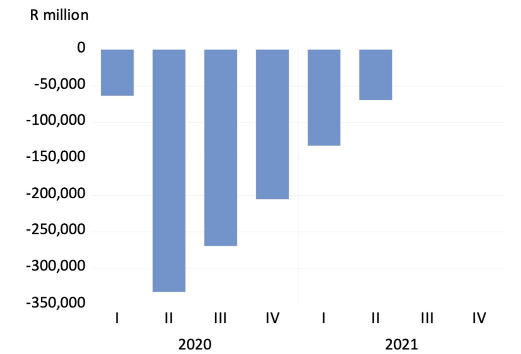
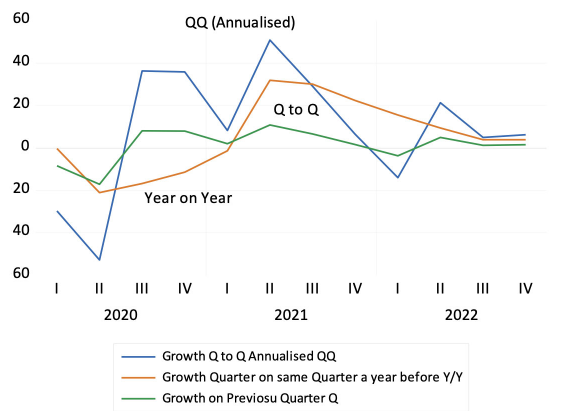
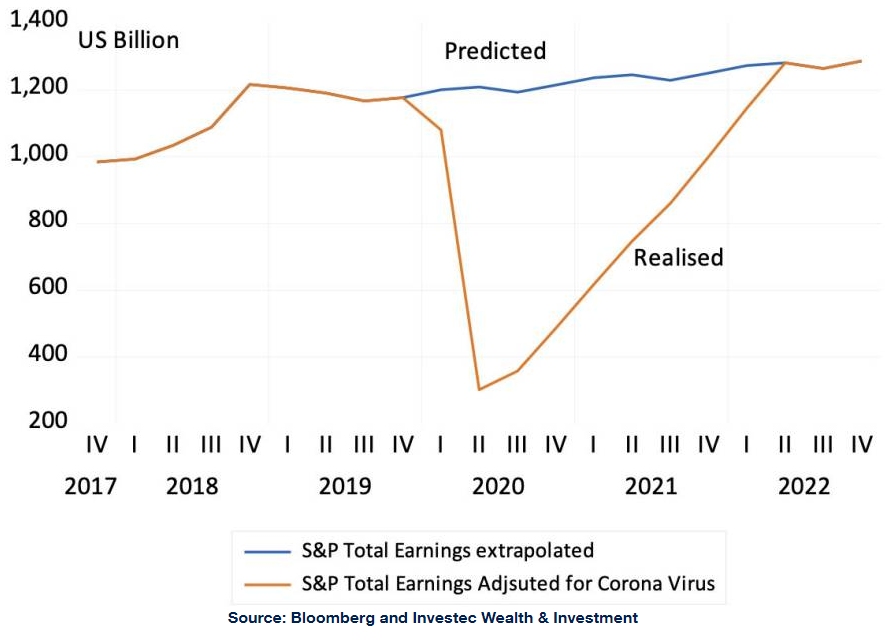
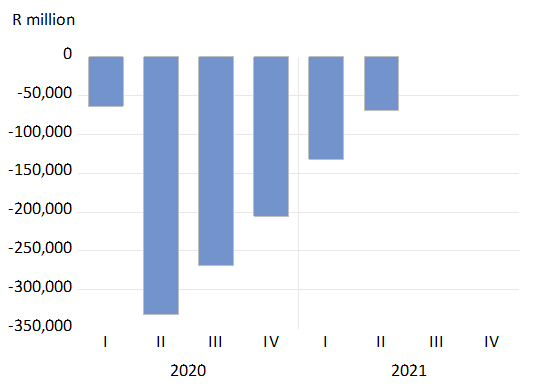
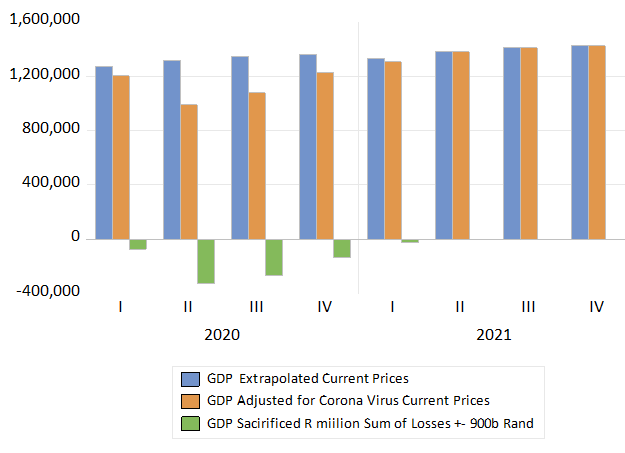
There is no doubt that a large gap will open up in South Africa between the output and incomes that might have been produced without the lockdowns and what will be produced. The output gap will be a very large one. Perhaps the equivalent of 25% of one years GDP will be sacrificed to the cause of defeating the Corona virus. It will be a very large loss to bear. And much like the losses to be incurred in all the economies subject to lock down.
How much income will actually be sacrificed will depend in part on how much the SA government spends on relief measures and how much the Reserve Bank supports the government and private sector with extra cash. The more support provided to the economy in one way and another by the government and the Reserve Bank, the more demand for goods and services can be exercised and the smaller will be the eventual loss of output as supply responds as best it can. Any reduction in economic damage of the large likely order expected is a clear gain to the economy. Given the size of the output gap and a general lack of demand for goods and services, inflation in SA is very likely to remain subdued. This surely a time to be concerned about the lack of output and incomes, not that prices may be rising faster at some time in the future.
Any additional utilization of what would otherwise be wasted capacity- human and material- comes without real economic cost. That extra demand can bring forth extra supplies would be pure gain to the economy, especially if funded with central bank money. The Keynesian argument for extra spending by government, funded as cheaply as possible, holds very strongly when supply and demand in the economy can be confidently predicted to decline significantly- as it will in SA during the lock down.
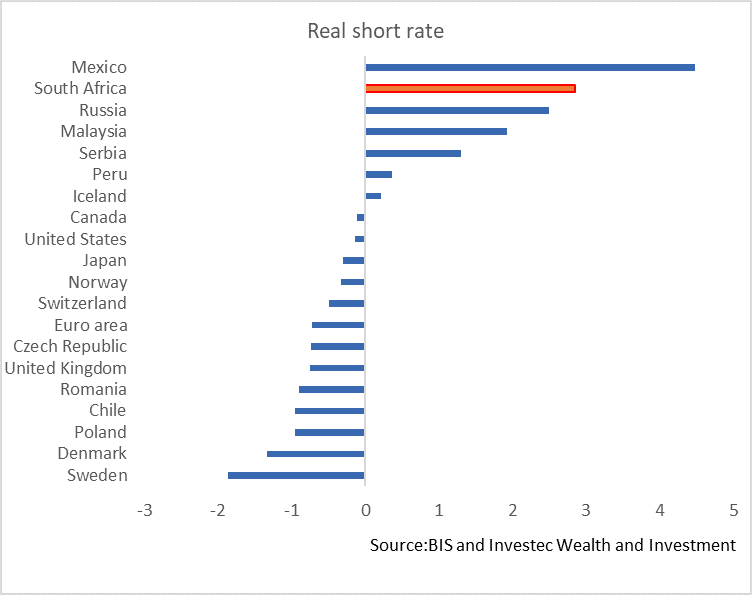
It is not clear that the Reserve Bank sees the SA predicament in this same urgent way. In the way central banks in the developed world are recognizing the role they can play and acting accordingly. The SA Reserve Bank has every opportunity to create more of its own money without any cost. In order to help borrowers, and to assist the banks and the government, but also to support hard pressed private businesses through its lending programmes. Unlike its peers in the developed world it also has scope to significantly lower short-term interest rates. All the way close to zero would make sense to help make up some of the output sacrificed with the lock down.
The Reserve Bank should not be hesitating to act boldly. Any inflation that may come along later with a recovery in the economy will have to be dealt with in its own good time. Money created can be as easily removed from circulation when the economy has closed its output gap. And a wider fiscal deficit can be temporary rather than permanent when economic normality is regained. The case for the SA government to limit its spending and fiscal deficits over the long run remains as strong as ever. But not for now. It calls for calm wisdom and good judgment. Unusual times call for unusual responses. Let us hope the SA Reserve Bank is up to the challenge.
[1] As described by Keynes. John Maynard Keynes was the originator of depression economics. He provided the justification for governments to spend more to overcome a lack of spending that caused the great depression in the nineteen thirties. And for which there appeared no self-correction. He inspired a highly influential school of economics known as Keynesians. His argument for stimulation through government spending rather than monetary policy was that interest rates could not fall far enough to encourage enough capital expenditure. But he never, as far as I am aware, advocated printing money to fund extra government spending. While logical enough to use money to fund government spending if the depression was a deep one, he knew such a proposal would be politically unacceptable. For fear of inflation of the Weimar republic that was not far from memories in the nineteen thirties when Keynes developed his ideas..