A growing number of employers have insisted that their employees must come back to their work- places. Elon Musk, has demanded that Tesla or Space Ex staff spend at least 40 hours in their offices and that those who do not want to do so “…. Should pretend to work somewhere else…” He also wrote “Tesla has and will create and actually manufacture the most exciting and meaningful products of any company on Earth, this will not happen by phoning it in.” Many other firms, feel the same disillusionment.
WFH is an option – not a compulsion. But an option modern technology has now made possible in ways that were not possible before. Homework was hardly unknown before. Writers, composers and artists as well as weavers and sewers, home bakers, worked from home long before the gig-workers who congregate at the internet café. You may you noticed how the coffee mavens all look up from their laptops to appraise the new arrivals? Seeking company no doubt that they could find at the water cooler.
Being able to measure accurately the relationship between how they reward their employees and how much they contribute to the output and profits of the firm is an essential responsibility of any business. It could not hope to survive without accurate calculations of the costs and benefits of alternative working arrangements. And the firms faced with WFH preferences have been learning by doing as they always do.
It can be assumed with great confidence that the great majority of employees will be paid no more or less than the value they will be expected to add for their employer – be it from the office or home. Furthermore, as clearly, nobody will be rewarded for the time they spend commuting. It is paid for in income or leisure sacrificed by the commuter. Recent evidence that the revealed willingness to go back to the office in the US is inversely related to the time spent commuting is no surprise. The lucky winners from the enforced lockdowns have been those who to live far from the office – that they chose to do for – their own good reasons – pre the lockdowns.
Employers are not the only party with the right to choose where best to work. Workers will make their own choices. The ratio of job openings to work seekers in the US has never been higher and the opportunity to work from home has not been greater this century.
The Tesla office worker who has remained in California, even though the Tesla office is now in Texas, may well tell Elon what to do with his job. They may even accept a lower salary to WFH – the cost of the commute is their bargaining chip. As is the saved rental and all other not at all insignificant costs of supplying an office desk that may improve their case to WFH. They may even be able to do two jobs from home- as many do- given the time freed up and the absence of supervision or whistle blowers. Elon and other collaboration mindful employers may have to offer a premium to get the preferred workers to the office- if they are more productive there.
The individual households who choose where and how they live will help determine how the world of work will look in ten years or more. The developers of offices and homes and retail space will respond rationally to the choices and ongoing experiments of all those who hire and supply labour of all kinds- billions of decisions will prove decisive. The world of work and production evolves continuously, usually in an imperceptible way, to the signals provided from the market for labour. There is no design – just efficient outcomes. Employers no longer requiring office workers to attend on Saturdays, or offering extended annual holidays, are not providing charity but are making a considered response to market forces- necessary to attract workers of the right kind and at the right price. They will continue to respond accordingly.
The responses to the opportunity to work from home that technology has made possible- and made the lockdowns possible – will evolve sensibly and rationally. Provided freedom to choose is respected as the essential ingredient for a successful, highly adaptive economy.
The financial markets have been roiled by the prospect of recession in the US. The market makers fear that the Fed, having allowed prices to explode in the US will now reverse course abruptly enough to bust the economy. They are right to worry.
Managing the level of demand in an economy well enough to exercise the full potential of an economy – and to avoid continuous increases in the price level, inflation, or its opposite deflation, is a central bank ideal. The more stable the environment, the more accurate become the plans of business, the more predictable their earnings and their values- and vice -versa.
The reality is often very different. The proclivity of central banks to exaggerate the swings of the business cycle is a constant danger to businesses and investors. In some senses the fear of recession may be more disturbing than recession itself. Were a recession to seriously threaten the US economy any time soon, policy determined interest rates in the US would not rise as much and soon go into sharp reverse and equity and bond valuations would rerate on improving prospects. Sell the rumour (of recession) – buy the facts (a recession itself) might well be an appropriate strategy for turbulent times.
The intention of central bank policy interventions should be to smooth the business cycle, avoiding booms and busts – while containing inflation. Central banks can hope to do this by anticipating and then influencing aggregate spending- over which they claim influence. And to ignore temporary supply side shocks (exchange rate or food or energy price shocks for example) that may also cause prices to rise and fall.
Policy settings should not add higher interest rates to the downward, recessionary pressures on demand when prices have risen temporarily. Or vice versa when the supply side of the economy (lower prices) are stimulating demand to lower the cost of credit to push spending still higher. Navigating successfully between supply side shocks- with a temporary impact on the price level – to be ignored – and actions that could cause continuous rises in prices, permanently excess spending- to be actively countered is the true art of central banking. Highly relevant also for the SA Reserve Bank that wrongly believes temporary price increases lead to permanently higher inflation.
The impact of an extraordinary surge in demand to counter Covid on prices, led by an even more extraordinary increase in the money supply, should not have been anything like the surprise it was inside and outside the FED. The growth in the money supply (M2) peaked at an mind blowing 27% in early 2020. Any sense of monetary history would have regarded much more inflation as inevitable.
The Fed and market watchers had been lulled into ignoring the growth in the money supply and bank lending by years of modest and declining growth in the money supply since 2010 – with declining rates of inflation. Though this record is not without serious blemishes. The run up in money and bank credit growth prior to the GFC should surely have been avoided- as should the abrupt decline in money growth that exaggerated the post GFC recession.
US Money Supply (M2) growth and inflation 2000-2022
Source; Federal Reserve Bank of St.Louis and Investec Wealth and Investment
The Fed should be paying the closest possible attention to the current trends in money supply and bank credit growth and set its interest rates accordingly. It should be aiming to stabilize money supply growth at about 6% a year- consistent with average inflation of 2% a year as was the case to 2019. And to reach that goal – from the current 10 to 6 per cent p.a. growth – as gradually as possible. It should communicate clearly that both money supply and prices are heading in that direction. And that higher prices have already restrained the demand for goods and services.
The marketplace should be paying the same close attention to the growth in the money supply and in bank lending as a leading indicator of the state of the economy. Readings sharply below 6% p.a. growth in the money supply will give ample warning of trouble to come.
Monthly % Growth in US Money Supply (M2) and Consumer Prices
Global stock markets have done well for investors over the years. We look at what will be required for them to continue to do so.
The compounding growth of the West is powered by business enterprises and savers share in the wealth created.
The economic history of Western economies is an admirable one. Their standard of living has been transformed over the past 200 years by consistently positive year-by-year growth in output and in incomes per head, despite the rapid growth in population over the same period. And all of this was achieved despite the destruction of life and capital, buildings and valuable infrastructure by periodic wars. The Russian war in Ukraine is an awful reminder of how destructive war is. It will take many years of sacrificing consumption – of saving and productive investment in capital equipment and infrastructure – to make up for these losses.
Privately owned businesses are responsible for much of the growth in incomes earned, and in the extra goods and services supplied to the western economies over time. Their most decisive stakeholder is the consumer of this growing cornucopia of goods and services that they produce. Their owners earn a surplus after all contracted-for costs of production have been met and revenues have been collected. There is the risk of a loss, though a growing economy makes losses less likely. More efficient businesses will also compete on the prices for and quality of goods and services they provide their customers, at the possible expense of the revenue line. Improvements in the productivity of capital will be widely shared.
A stock exchange enables the ownership rights in larger businesses to be widely and conveniently shared and traded. It provides the average saver the opportunity to plug into these surpluses and the wealth-creating machine of immense force that is business enterprise, mostly via their pension and mutual funds. These widely dispersed owners have realised much more wealth creation than they would have done by investing their savings in the money market, bank deposits or in the bonds and bills issued by governments. And they would have done even better had they further postponed consumption and reinvested the dividend income they received, as well as conserving their capital gains by staying in the stock market.
The JSE, very much part of a global capital market, has provided comparably excellent returns over the many years of its existence and has repeated the performance this century. As illustrated below, the average annual total returns with dividends reinvested from the JSE since 2000 have been nearly twice as high as the interest earned on cash and paid out: 13.5% annually vs 7.6% annually. The compounding effect has been so powerful because the returns on extra capital invested by privately owned businesses have been so positive. Economists therefore go further, given past performance. They regard these high expected returns over the long run, as part of the cost of capital employed. They add these higher expected returns to the returns that should be required of any company contemplating an investment decision. It is called the (expected) equity risk premium. If the proposed project cannot promise to leap over this higher hurdle of required returns on capital, the advice is not to go ahead.
JSE All Share Index, with or without reinvesting dividends, and money market returns (three-month Johannesburg Inter Bank Rate) (2000 = 100)
Source: Iress, Bloomberg and Investec Wealth & Investment, 9 May 2022
JSE All Share Index total returns vs cash (three-month Johannesburg Inter Bank Rate) 2000 to 2021
Source; Iress, Bloomberg and Investec Wealth & Investment, 9 May 2022
It is not only returns that matter – so does risk. Human nature says (expected) return and estimates of risk are positively related.
So, the obvious conclusion would seem to be to invest in the stock market, since, based on past experience it can be expected to perform well in the long-term, even if there are some short-term blips. It is these short-term blips however that discourage investment in the share market. Between 2000 and 2021 the annual total return on the JSE was 13.5% a year and that provided by the money market was a much less 7.6% a year return on average. However judged by the movement about this average return, the JSE was nearly seven times as risky, as measured by the standard deviation about these returns (see figure above) – the risk that your shares may be worth much less in a few days or months, when you might be forced by circumstances to liquidate your wealth. This can be a major deterrent to share ownership.
The greater the risk aversion, the less comfort wealth owners and potential share owners have in the outlook for assets, the less time they wish to spend in the stock market, the less valuable businesses become. And the greater will be the risk premium earned by those willing and able to stay in the stock market. Bearing extra risk will likely bring extra returns because the entry price to the share market is reduced by the risk aversion of other potential investors. It has been true of the share market over the long run and market volatility, or risk, is likely to continue to negatively influence the long-term value of shares, so improving realised rates of return for those with an extended time in the market.
Albert Einstein famously described the power of compounding interest or returns as the “eighth wonder of the world,” saying, “He who understands it, earns it; he who doesn’t, pays for it.” This powerful force of low-digit exponential growth, of growth compounding on growth, year on year, is well demonstrated by the long-term ability of the major stock exchanges to grow wealth for shareholders in a consistent way over the same long run.
It is the return on owners’ capital that is the source of all interest income
But where do these good compounding share market returns come from? From businesses who are entrusted with much of the accumulated savings or wealth, described as capital employed in any market-led economy. The owners and managers of businesses are incentivised to husband scarce capital, as best they know how. The rate of return they realise on the capital employed, the productivity of that capital, is the foundation upon which all rewards from saving and owning capital or wealth is built. Firms experiment continuously in improving the return on the capital they utilise. They aim to improve the relationship between the cash value of the resources they invest in, called operating costs and what comes out as revenues, and they apply their fixed and working capital to the purpose. The results of such efforts are measured, hopefully in a consistent and comparative way, as return on capital employed inside the firm. The rewards for savers who supply the firms with capital to invest, come not only in the form of dividends paid, but in offers of interest payments that firms are able and willing to make to attract capital, in competition with other firms for the same potentially productive capital.
The less risky interest income offered by all other borrowers, the banks and the government, is therefore strongly influenced by the same return on capital realised by the business enterprise that employs a large proportion of the capital available. The banks, the money market funds, or the government as a borrower, would not offer the interest they do, unless the firms were able to earn a positive rate of return on all the capital they utilise and have to compete for. This includes competing for the overdrafts and mortgage loans provided by banks and other financial intermediaries. The higher the expected real returns from all the capital employed in businesses, the more competition from firms for additional capital to invest, the larger will be the real rewards for all saving. Be it named interest or dividends or lease payments or capital gains depending on the financial arrangements agreed to between suppliers and raisers of capital.
The internal return on capital is what is converted into market value and market returns
It is the positive internal rates of return on capital realised by the business enterprise, not share market returns, that reveals the productivity of the capital it employs. The share market in turn translates expected internal returns on capital into current share market values. The market value of the firm should be understood as the present value of future operating or cash surpluses over operating costs, expected from the firm, discounted by the required returns expected from likely alternative investments. The most valuable firms in the market-place – measured as the ratio of its current market valuation to current earnings or better current cash flows – are those firms that are expected to consistently improve their internal returns on capital and to add more capital by doing so. In other words, they are expected to consistently improve the productivity of capital they utilise and are able and willing to attract more capital, both loan and equity capital, to realise the growth opportunity, and to successfully hold the competition at bay that always threatens prices and operating margins.
The two measures of performance (the internal and market returns) are likely to be highly correlated over the long run. But such present value calculations made by the buyers and sellers of shares in companies are subject to considerable uncertainty from day to day and week to week or quarter to quarter. There is uncertainty about flows of revenue, operating costs and returns from alternative investments that determine the discount rate. There are more than enough unknowns to make estimating the future value of a firm or a market of them, a risky business. Risky returns help to direct savings to the lower return, less risky alternatives, for example to cash or cash like assets.
Knowledge (technology) improves the productivity of capital. Will it continue to do so, and will shareholders receive as valuable a share of the surplus generated?
The force that has driven the extraordinary and consistently unpredicted improvements in income and wealth and in the supply of goods and services delivered, is the success of technology and its application by the business organisation in sustaining and improving the (internal) return on capital, year by year and decade by decade. From railroads to electricity to the motor car, computers and the internet, technology has provided the opportunity to improve returns on capital and increase incomes and wealth, of which a large part is held in the form of shares of companies. A further explanation for consistently good returns to capital over time is perhaps that technology has consistently delivered more than most investors thought technology would deliver over the last two centuries. Stock markets have done so well because the productivity improvements from innovative technology have been at least what the market hoped they might deliver, and consistently delivered at least the productivity enhancements that it is expected to deliver, and typically considerably more. We have had few technology disappointments and technology has overwhelmingly surprised on the upside.
Will technology continue to consistently surprise on the upside in future and benefit the owners of the representative business enterprise and its customers and employees (and government treasuries) in the same way it has done over the last 200 years? There are some caveats.
Productivity has been dramatically driven by improving and ever cheaper computer power. Moore’s law, which predicts that computer power per dollar invested in a chip will increase at an exponential rate, has been shown to be approximately true for around 50 years. But such increases in the power of computer chips must necessarily face physical limitations because of the finite nature of matter.
Similarly, can one assume that the efficiency of food production will continue to improve at the rates it has in the past? The finite resources of planet earth may put a brake on the pace of technological improvement (unless we extend ourselves by settling the planets and beyond, and investing in knowledge itself may defeat the law of diminishing returns). Moreover, will humanity attach as much importance to increasing further our command over goods and services through productive capital expenditure as much as we have in the past and tolerate the share of output going to owners of capital as we have in the past? Capital and its application may be given a lower priority and if so, growth rates will subside.
That the SA economy has performed quite as poorly as it has in recent years is not easily explained. The rate of growth of less than 2% a year represents a very poor outcome, with alas little prospect of any lift off, according to the economic forecasters in and outside government. Yet there are more corrupt economies with much less of an endowment of capital and skills that grow faster.
Fixed capital formation and employment offered by private businesses is at best in a holding pattern – capital formation being maintained at levels first reached in 2008. Capital formation by the public sector is in sharp decline- necessarily so – given past performance. The unwillingness of SA business to invest in future output and income generation and in their workforces – describes slow growth – but does not explain its causes. Such reluctance needs to be understood and addressed if the outlook for the economy is to improve.
Fixed Capital Formation Constant 2015 Prices
Source; SA Reserve Bank and Investec Wealth and Investment
Total Real Fixed Capital Formation (2000=100)
Source; SA Reserve Bank and Investec Wealth and Investment
We need look no further for a large part of the explanation of unusually slow growth than to the disastrous failures of the SA public sector. South Africa relies heavily on the State as a producer of essential services, including electricity, water, transport, ports and education. More heavily than is wise or necessary. The inability of Eskom to meet depressed demands for electricity clearly sets limits to growth as do the failures of Transnet to run the railways and ports anything like competently.
These operational failures have meant very large amounts of wasted, taxpayer and consumer provided capital and opportunity. The relationship between what has been spent on the large new electricity generating stations Medupi and Kusile and what has come out as additional electricity is especially egregious and damaging. As much as 1.1 trillion rands was invested in electricity, water and gas between 2000 and 2021. Much of it in electricity generation. Shockingly, almost unbelievably, the real output of electricity etc. has declined by 20% since 2000.
Electricity, gas and water. Capital Formation; Constant (2015) and Current Prices
Source; SA Reserve Bank and Investec Wealth and Investment
Electricity, gas and water. Capital Formation and Valued Added 2000- 2020. Constant 2015 Prices
Source; SA Reserve Bank and Investec Wealth and Investment
The abject failures of other government agencies – of the provinces and in particular municipalities – to maintain the quality of the essential services they are tasked to provide, water, roads, sewage, building plans, education training and health care etc. has become ever more destructive of the opportunities open to business and households. Such failures are also reflected in the declining real value of the homes South Africans own –a large percentage of the wealth of the average household – which has made them less able and willing to demand additional goods and services from SA business.
Hopefully the economy will not stay on these destructive paths. Restructuring the ownership and incentive structures facing the public sector is an obvious and urgent requirement for faster growth- for more capital formation of the human and physical kind. As is reducing the reliance on the public sector to deliver the essentials.
But we need a meta explanation and understanding of why the public sector has failed South Africans so particularly badly to move forward. The key political objective on which the public sector leaders were evaluated was clearly not the efficient use of resources, with quality of delivery related rewards, within sensibly constrained budgets. The Scandinavian model, if you like, did not apply. The primary objective set the new leaders of the public sector – and for which they were presumably judged and rewarded – was the transformation of the racial character of the public sector workforce.
It is an economic truism that you get from people (managers and workers) what you pay them for. This key performance indicator, transformation, has been achieved with huge waste, financial and in foregone opportunities. Losses that were exaggerated by the opportunities the lack of attention to the costs of operations, and their value to consumers, offered for theft, fraud and the patronage of the incompetent.
The continued enthusiasm for demanding that the private sector to transform further and faster seems uninhibited by any comparison of the cost and benefits of forcing transformation. There is perhaps one consolation in all this- the private sector cannot ignore the bottom line in the way the public sector was able to do for so long.
A growing number of employers have insisted that their employees must come back to their work- places. Elon Musk, has demanded that Tesla or Space Ex staff spend at least 40 hours in their offices and that those who do not want to do so “…. Should pretend to work somewhere else…” He also wrote “Tesla has and will create and actually manufacture the most exciting and meaningful products of any company on Earth, this will not happen by phoning it in.” Many other firms, feel the same disillusionment.
WFH is an option – not a compulsion. But an option modern technology has now made possible in ways that were not possible before. Homework was hardly unknown before. Writers, composers and artists as well as weavers and sewers, home bakers, worked from home long before the gig-workers who congregate at the internet café. You may you noticed how the coffee mavens all look up from their laptops to appraise the new arrivals? Seeking company no doubt that they could find at the water cooler.
Being able to measure accurately the relationship between how they reward their employees and how much they contribute to the output and profits of the firm is an essential responsibility of any business. It could not hope to survive without accurate calculations of the costs and benefits of alternative working arrangements. And the firms faced with WFH preferences have been learning by doing as they always do.
It can be assumed with great confidence that the great majority of employees will be paid no more or less than the value they will be expected to add for their employer – be it from the office or home. Furthermore, as clearly, nobody will be rewarded for the time they spend commuting. It is paid for in income or leisure sacrificed by the commuter. Recent evidence that the revealed willingness to go back to the office in the US is inversely related to the time spent commuting is no surprise. The lucky winners from the enforced lockdowns have been those who to live far from the office – that they chose to do for – their own good reasons – pre the lockdowns.
Employers are not the only party with the right to choose where best to work. Workers will make their own choices. The ratio of job openings to work seekers in the US has never been higher and the opportunity to work from home has not been greater this century.
The Tesla office worker who has remained in California, even though the Tesla office is now in Texas, may well tell Elon what to do with his job. They may even accept a lower salary to WFH – the cost of the commute is their bargaining chip. As is the saved rental and all other not at all insignificant costs of supplying an office desk that may improve their case to WFH. They may even be able to do two jobs from home- as many do- given the time freed up and the absence of supervision or whistle blowers. Elon and other collaboration mindful employers may have to offer a premium to get the preferred workers to the office- if they are more productive there.
The individual households who choose where and how they live will help determine how the world of work will look in ten years or more. The developers of offices and homes and retail space will respond rationally to the choices and ongoing experiments of all those who hire and supply labour of all kinds- billions of decisions will prove decisive. The world of work and production evolves continuously, usually in an imperceptible way, to the signals provided from the market for labour. There is no design – just efficient outcomes. Employers no longer requiring office workers to attend on Saturdays, or offering extended annual holidays, are not providing charity but are making a considered response to market forces- necessary to attract workers of the right kind and at the right price. They will continue to respond accordingly.
The responses to the opportunity to work from home that technology has made possible- and made the lockdowns possible – will evolve sensibly and rationally. Provided freedom to choose is respected as the essential ingredient for a successful, highly adaptive economy.
Much notice is being given to the disruption of supply chains by lockdowns and by war in Ukraine. With hindsight, producing more of the essential components in-house or holding larger inventories to avoid relying on just-in -time delivery would have been a superior, that is less costly choice to have made. But very few firms are fully integrated. The steel mills are likely to outsource their sources of coking coal and the gold mines their sources of power -for obvious reasons- outsourcing is expected to be cheaper. A continuous comparison will be made of the expected costs of in or outsourcing all the different operations that lead to the final delivery of any product or service supplied. Such decisions help to determine the optimum size and scope of any enterprise. Less can well be more for shareholders.
All firms are defined by some mixture of in-house activity and goods and services contracted for. Even the accounting and human resource function may be outsourced to specialist service providers as easily as the company canteen. Decisions to outsource may hopefully mean a better focus on what are properly understood to be the essential ingredients for any thriving business. The objective should be to be realistic and prescient about how best to release the key competencies that make the firm competitive and are its essential reason for being and surviving. Strategic decisions to insource that make the firm larger and less specialised – or outsourcing to other firms- that makes it smaller and more specialised – cannot be outsourced.
Technological change alters the optimum size of any firm. That the decision to outsource the IT function to the computer cloud is seen as the right decision now, would not have been feasible twenty years ago. Then firms with heavy demands on data collection and processing would have had no choice but to invest in mainframes and tinker with legacy systems with large in-house IT departments. That may be very difficult to abandon. The operators in the cloud can reduce the danger of excess or deficient computing capacity by attracting a well-diversified customer base. The market share gains of one customer can offset the losses of another competing with it, so adding to the predictability of the demand for an outsourced service or component. Such a pooling of business risks can be a great driver of economies of scale and allow the concentrator to offer competitive terms to a more specialised operation.
A similar explanation fits the component manufacturers who supply a variety of competing assemblers of appliances or automobiles whose core capabilities may be in the design and marketing of their badges – not in in-house manufacture at which they may not excel. Every entrant into the burgeoning electric vehicle industry is having to answer the important question – how much of our production could or should we outsource? The answer Tesla provided- producing its own batteries in its own very large factories with very substantial and fixed overhead costs – may no longer best serve the purpose. The enhanced scale of the specialist provider may also facilitate R&D on a scale that any inhouse department could not justify and could leave the integrated firm behind in the development of intellectual property – that can be hired on reasonable terms from the inventors. Firms no longer have to run their own warehousing and distribution systems. The delivery of goods produced is increasingly outsourced to specialist logistic providers who can deliver more cheaply or more conveniently to a variety of customers than can a firm hope to do running its own trucks and warehouses. They can fill the return legs. Sales online to a global market have been made possible not only by the internet but by outsourcing delivery to the specialised courier.
These opportunities to outsource essential inputs in production or service provision are a huge boon to the entrepreneurs whose barrier to entry was traditionally limited access to capital- understandably – given their unknown potential. By outsourcing – by staying lean and capital light and highly focused – the start-up’s plans to compete become more viable. Good for them their customers and very good for the economy that hosts them.
The Quarterly Labour Force Survey released this week provides estimates of employment and unemployment that are way beyond the norm for developed economies for which employment surveys are designed. They come as no surprise. In Q4 2021, 262,000 more jobs were provided in SA compared to the quarter before, while an additional 278000 more workers were declared unemployed, taking the unemployment rate marginally higher to an extraordinary 35.03%. The SA labour force is estimated as 22.4 persons, of whom 14.5 million are working and 7.9 million are actively seeking work. The labour force represents but 57% of the working age population (ages 15-65) which leaves 17 million adult South Africans not economically active
There is more to the depressed employment statistics in SA than slow growth. In 2000 there was 40% more persons employed per unit of GDP than there were in 2000. These latest estimates continue to show employment in SA lagging well behind GDP. Employment has flatlined at about 94% of their pre-lockdown levels. GDP by contrast fell sharply to 84% of its pre-Covid levels by Q2 2020, but has since recovered to 98.3% of its pre-Covid level.
Employment and GDP (2019=100)
Source; SA Reserve Bank and Investec Wealth and Investment
The ratio of employment to GDP (2019=1)
Source; SA Reserve Bank and Investec Wealth and Investment
How are these employment statistics, particularly the unemployment estimatesto be interpreted and reconciled with estimates of income and expenditure in SA? Part of the problem with estimating unemployment, especially where the unemployed are not simply and conveniently measured when collecting unemployment benefits, is that the unemployed are largely self-defined in SA. One may be not working, yet very willing and able to work at short notice and indicate as such to a telephone enquiry from Stats SA and so be classified as unemployed. But such a respondent (perhaps in a rural area) may only be willing to work for rewards that are unavailable and unrealistic to expect. Hence such a potential worker is not part of the labour force and more accurately should be regarded as not economically active, not as unemployed. South Africa may have an employment problem – not an unemployment problem on anything like the same scale.
The more the consumption power provided to households in kind and cash, other than via income from work, the higher will tend to be the wage that would makes it sensible for potential workers to supply and accept employment- what economists describe as the reservation wage below which it makes little sense to supply labour. Welfare benefits provided by the taxpayer, housing, medical care and cash grants, education, or help provided by an extended family, all help to raise the wage rates that employers have to offer when seeking a supply of workers. The tragedy is that so few South Africans qualify for the well-paid decent work offered by employers that would, if available, encourage many more of them to actively join the labour market. The excluded workers should blame the failures of the education system to qualify them for the decent work and accompanying benefits that formal employers mostly prefer to provide.
South Africa chose to address poverty with welfare rather than by encouraging employment. It was a humane response and SA was economically able to redistribute consumption power on a meaningful scale. But it has had consequences. The more generous the welfare system, the better the employment benefits that have to provided by firms seeking labour, the higher will be the level of wages and so the fewer workers employed. South Africa’s recent economic history of improved welfare and a smaller proportion of the population employed confirms this prediction. There is a negative relationship between the price of labour and the demand for it, even if denied by the economists (nogal) who advocate and regulate higher minimum wages.
Yet higher wages have also much encouraged the supply of and demand for immigrant labour who arrive in SA with lower reservation wages determined to support their families earning and transferring income to them. And who are more easily hired because that can be more easily fired. The unregulated, employment intensive sectors of the economy are heavily populated by migrants – perhaps unknown and un-estimated millions of them – many working illegally. And whose employment status will not be answered with a phone call. The employment problem is concentrated on South Africans with access to welfare benefits. How many are employed in South Africa is an unknown
Fiscal and monetary policy in the US and SA will command close attention in 2022. The US will be expected to adjust to the success it has had overcoming the Covid threat to its economy. Success has led to excess in the form of much higher rates of inflation. Larger fiscal deficits, that approached 16% of GDP in late 2020 were incurred to supplement incomes with checks drawn on the Treasury has seen the Federal debt to GDP ratio rise to 128% of GDP. Consequently the ratio of money (bank deposits) to incomes (GDP) is now 25% higher than they were before Covid. This huge stock of money will continue to be exchanged for other assets and for goods – and services -when the time is right. The money will not go away – it will merely lose more of its real value as prices – including asset prices – rise further at the inflation rate.
It is a question of how much and how quickly interest rates go higher to restrain spending. Longer term interest rates may rise should inflation be expected to rise permanently to higher levels – which is not yet the case. The problem with higher interest rates is that they have important fiscal implications. Paying higher market determined interest rates to keep the bond market open to issues of more government debt – takes away from other spending – it may demand higher taxes or less government spending – not well suited to make governments popular.
The US, given the currently low cost of raising debt, remains in a favourable fiscal setting. The average yield on all federal debt is below 2%, while the debt service ratio – the ratio of interest paid to the Fed budget – is below 9%. It was about double that rate in 2000 when the debt to GDP ratio was about 50% Every-one per cent increase in the average cost of funding the US debt, means an extra 250 billion dollars of interest to be paid out – on top of the current 500 billion payments. It will require a resolute, politically independent and inflation fighting central bank to tame inflation. (see figure below)
US Fiscal Trends
The comparisons of SA with the US are not alltogether unfavourable. The national debt to GDP ratio is much lower – only about 60% The debt-service ratio is significantly higher equivalent to 13% of the national budget. it was over 20% of the budget in 2000. The average yield on all RSA Treasury debt has gradually fallen to about 6%. It was 10% in 2008. (see figure below) SA and the US – some fiscal comparisons
Source; Federal Reserve Bank of St.Louis, South African Reserve Bank, Investec Wealth and Investment
The SA Reserve Bank did not (wrongly in my view) do quantitative easing. The broader money supply has hardly grown at all since early 2020. The money to GDP ratio has fallen back to where it was before Covid. (see below) There is no excess demand.
South Africa and the US – some money and GDP comparisons
Source; Federal Reserve Bank of St.Louis, South African Reserve Bank, Investec Wealth and Investment
Of further relevance is that SA Government Revenues have been growing significantly faster than government expenditure. Thanks to the global inflation reflected in higher metal and mineral prices leading and much improved and taxable mining incomes. Both monetary and fiscal policy settings therefore remain austere. They explain why the economy is growing so slowly. South Africa Fiscal Trends
Source; South African Reserve Bank, Investec Wealth and Investment
The problem is that our market determined credit ratings have remained unchanged and our cost of raising long term debt very expensive. The RSA pays about 8% more for ten-year money than the US. Even more discouraging is the extra real 4% we offer on long dated inflation protected bonds.
SA Interest rates and risk spreads
Source; Bloomberg, Investec Wealth and Investment
Every-one per cent move in our government borrowing costs- would be worth an extra R37b a year to the Treasury. Lower interest rates would also reduce the returns required by businesses and help revive what is a very depressed rate of capital expenditure. The world of bond investors demands compensation for the danger that SA will sooner or later confront a debt-service trap from which printing money, and the accompanying debt destroying inflation, might be the preferred escape. They are much more generous to the US.
It is fundamentally the failure to grow faster that puts government revenues and Budgets at risk. The best SA can do this year to lower borrowing costs would be to sustain smaller fiscal deficits. And for the Reserve Bank to recognize that growth- not inflation – is the SA problem- and to set short-term interest rates accordingly. To help keep debt service costs down and improve the government revenue line.
Cadre deployment is to be expected everywhere. Incoming US administrations do it as a matter of course. But why have so many of the most influential of the SA cadres proved so very fallible, as revealed in full gory detail by Zondo.? It is the leaders after all who set the standard. That crime may be expected to pay, given kickbacks to the right places, is part of an explanation. Short-term horizons “ if I don’t take advantage then my insider competitors will do so” may help explain some of the observed behaviour. There has been no lack of competition for the material opportunities offered in the South Africa that have gone well beyond what could be regarded as decent salaries and other employment benefits. Including the generous rewards provided for serving on the boards or management teams of the semi-autonomous government boards responsible for regulating private conduct. Of which many became notorious for providing opportunity for shopping/conference trips abroad and for contrived multiple Board meetings, for which valuable hourly attendance fees are unnecessarily charged.
The key posts in SA government departments and agencies turnover very rapidly with changes in the direction of the political winds – so paranoia of those in office is not irrational. The large financial gains observed coming from BEE – without any obvious relationship between input and benefits realized – may be a further influence. That you become be fabulously rich when lucky in your partnerships –obtained through your political connections rather than your observable efforts or skills – and through doing business with government on highly favourable terms because of these connections – is morally debilitating. And indicates for wide notice that competence or dedication is not necessarily rewarded nor essential to the purpose of getting on in life.
Repeat business is the most valuable source of sales and profits for any business. It helps to keep their owners and workers honest and competitive striving to enhance valuable reputations for fair dealing. Governments departments or agencies however have monopoly power. A trust in their good practice is to be heavily relied upon. It is a trust demanded of those teaching a class, serving in a public hospital or in a police or border post enforcing the law. Yet we need them at more than they seem to need us. We wait in line or on-line patiently and smile obediently. We are not customers but supplicants of the government agencies with great influence over us. Imagine life without a passport, visa, vaccination certificate or a driving license, a good education, or a well-organized casualty ward? We would like to believe that the public servants are trying as hard as they know how, to please us. Because that is the right respectful way.
Unconstrained self-interest cannot fully explain what has gone on in SA. It calls for explanations made better by psychologists. philosophers or historians than economists. Do we understand the derivation of the values that determine the culture of the workplace? Can we explain how a sense of honour, honesty, patriotism or duty is developed to help set the reasonable and realistic expectations of the supplier and user of services of all kinds? Helpful attitudes and good performance are encouraged by a strong sense of vocation- a sense of a job worth doing well. For what are widely recognized as appropriate material rewards that can be well understood and accepted by all parties involved. How are they cultivated? They are part of the implicit employment, or what can be understood more broadly, as a social contract. The best standards do not emerge overnight and should be actively cultivated. Ethics has to be well taught.
When regimes change and the power structures change radically with it, a strong sense of life changing opportunities can become overwhelming and corrupting. The large gains achieved in SA via misgovernment have been highly very damaging to the incomes and prospects of most South Africans. It will take acknowledgement and understanding of it as the path to an agreed much improved moral order and stronger economy. It calls for a new social contract, the hope for a Zondo inspired devotion to doing your duty for fair reward and for obeying and enforcing laws justly made and deservedly respected. A community of those wanting to give service rather than take unfair advantage of their favoured status could become the new morality.
It is crunch time for most central banks – but not the SARB. Inflation rates escaped them and recapturing inflation will not be a comfortable or comforting exercise. Rising prices, rising wages and the prices of other inputs, can be very clearly blamed on the usual suspect- more money created than has been willingly held by households, business and banks. Excess money holdings (deposits at banks) have been exchanged for goods, services and other assets enough to raise their scarcity value. And supply has been unusually slow to respond to the unexpected strength of demand.
It will take higher interest rates and a sharp deceleration of the rate of growth of the money supply to reverse inflation trends. It will demand less be spent and borrowed by governments and more tax collected. Paying interest will account for an ever-larger share of government budgets to constrain the much more agreeable benefits that might otherwise be provided by governments.
Their further problem is that higher prices are part of the adjustment economies make to an excess of demand over supply. Higher prices have causes- they also have effects- they help absorb and restrain demands while they encourage additional output. Higher prices reduce the ability of households to spend and less spent may well register as temporarily slower growth – slow enough to make central bankers more hesitant to act. But if they fail to act they may encourage more inflation expected that will show up in higher long term borrowing costs.
A further complication is that there is a great deal of money sitting on the sidelines waiting to enter the markets. The ratio of money relative to income (GDP) in the US has exploded since the Global Financial Crisis and in response to Covid. There is now 80% more money – mostly in the form of bank deposits – per unit of income – than there was in 2008. A ratio of close to one to one between income and money was very much the understandable case before the GFC and before the brave new world of Quantitative Easing (central bank money creation on a vast scale) was discovered. A new money/Income equilibrium will have to be established in the US – a mix of higher prices and less money added will have to bring this about.
The commercial banks play a large role in determining the supply of deposits, through their lending. And they have vast reserves of cash to convert to loans if they choose to do so in response to demands for credit to expand the money supply further. The last time the Fed reversed QE in 2015, to shrink its own balance sheet, the balance sheets of the commercial banks continued to rise as they reduced their cash holdings in exchange for other assets. They may do so again. It might take very much higher short term interest rates to discourage them.
Assets of the US Commercial banks and the Federal Reserve System 2008-2021. Monthly Data Billions
Source; Federal Reserve Bank of St.Louis (Fred) and Investec Wealth and Investment
We have a clear case of monetary excess in the US and too much monetary constraint in SA, an explosion of the Money/Income ratio in the US and a contraction in SA. Enough to infer that the relationship between money and incomes has undergone a systemic change – in an inflationary direction for the US and contractionary one for SA.
The US and SA – the Money to Income Ratios. (2007.4=1) (Quarterly Data)
Source; Federal Reserve Bank of St.Louis (Fred) South African Reserve Bank and Investec Wealth and Investment
The sense of systemic change in SA is reinforced by a comparison of growth rates in money and income before and after the GFC. Growth rates were much higher and far more variable before 2008. They have declined significantly since. The Fed will have to tighten up to control inflation and the SARB should lighten up to facilitate faster growth for which enough money- not too much and not too little- is essential to the purpose.
South Africa; Growth in Money Supply (M3) GDP and Prices ( Quarterly Data)
Source; Federal Reserve Bank of St.Louis (Fred) South African Reserve Bank and Investec Wealth and Investment
Introduction – monetary developments before and after the GFC and Covid
Reports on the death of the Quantity Theory of Money now (February 2022) appear highly exaggerated. The extraordinary burst of additional money issued by the Fed intended to ameliorate the damage to incomes and economic activity caused by the Covid inspired lockdowns of March 2020 have been followed by a surge in inflation. The increase in the prices facing consumers in the US was running at over 7% p.a. by the end of 2021 The inflation of 2021 appears to have surprised all observers other than the near extinct tribe of monetarists.
While inflation rises across the globe, South Africa’s monetary and fiscal authorities should take note of the weak state of demand locally.
Prices are busting out all over the world. Prices charged by all US producers are 20% higher than they were a year before. Consumer prices were up by a ‘mere’ 5% in August, and that was before the recent tripling of natural gas prices.
US headline inflation rates (annual percentage growth in consumer and producer prices)
Source: Federal Reserve Bank of St Louis, Investec Wealth & Investment, 6 October 2021
US headline inflation rates (monthly percentage growth in consumer and producer prices)
Source: Federal Reserve Bank of St Louis, Investec Wealth & Investment, 6 October 2021
The cause of higher prices is clear enough. They are a response to buoyant demands stimulated by Covid-inspired extra government spending and central bank funding of much larger fiscal deficits that have dramatically increased the supply of money (bank deposits) held by households and firms. In the US, these savings have also reduced the incentive for people to get a job – of which there is an unusual abundance, as firms struggle to match surprising strength in demand with extra output and willing workers.
This mixture of strong demand with constrained supply has caused prices to rise. The effect of higher prices is also predictable. Higher prices reduce demand while they serve to encourage extra output. They also act as a drain on disposable incomes and spending power. Higher prices, particularly when they respond to supply side shocks, can therefore lead to slower growth as these higher charges work their way through the economy.
What is critical therefore for the control of longer-term inflation trends is how the monetary and fiscal authorities react to this slower growth. Should they attempt to mitigate the impact of higher prices on growth by stimulating demand for goods, services and labour, then the temporary surge in inflation can become longer lasting. Firms and trade unions will then budget for expected and uncertain inflation.
Central bankers believe that inflation depends on inflation expected, modified by the state of the economy. Independent central banks accept responsibility for the state of demand, but they hope that inflation expectations are anchored at low rates, to make their task of containing inflation an easier one. The markets, to date, have largely believed that the observed rise in inflation is a temporary one. But the markets will be watching the reactions of the fiscal and monetary authorities closely for signs of the policy errors that can turn a temporary supply side shock into enduringly higher inflation.
South Africa – not a typical case
It is striking how the South African economic circumstances have not been typical. We too will have to deal with an energy price shock that will depress demand. But demand already remains depressed. Particularly depressed since 2016 have been the demands of firms, including the public corporations, for plant, equipment, workers and credit.
Real gross fixed capital formation by type of organisation
Source: Stats SA, SA Reserve Bank, 28 September 2021
Households have helped to sustain spending, but only a little. Total spending by households grew by 1% in the first quarter of this year, but only by half as much in the second quarter. Those in jobs have earned more, yet many more (over a million) have lost their jobs since the lock downs. Formal employment outside agriculture is now below 2009 levels.
Formal non-agricultural employment
Source: Stats SA, SA Reserve Bank, 28 September 2021
The money supply has flat lined as nominal GDP has grown strongly. The closely watched government debt-to-GDP ratio has been further reduced by extraordinary growth in government revenues. Tax receipts have accelerated in response to the global inflation of metal prices that make up the bulk of South Africa’s exports; so much so that the total borrowing requirement of the government in all its forms has declined from 13.5% of GDP in the first quarter of last year to as little as 1.8% of GDP in the second quarter of this year. Fiscal austerity has been practised in Covid-ravaged South Africa. And monetary policy, judged by its effects on money and credit supply, has not been accommodating enough.
Money supply and gross domestic product
Source: Stats SA, SA Reserve Bank, 28 September 2021
The output gap – the potential supply exceeding realised spending – is likely to remain persistently wide. Inflation expectations therefore remain unaltered. The case for higher interest rates to further depress demand seems weak in the circumstances. Yet the gap between short- and long-term interest rates has widened further in recent days. This implies an expected doubling of policy determined rates over the next three years.
The slope of the SA yield curve (SA 10-year yields minus money market rates)
Source: Bloomberg, Investec Wealth & Investment, 6 October 2021
The bond market indicates that any improvement in South Africa’s fiscal circumstances is sadly expected to be temporary rather than permanent. It can prove otherwise with fiscal discipline and sympathetic monetary policy.
The markets for industrial and precious metals are demonstrating some important truths. The price of iron ore, approximately USD 92 dollars per ton this week was more than twice as high, 200 dollars, in early July. Its price is as hard to predict today as it was a year ago when it sold for a mere USD85 ton. The pace of the recovery of the global economy after the lock downs was unusually unpredictable and proved surprisingly strong to increase the demand for steel and iron ore and other industrial metals. It is an expected slow down in global growth rates and so in the demand for steel and other industrial metals in the months to come that has caused prices to fall back as surprisingly.
It should be recognised that there is no predictable cycle of the price of any well traded metal, currency, share or bond to assist timing an entry or exit to the market. Were there any regular cycle of prices or indeed of economic activity, that is a predictable trend towards peak growth rates, followed by a slower growth then a recovery from the trough – it would greatly help traders, producers or consumers to sell at the top and buy at the bottom. But such cycles are only revealed well after the events. They are the result of smoothing the data, comparing the outcomes to what occurred a year before, when almost all of the numbers overlap. Day to day, the data looks very different and the future of prices will not be at all obvious. They unfold as a random walk, with most prices having an almost 50% chance of rising or falling on any one day.
The annual and daily % movements iron ore spot price. USD per tonne.
Source; Bloomberg and Investec Wealth and Investment
Whether these random moves are drifting higher or lower to establish some persistent trend will only be discovered well after the event- perhaps only a year later. All we can attempt – and there is no lack of such attempts – is to model the forces of supply and demand that will determine prices or quantities in the future – as rationally as possible. And perhaps be bold enough to believe that your model will prove more accurate than the opinions revealed by current prices- that we know will vary with the news.
What happened in-between last year and now to the price of iron ore and similarly to the value of the platinum group of metals has had important consequences for the SA economy. They greatly boosted the SA balance of payments, tax revenues and the GDP. Dependence on capital inflows have become large contributions from South Africans to the global savings pool of over USD100billion p.a. as the foreign trade balance improved. Tax revenues have been growing well ahead of budget projections, approaching an extraordinary extra R250 billion of taxes, if maintained over a year.
And the GDP in current prices has risen almost as high as long term interest rates to help reduce the debt to GDP ratios. Yet long term interest rates remain at very high levels and are still particularly high relative to short rates, implying a doubling of short-term interest rates in three years- which would be very bad news for the economy. It is very difficult to make sense of this view of SA interest rates and monetary policy.
While annual growth rates may well have peaked, there is a lot more global demand still in the wings. Post-Covid stimulus continues to this day. The market judgment may be too pessimistic about demand and so prices and revenues may continue to be helpful for resource companies and the SA Treasury that shares in its profits.
How then should SA and resource companies react to such a further windfall? The answer should be obvious. That is look through any temporary surge or reduction in revenues and for the companies to pay out the unexpected extra cash to share or debt holders. For the Treasury it would be to spend no more and borrow less. The benefits to both parties in the form of lower long-term costs of raising capital would be large and permanent.
Affirmative action programmes get in the way of competition for resources and promote economic in-efficiency. They assist a minority of favoured participants in the economy, easily identified, and harm the many more, mostly of the same pigmentation, who pay higher prices or taxes and earn less and sacrifice potential employment opportunities. Costs and opportunities foregone that can only be inferred – because it is so difficult to isolate the influence of one force amongst the many forces – that determine economic outcomes. BEE in SA can have a powerful influence on the direction of economic policy itself. The very valuable rights to participate as essential BEE partners in government initiatives drives the policy agenda itself.
The incentives that encourage previously disadvantaged South Africans to acquire ownership stakes in SA businesses on artificially favourable terms must reduce the expected returns on capital. It means less upside and no less downside for established businesses or start-ups and so fewer projects qualify for additional investment in plant or people. An important source of capital for SA start-ups will be foreign investors. Demanding they give up potential rewards for bearing SA risks is surely discouraging to them. Moreover, imposing such conditions on ownership cannot be regarded as a form of restitution for the past injuries imposed on previously disadvantaged black South Africans. That might be regarded as the moral case for taking very arbitrarily from some South Africans to give to others. The new foreign owners are surely very unlikely to have benefitted from apartheid.
The typical empowerment deal taken to widen the composition of owners on racial grounds is funded by the established owners. They provide loans to the new BEE qualified owners to enable them to take up the shares on offer. The interest and the debt repayment are facilitated by a flow of dividend payments. If all goes well the empowerment shares will, intime, be unencumbered by debts and will have acquired significant value that may cashed in. If the dividends did not flow sufficiently and the value of the company lagged interest rates, the debts would be written off and the empowerment stake would be worth very little. Upside without downside may however encourage more risk taking than desirable. An empowerment state of mind that can be dangerous to all shareholders.
The idea for a better less discouraging way to meet empowerment objectives came to me from Erik Stern of Stern Value Management. That is don’t sell the shares, rather give them to an empowerment trust established for employees. One employee – one share in the Trust -regardless of status. No loans raised or interest to be paid, or dividend policies to be driven by the empowerment interests. The trust however would be imputed with a cost for the capital allocated to it. Regarded as a non-interest bearing loan capital, the notional value of which would increase at a rate equivalent to the required returns on such risky capital in SA, say of the order of 15% per annum.
The initial capital plus the compounding required returns on it would then be subtracted from the Asset Value of the Trust. On any liquidation of the assets of the Trust, only its net asset value would be paid out to its beneficiaries and the loan capital returned to the company. Employment incentives and bonuses would be based on the difference between realised and required risk adjusted returns. Potential dividends would ideally be reinvested in the company and allocated to cost of capital beating projects, so adding further to the value of the company and the Trust.
The potential upside to be given up by the original shareholders would then be in proportion to the Economic Value Added (EVA) delivered by the firm. That is the difference between the actual returns and the required returns, or cost of capital, multiplied by the capital invested and reinvested in the company, that would determine the value of the company and the NAV of the Trust. In a return on capital focused company this could amount to a very large capital sum to be happily shared, equally, with all employees
South African savers dependent ontheir pension and retirement plans will have become aware that the actions of the Chinese Communist Party are sometimes more important than the actions or non-actions of the ANC. This is because of their likely large stake in a Chinese Internet giant, Tencent, held through their shares they own in JSE listed Naspers, (NPN) and via its controlling stake in Amsterdam and JSE secondarily listed, Prosus. (PRX)
Because of the much greater uncertainty about the policies the Chinese will apply to the Tencents, the Alibabas and Baidus and their like, a share in NPN or PRX has become much more risky to hold and therefore less valuable. Shareholders taking on more risk require compensation in the form of higher expected returns, this almost always means a lower entry price, a lower current share price.
The risk to any asset holder is simply the risk that the price of the asset they hold may rise or fall from its current level, should they have to or be forced to cash in their investment at some perhaps unknown point in time. The chances of a rise or fall from the current market determined price, assuming a well-informed active market in them, will be about the same 50% on any one day. Market prices follow a random walk, rising and falling in an irregular sequence. Hopefully these random movements come with an upward drift to bring actual returns in line with the higher expected returns, that make holding risky assets a rational choice for the long-term investor.
In riskier times the daily or hourly moves in both directions, up and down, become significantly wider, while the average move over any extended period will still stay close to zero. When the sense of the future becomes less certain, volatility of share prices increase, the standard deviation of daily moves about the average of almost zero widens, and the cost of insuring against such changes in market prices in the form of an option to buy or sell an option on the share or Index inevitably increases. As it has done in the case of NPN.
The recent increase in the daily volatility of NPN has been of extraordinary dimensions. Daily share price declines of 7% and then an increases of 10% on August 10th are truly exceptional and reveal how difficult it has been for well informed investors to make up their minds about what the future will hold for Tencent, NPN and PRX. The standard deviation of daily moves in the NPN share price (30 day moving average) has almost trebled since June 2021.
Daily % Moves in NPN and their Volatility Standard Deviation of Daily price Moves (30 day moving average of the Daily SD) to August 9 2021
Volatility compared; S&P 500 (VIX) JSE Top 40 SAVI and NPN Standard Deviation of Daily price Moves (30 day moving average of the daily SD) to August 9 2021
The rewards for holding on to your NPN or PRX shares remain to be seen. The China risks may decline to help add value. NPN management also hopes that the value of an NPN or PRX will be enhanced by the shares trading more closely to the market value of their Tencent Holdings. They are rejigging the allocation of its Tencent holding between Johannesburg and Amsterdam to attract stronger investor interest to reduce this discount to the sum of its parts, mostly Tencent.
My theory is that the value lost by shareholders is mostly because of scepticism about the value of the acquisitions and investments made by NPN/PRX. They are expected to return much less that the investors could earn for themselves taking on similar risks and so investors and analysts write down the value of this expensive investment programme when they estimate the value of NPN or PRX. The more invested, the more value destruction expected, the lower the value of an NPN or PRX share and the larger the discount. With the completion of the latest restructuring in sight we will see the alternative theories of the discount put to the market test.
The one possible for shareholders – if my theory holds – though it would be a bitter consolation, is that the lower the Tencent share price and the weaker the NPN and PRX balance sheets, the more disciplined and constrained will be their investment and borrowing programmes. And the lower the discount.
In this chapter I reflect on the role of the economist/strategist in the business of managing wealth. It is a role I have played since my first involvement with the financial markets in the early nineteen-nineties.
I share the ideas about financial markets and their relationship to the economy that have informed my work as an investment strategist and economist in the financial markets. I say a little about my personal involvement in the financial markets.
I explain the importance of a well-considered investment strategy, for not only the wealth owner or their agents, the portfolio managers, but for the greater good.
These thoughts are followed by a case study of how I go about my work reading the financial markets that I hope will be of interest and helpful to those with a close interest in financial markets. The analysis offered is an example of pattern recognition that analysts and indeed all businesses rely upon to improve their predictions. This recognition has become so much easier over my years with the ready availability of low-cost computing power, most helpful software, and abundant data, easily downloaded. Exhausting the data, testing a theory, looking for evidence to support a theory, becomes a matter of minutes rather than the years it took when I first took an interest in financial markets. Theory and observation run together, observations lead to theory and theory is tested by observation. My attempts to understand and explain the links between the financial markets and the economy and the economy and financial markets remains a work in progress that I hope to continue for as long as it makes sense for me to do so and worthwhile for those who engage with me.
The recent willingness of communities in South Africa to defend the property of others, their shopping malls, is of deep significance. At great danger to themselves they established a line that the looters and vandals feared to cross. They did so because what they were protecting was of great value to them. What was at stake was convenient access to the great variety of goods and services, necessities, and luxuries the shopping malls and their retail tenants supply them.
They were defending the market based economic system of which the last step in a supply chain is the well-stocked shop around the corner from which they benefit in a practical and important way, as they well understand.
hey are unlikely to be able to explain that the market delivers via a highly complicated well informed supply chain that reaches across the globe. One that is held together through the discipline of required returns on their owner’s capital put to risk in all the different enterprises that link producers and their customers. Or appreciate that the feed-back loops that keep the system going are not designed or directed by any leader issuing orders. That the process evolves continuously in response to the essential knowledge of how it works best that is highly diffused among many millions of decision makers. Who are required to respond to the preferences of their customers that are signalled when they make their selections at the malls. That it is indeed in large measure a consumer led system.
These are the abstractions used to make the case for free markets and privately held property. Abstractions that are not easily grasped and compete with the other, more easily grasped, abstraction of a centrally planned economy. One led by a presumably all-knowing and equality minded, selfless and highly competent bureaucracy.
But the market system delivers the goods in abundance as SA the communities know very well – and they do not need to know more than the practice. They should be aware that the alternative to the market-consumer led system, whenever tried, has failed to deliver, other than to its powerful elites, who maintain their power and very unequal living standards by their ability to brutally repress any opposition that might dare to challenge their interests.
While the mob was attacking our system, Cubans were also protesting politely on their streets. Protesting for more economic freedom, more access to the goods and services and higher incomes that they know a market system could provide them with. It was most unusual protest in Cuba because it will be severely punished as the protestors must expect to be. The well-heeled Cuban establishment has one of the most effective surveillance systems to keep their citizens in line.
The market system however does depend critically on the provision of law and order- to protect property and wealth. Without it the incentive to save and invest and to take risks with savings, that is capital, falls away and economic progress is stunted.
The priority for the SA government, is to not only restore order but to provide every confidence that it will be able to provide protection against disorder in the future. This is the essential reform agenda. South Africans and their ability to take full advantage of what the malls could offer them needs not so much more law and order, but rather more order itself. The economy could do with much less law, of fewer rules and regulations, and obstructions of freedoms to engage and contract freely and usefully with each other.
The signals from the financial markets indicate that the global investors have not changed their view of the SA economy this month. That all is by no means lost. The cost of insuring RSA dollar denominated debt this month has increased by 20 b.p. while the yield on a five-year RSA dollar bond is barely changed.
Long term interest rates in SA are largely unchanged as are inflation expectations.
The rand weakened against the dollar this month by 2.4% but so have most other EM exchange rates- on average by about a per cent. And EM equity markets have underperformed the JSE this month- in USD- by about 6%
What remains very helpful to the SA are high metal prices. They have had a welcome pick-up since July 19th
The investor opinion of SA remains un-flattering yet one of wait to see. Correctly so.
There are regularities of economic crises and their aftermaths that can help us to plot the way ahead.
Life has returned to normal in the US and UK – judged by the crowds attending Wimbledon, Wembley and Whistling Straits. With only the occasional mask to remind us of a crisis passed. The normal is once again guiding our expectations and economic actions, and is determining the value of the assets we own.
Normal for now, that is, and until the next crisis again moves the markets. Its timing, causes and consequences will remain one of the great known-unknowns, or perhaps it will even be an unknown- unknown (in the words of the recently passed Donald Rumsfeld). However, the successes of recent crisis management may help put us in a better position to cope.
We can define an economic crisis as a serious disruption of economic activity, leading to the severe loss of income and the benefits gained from producing and consuming goods and services. A crisis is therefore destructive of the value of the assets we own, which depend on such incomes.
A crisis is worse than your average recession, when GDP declines by a percent or two below trend for a year or so. The failures of the banks and insurance companies in 2008-2009 resulted in the Global Financial Crisis (GFC), which threatened to implode the real economy with them. In 2020, economies were shut down summarily to escape the pandemic, resulting in the loss of as much as a quarter of potential GDP, a large sacrifice of potential incomes and output.
Overcoming these two crises relied essentially on governments and their central banks. In the case of the GFC, it required central banks to shore up the global financial system buying assets from banks and financial institutions on a vast scale, in exchange for central bank money.
The responses to the crisis of 2020, at least in the developed world, were more immediate, less equivocal and on a larger scale than after 2008. They added much direct income relief to the monetary injections. They have surely succeeded not only in reducing the pain of lockdowns, but also in ensuring that demand for goods and services would recover with the supply of goods, that a return normality makes possible.
Judged by the signals provided by the markets in shares, bonds and commodities, the economic crisis is now well behind the developed world. US, emerging market (EM) and therefore South African companies are now worth significantly more than they were when the lockdowns became a reality in March 2020, when the US Index lost 13%, the EM Index 17% and the JSE gave up 27% of its US dollar value. The JSE had lost 14% of its value the month before.
The JSE from these lows has been a distinct outperformer, in dollars and in rands. The JSE has gained 50% compared to a 30% gain for the S&P and EM indices, when converted to rands. In dollars, the gains since the trough are even more impressive. The JSE is up 86% compared to the 66% and 61% gains for the S&P and EM since the crisis lows.
Regularities of a crisis
This indicates one of the crisis regularities for SA. South African assets and incomes are highly exposed to changes in global risk, losing more during a crisis and then gaining more than the average EM equity or bond when the crisis is over. It is also worth noting that the JSE has not moved much since March this year – another sign of normality. If only we had the gumption not to waste a good crisis.
This illustrates another regularity when an economic crisis is not of South African making. The rand is what we call a high beta EM currency – it does worse than its EM peers when risks are elevated and better when global risks decline, as has been the case with the JSE. During the height of the present crisis the rand/US dollar exchange rate and the JSE were 30% weaker compared with EM peers. They are now back to the normal long-term relationship of an average of one to one.
Global market risks are easily identified by the volatility of the S&P 500 index, as represented by the well-known volatility index, the VIX. When these daily moves become more pronounced and share prices bounce around abnormally, the cost of insuring against market moves becomes ever more elevated – shares lose value when the future appears much less certain. Higher expected returns, and hence lower share prices, compensate for increased risks. In short, the VIX goes up and share prices go down in a crisis.
The daily average for the VIX in the two years before the pandemic was 19 – it was over 80 at the height of both crises. It has recently moved back to 19.
The S&P 500 index is now in record territory in nominal and real terms. In inflation-adjusted terms, the S&P 500 is up about 7.4% a year since the low point of the financial crisis. Real earnings over the same period have grown at an annual average rate of 5.9% since 2009, an above average performance.
Looking for cover
Another regular feature of a crisis is the behaviour of the cover ratio – the normally very close relationship between earnings and dividends. The more cash retained (the less paid out) the more value that is added for shareholders.
We make the presumption that the extra cash retained is invested well and earns above its opportunity cost. S&P earnings are again rising much more rapidly than dividends (which held up better during the crises). Indeed, analysts, absent the usual guidance from the managers of the companies they report on, are still struggling to catch up with the buoyant earnings recovery now under way. Earnings surprises are the order of the day.
The cover ratio for the JSE follows a similar pattern in times of crisis and has a similarly negative impact on share valuations. The more companies pay out dividends relative to earnings, the less these companies are generally worth. The recent recovery in cover ratios to something like their longer-term averages is another sign of normality, as well as a support for share prices. Ideally, the JSE cover ratio declines in line with the increase in opportunities to invest in ways that would add value.
SA shows its metal
A further regular feature of the economic crises of recent times and the recovery from them has been the behaviour of commodity and metal prices that make up the bulk of SA’s exports. They fall during a crisis and they recover strongly as the crisis passes by as they are doing now. Metal and mineral prices lead the South African business cycle in a very regular way. Commodity prices lead, the rand follows, inflation is then contained and interest rates, at worst, do not rise. And the money and credit cycles accommodate the rising incomes that emanate initially from the mining sector.
We are far from the super cycle we benefitted from in the lead up to the GFC of 2008. But we can hope that above normal demand for metals will continue to impress itself on below normal supply responses, translating into higher prices.
While long-term interest rates in SA have recovered from their crisis-driven extremes, they remain discouragingly elevated. Discouraging because they imply high hurdles for capital expenditure budgets to leap over and hence low cover ratios and less cash retained for capex. The gap between short and long-term interest rates, the slope of the yield curve, has moreover remained at crisis levels.
The yield curve implies that short-term interest rates will double within three years. This is a prospect that seems completely out of line with the outlook for the SA economy. We can only hope that the market has got this badly wrong.
The crisis-driven SA economy should not be forced to adjust to higher interest rates. It would be inconsistent with the economic and financial stability that the Reserve Bank is constitutionally charged to secure. It takes much more than low inflation to overcome an economic crisis, as South Africa may still come to recognise.
The steps taken in the US to counter the destruction of incomes and output caused by the lockdowns of economic activity can be regarded as a resounding success. Real US output is now ahead of pre-covid levels. By the end of 2021, GDP could well surpass the GDP that might have been expected absent the lock downs. It took a great deal of income relief in the form of cheques in the post from Uncle Sam, supplemented by generous unemployment benefits and relief for businesses.
The extra income means an increase in deposits, in other words money placed with the US banks, to be spent later or exchanged for other financial assets.
Deposits held by banks with the Federal Reserve System have increased by 85%, and deposits at the commercial banks have grown by 26% since March 2020. The source of the extra cash, the deposits at the commercial banks and the Fed, has been additional purchases of government bonds and mortgage-backed securities in the debt markets from the banks and their clients, which are being maintained at the rate of US$120bn a month.
The assets and the liabilities of the Fed have increased by 36% over that period. This is money creation on an awe-inspiring scale and it has worked, as intended, to promote demand for goods and services. Providers of goods and services are struggling to keep up with demand, while also struggling to add to payrolls, leading to upward pressure on prices. The US CPI was up by 5% in May – a rate of inflation not seen since 2008 and before then only in the 1990s.
Inflation in the US – annual percentage changes in CPI
Source: Federal Reserve Bank of St Louis and Investec Wealth & Investment, 15/06/2021
However, the outlook for inflation in the US is less obvious than usual. The Fed has been surprised by the pick-up in the inflation rate, as was indicated by the Federal Open Market Committee and Fed chief Jerome Powell’s press conference on 16 June. Powell remains confident that the increase in inflation is transitory and the Fed does not intend raising interest rates any time soon, at least not until the economy has returned to full employment, which is judged to be some way off.
(It should be noted that full employment may mean a lower number than previously estimated, given that two million potential workers have withdrawn from the labour market since the lockdowns. They may however wish to return to employment should the opportunities to do so present themselves; this is one of the uncertainties the Fed is trying to deal with as it looks to understand the post-Covid world.)
A number of Fed officials however have brought forward the time when they think the Fed will first raise its key interest rates, to the first quarter of 2023, a revision that surprised the market and moved long-term interest rates higher. The bond market nonetheless remains of the view that inflation in the US over the next 10 years will remain no higher than the 2% average rate targeted by the Fed. The Fed will be alert to the prospect that more inflation than this will arise.
A tale of two central banks
The contrast of the actions of the Fed with those of the South African Reserve Bank (SARB) is striking. The SARB balance sheet contracted by R115bn, 10.8%, between March 2020 and May 2021. Since January 2020, the sum of notes issued plus deposits of the banks with the SARB (the money base) has declined by 6%, the supply of bank deposits (M3) has grown by a paltry 4% and bank credit by 2%. These are shocking figures for an economy struggling to escape a deep recession.
The SARB may be of the view that money and credit are less important for the economy, and that changes in interest rates are the only instrument they have to influence the economy.
Monetary comparisons between SA and the US (March 2020 = 100)
Source: SA Reserve Bank, Federal Reserve Bank of St Louis and Investec Wealth & Investment, 15/06/2021
The SARB seems to believe their lower interest rate settings have been accommodative and helpful to the economy. Higher interest rates would, of course, have been unhelpful and lower rates were certainly called for. However, the money and credit numbers indicate deeply depressing influences on the economy, influences that the SARB could and should have done much more to relieve, following the US example. There is more to monetary policy and its influence on the economy than movements in interest rates.
GDP in the US and SA (March 2000 = 100)
Source: SA Reserve Bank, Federal Reserve Bank of St Louis and Investec Wealth & Investment, 15/06/2021
It would be easy to despair of the prospects for the SA economy given the current, discouraging trends in the supply of money and credit. However, we can draw hope from the possibility that the US cavalry (with some Chinese assistance) will rescue us, in the form of rising prices for metals and minerals that are very much part of the inflation process currently under way in the US.
Metal prices have always led the SA business cycle, in both directions. They may well lead us out of the current morass, after which the supply of money and credit will then pick up momentum to reinforce the recovery, as they have always done in a pro-cyclical way. The responses to the lockdowns have made it clear how our monetary policy reacts to the real economy. A favourable wind from offshore may lift the money supply and bank credit, without which faster growth is not possible.
The steps taken in the US to counter the destruction of incomes and output caused by the lockdowns of economic activity must be regarded as a resounding success. Real US output is now ahead of pre-covid levels. By the end of 2021 GDP may well have surpassed the GDP that might have been expected absent the lock downs. It took lots of income relief, checks in the post from Uncle Sam, supplemented by generous unemployment benefits and relief for businesses. The extra income means extra deposits, that is money with the US banks, to be spent later or exchanged for other financial assets or real estate or bitcoins or precious metals.
It has also taken lots of extra money, money in the form of deposits held by Banks with the Federal Reserve System have increased by 85%, and deposits at the commercial banks have grown by 26% since March 2020. The source of the extra cash and the deposits at the commercial banks and the Fed, has been additional purchases of government bonds and mortgage-backed securities in the debt markets from the banks and their clients – insurance companies and the like, that are being maintained at the rate of 120 billion dollars a month. The Assets and the Liabilities of the Fed have increased by 36%. It has been money creation on an awe-inspiring scale and it has worked as intended to promote demand for goods and services as excess holdings of money are exchanged for goods and services, that businesses are stimulated to supply and to employ more workers to help do so. The fact that they are struggling to keep up with demand, also struggling to add to payrolls, has meant significant upward pressure on prices. The US CPI was up by 5% in May – a rate of inflation not seen since 2008 and before then only in the nineteen nineties.
Inflation in the US – Annual percentage changes in the CPI (Monthly Data)
Source; Federal Reserve Bank of St.Louis and Investec Wealth and Investment
The outlook for inflation in the US is much less obvious than usual. The Fed has been surprised by the pick-up in the inflation rate as was indicated by its Open Market Committee and Governor Powell’s press conference held yesterday 16th June. But Powell remains confident that the increase in inflation is transitory and the Fed does not intend raising interest rates anytime soon, and not until the economy has returned to full employment which is judged to be some way off. Though full employment may mean fewer workers employed given that two million potential workers have withdrawn from the labour market since the lockdowns. They may however wish to return to employment should the opportunities to do so present themselves and is one of the uncertainties the Fed is trying to cope with post Covid for which there are no precedents as the Fed points out. A number of Fed officials however have brought forward the time when they think the Fed will first raise its key interest rates to Q1 2023, a revision that surprised the market and moved long term interest rates higher. Though the bond market remains of the view that inflation in the US over the next ten years will remain no higher than the 2% p.a. average rate targeted by the Fed. The fed as the market will be highly alert to the prospect that more inflation than this will come to be expected.
The contrast of the actions of the Fed with that of the South African Reserve Bank is striking. The SARB balance sheet contracted between March 2020 and May 2021 by R115b or by 10.8%. The sum of notes issued plus deposits of the banks with the SARB (the money base) has declined by 6% since January 2020 and the supply of bank deposits M3 has grown by a paltry 4% and bank credit by 2% since. Truly shocking figures for an economy struggling to escape a deep recession of the government’s making. The Reserve Bank must be of the view that money and credit do not matter for the economy, that changes in interest rates are the only instrument they have with which to influence the economy and that they have declined far enough. These are serious errors of judgment that have punished the economy unnecessarily severely.
South Africa and the USA Monetary Comparisons; March 2020=100
Source; Reserve Bank of South Africa, Federal Reserve Bank of St Louis and Investec Wealth and Investment
The Reserve Bank likes to believe their lower interest rate settings have been accommodative, that is helpful to the economy. Higher interest rates would have been very unhelpful and lower rates were called for. The money and credit numbers indicate only deeply depressing influences on the economy that the SARB could and should have done much more to relieve, following the US example. There is more to monetary policy and its influence on the economy than movements in interest rates.
GDP in the USA and South Africa. March 2000=100. Quarterly Data
Source; Reserve Bank of South Africa, Federal Reserve Bank of St Louis and Investec Wealth and Investment
It would be easy to despair of the prospects for the SA economy given the current trends in the supply of money and credit that are highly discouraging. But for the possibility that the US cavalry with some Chinese assistance may well rescue us in the form of rising prices for metals and minerals that are very much part of the inflation under way in the US. Metal prices have always led the SA business cycle in both directions. They may well lead us out of the current morass- and the supply of money and credit will then pick up momentum to reinforce the recovery- as they have always done in a highly pro-cyclical way. The responses to the lockdowns have made it very clear how our monetary policy leads with not against the winds blowing from the real economy. A favourable wind from offshore may lift the money supply and bank credit without which faster growth is not possible.
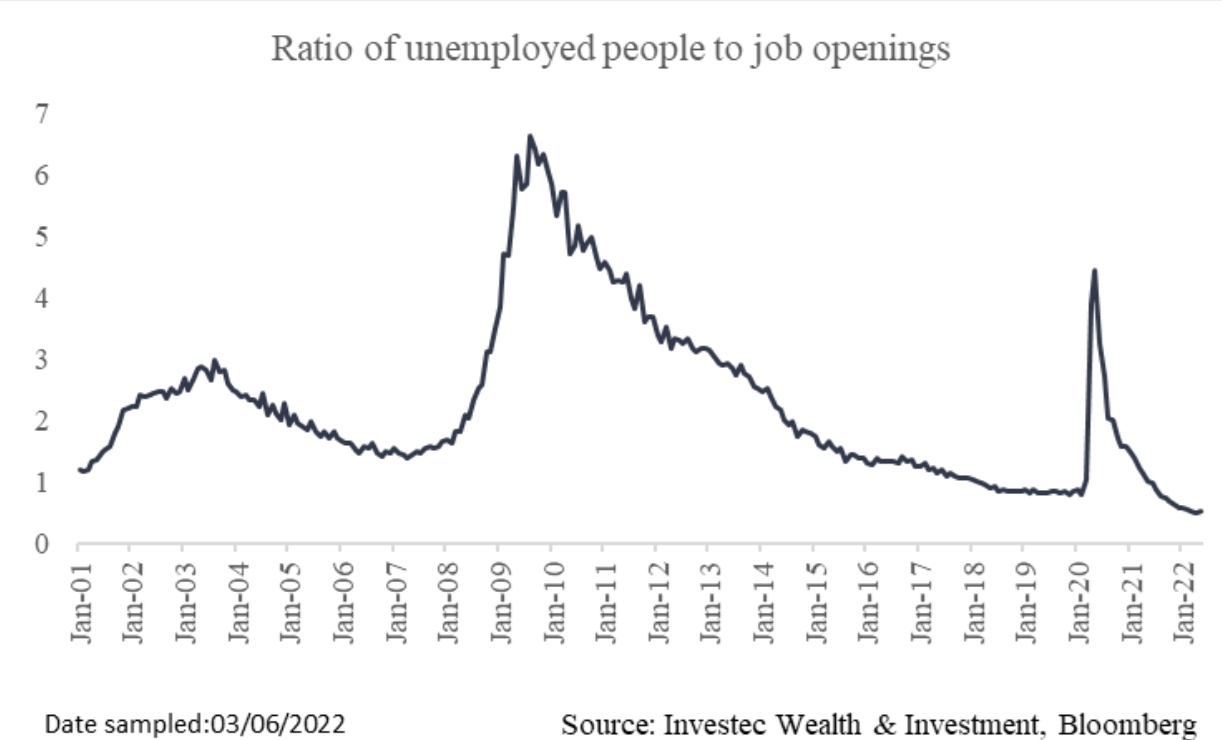
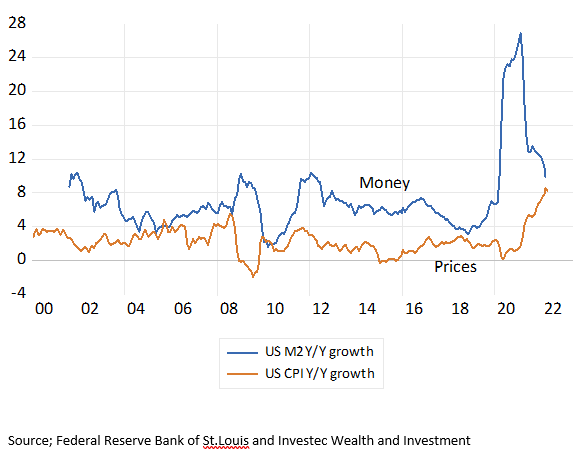
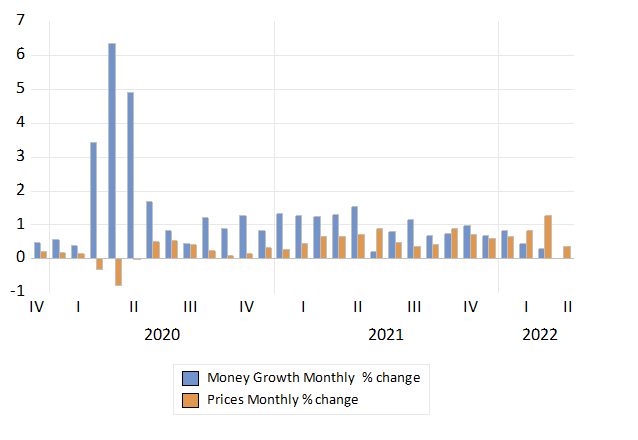
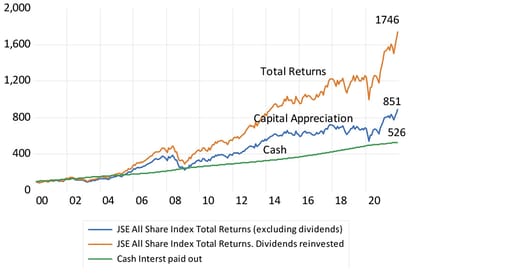
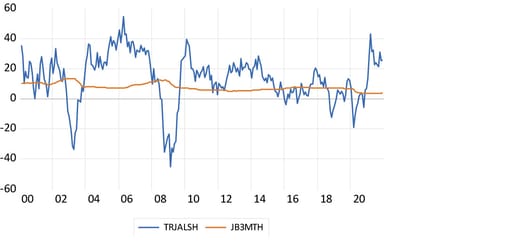
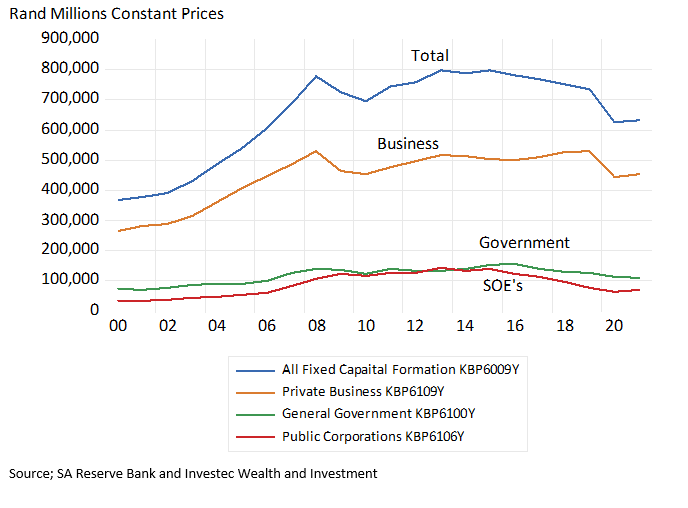
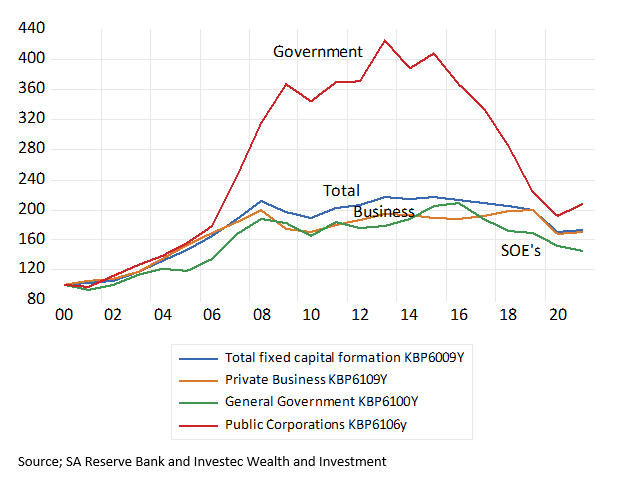

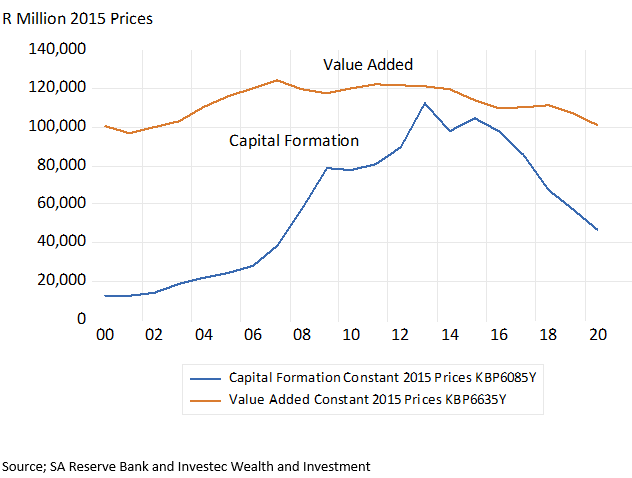
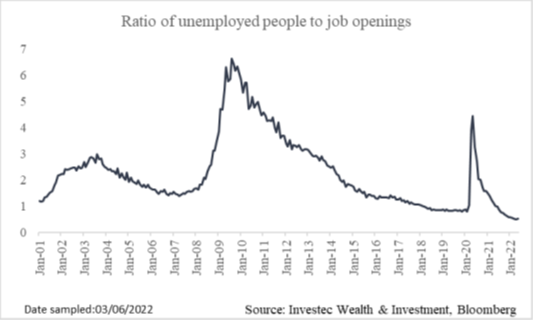
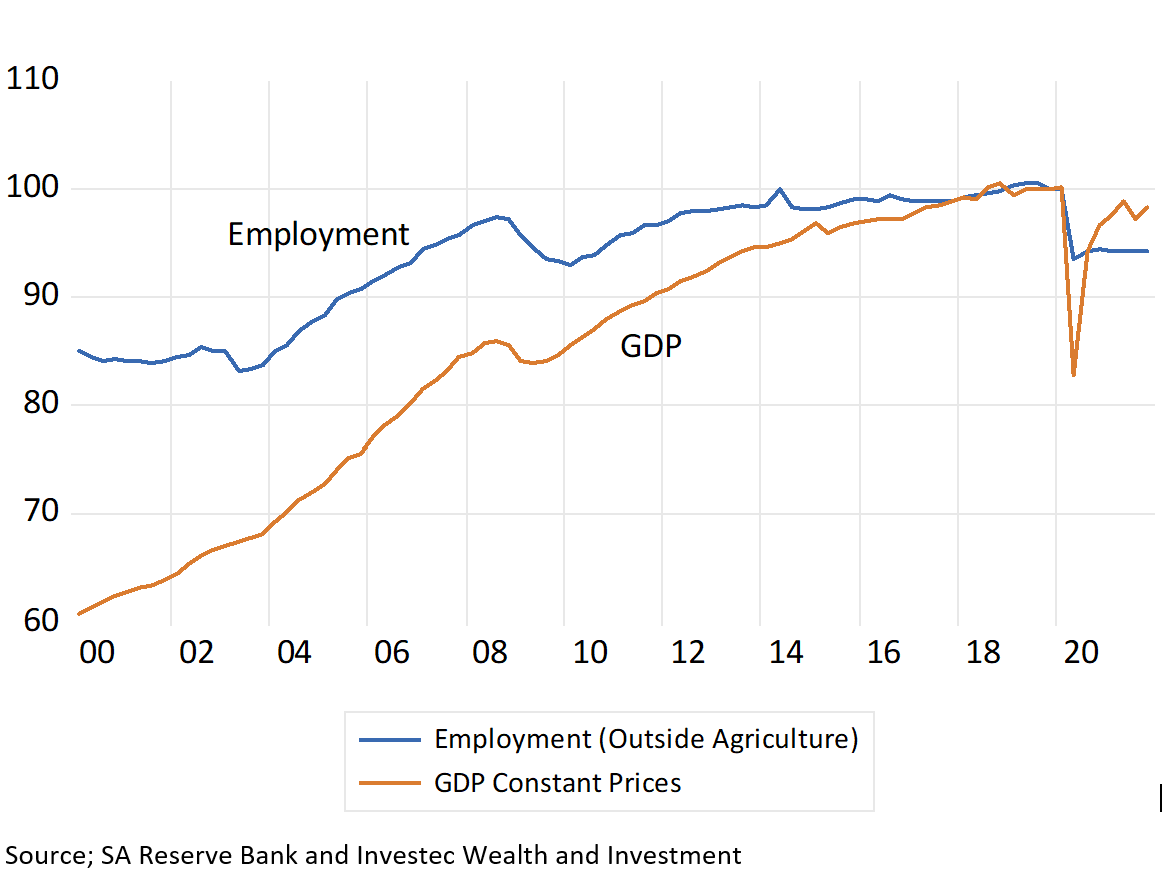
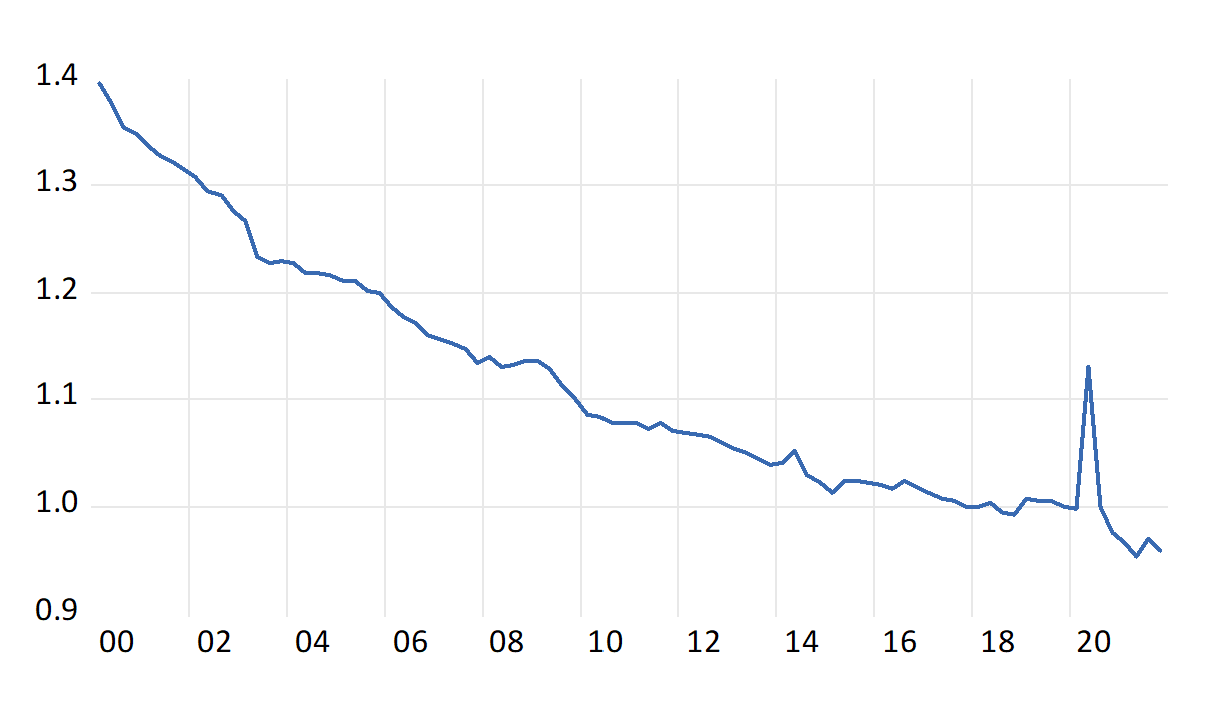
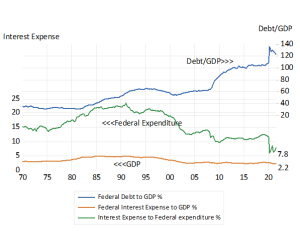
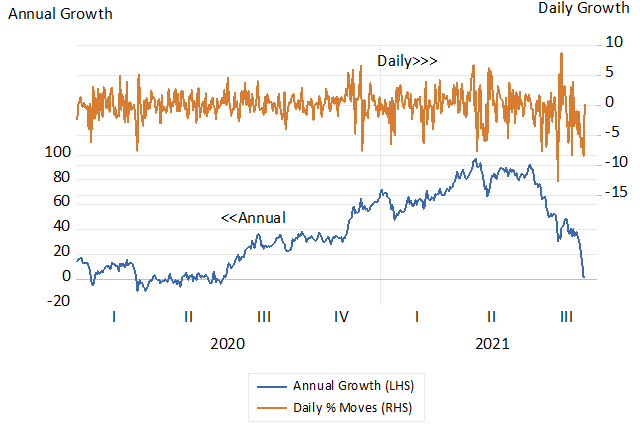
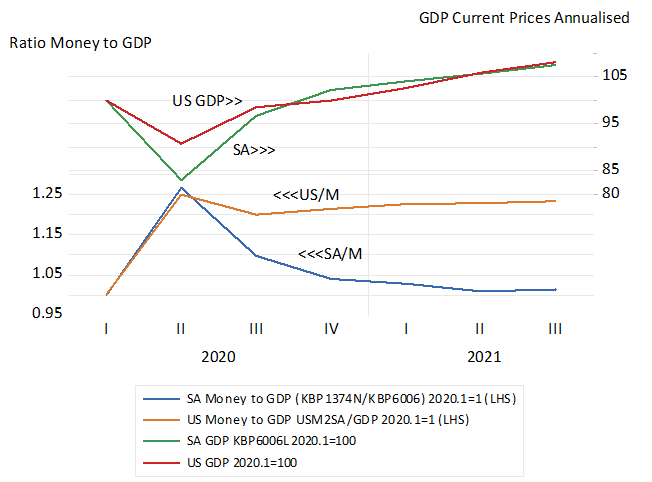
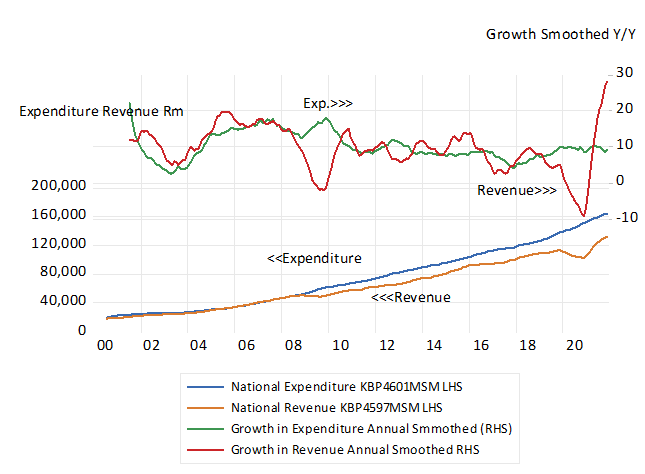
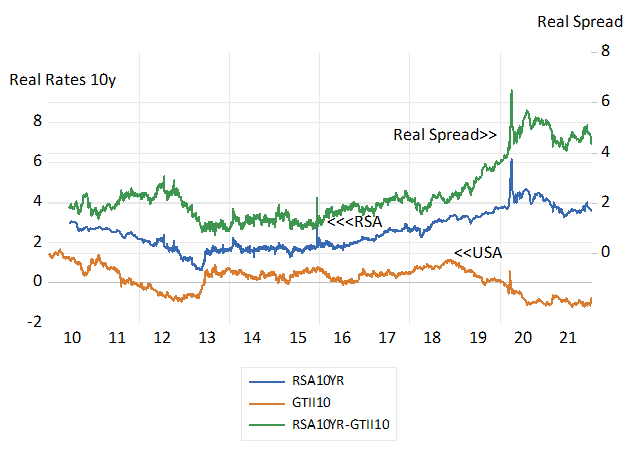
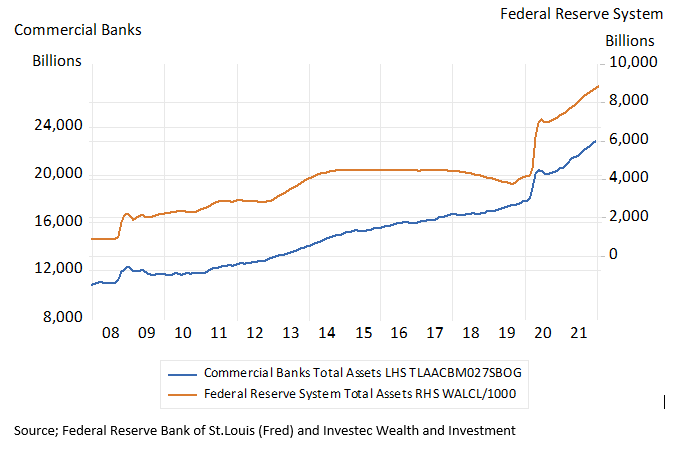
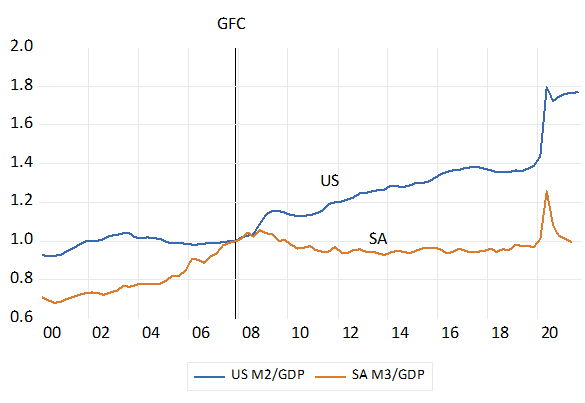
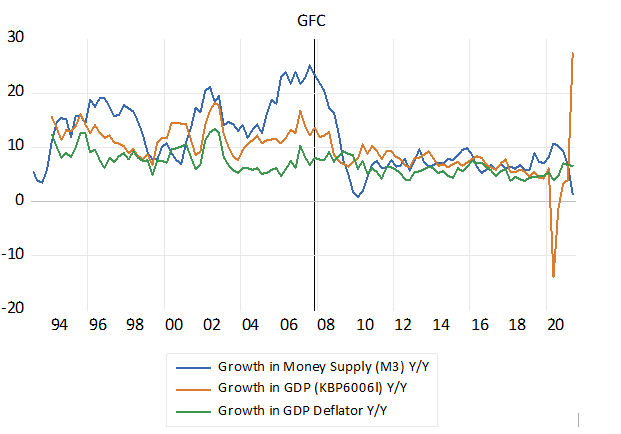
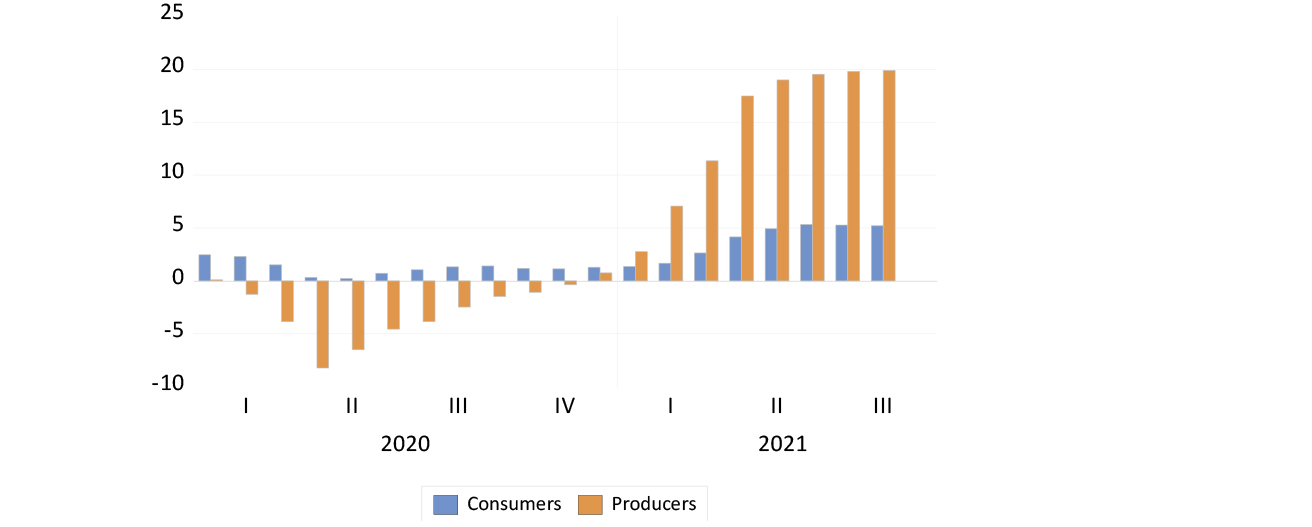
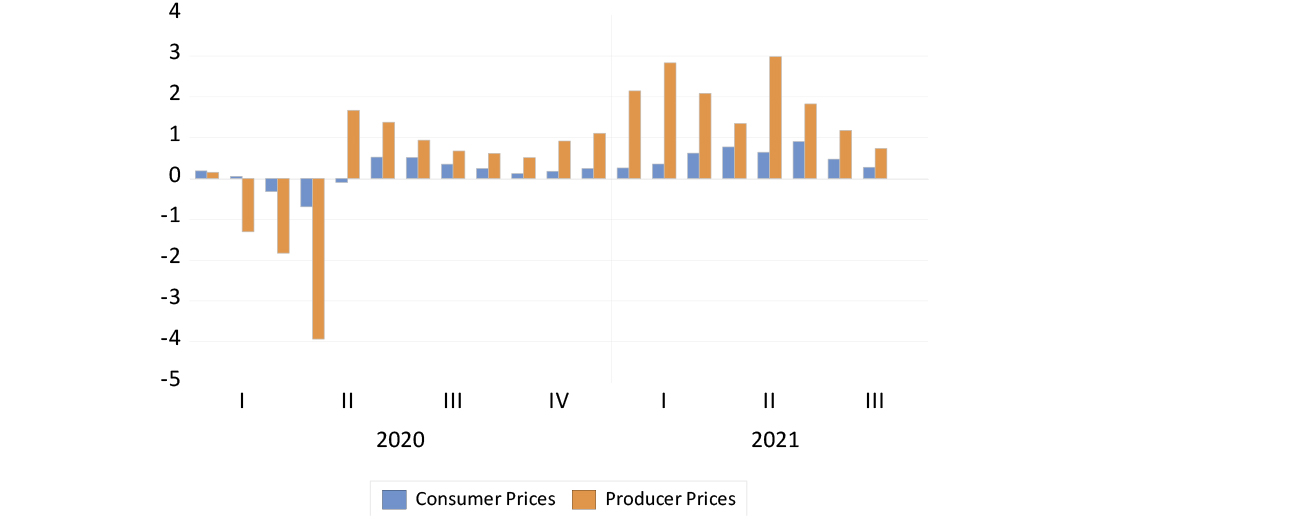
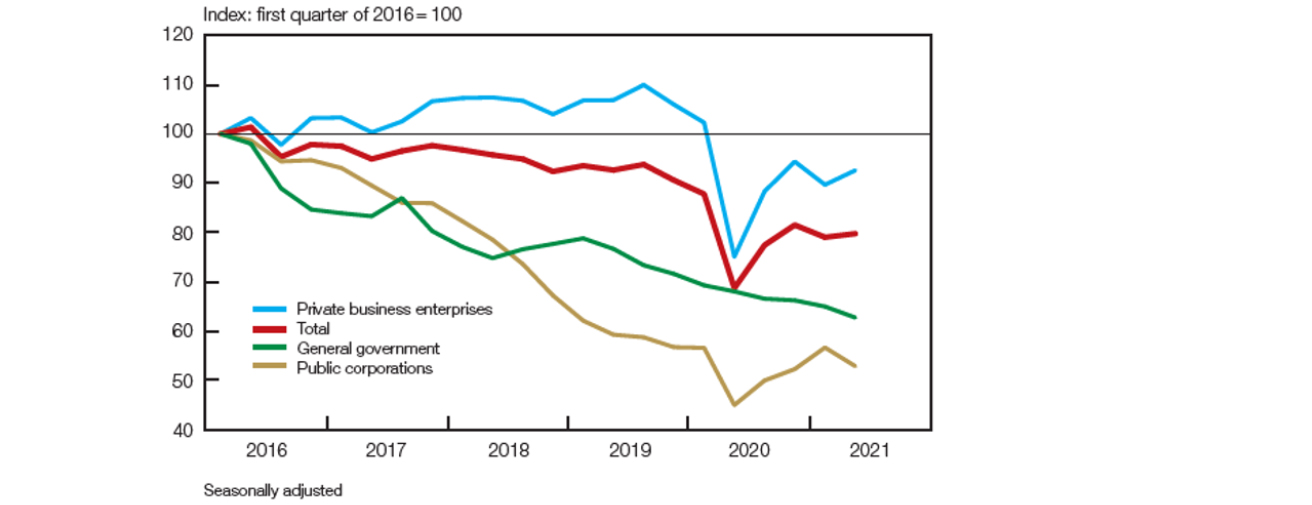
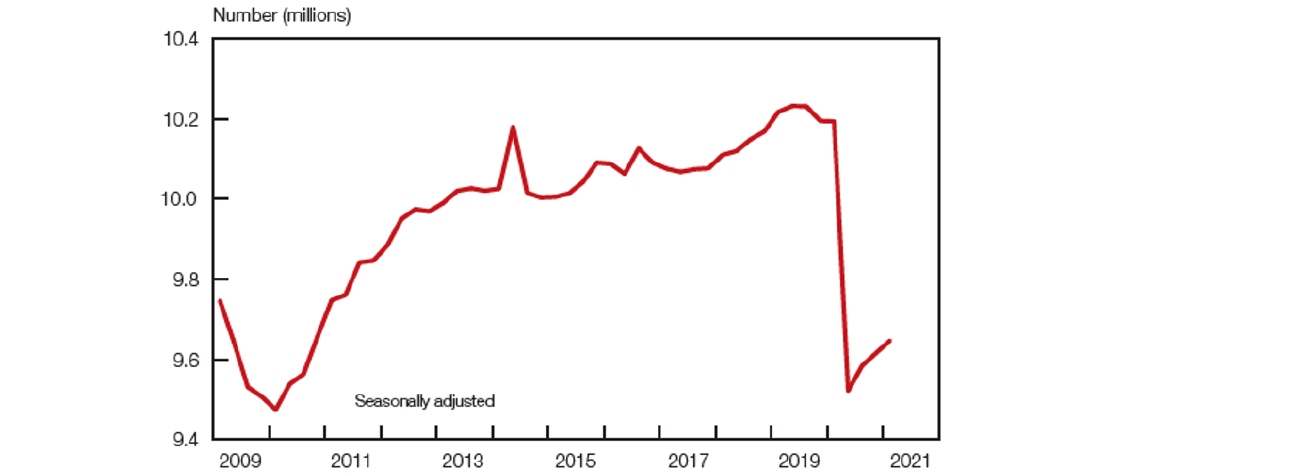
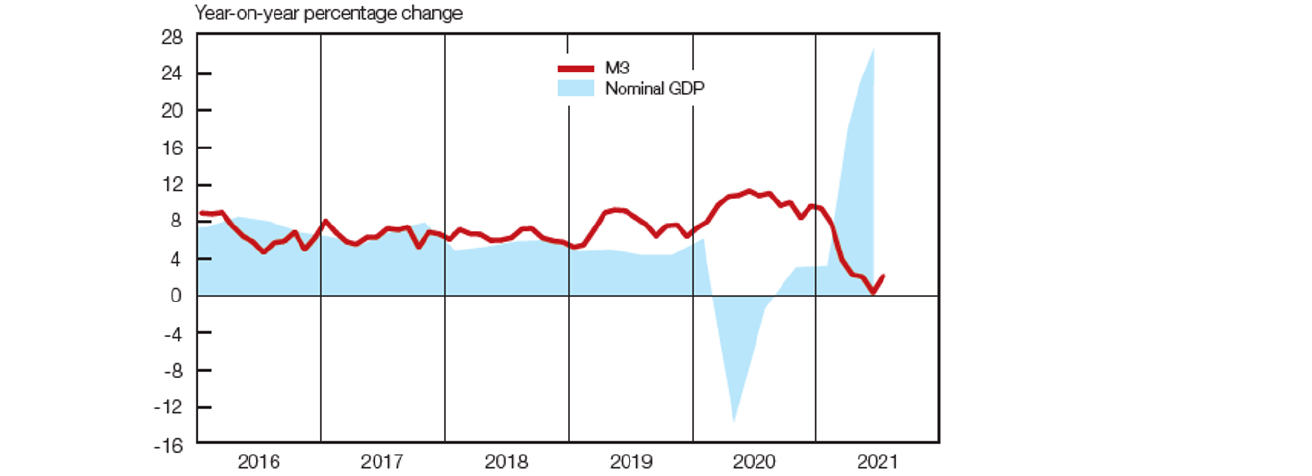
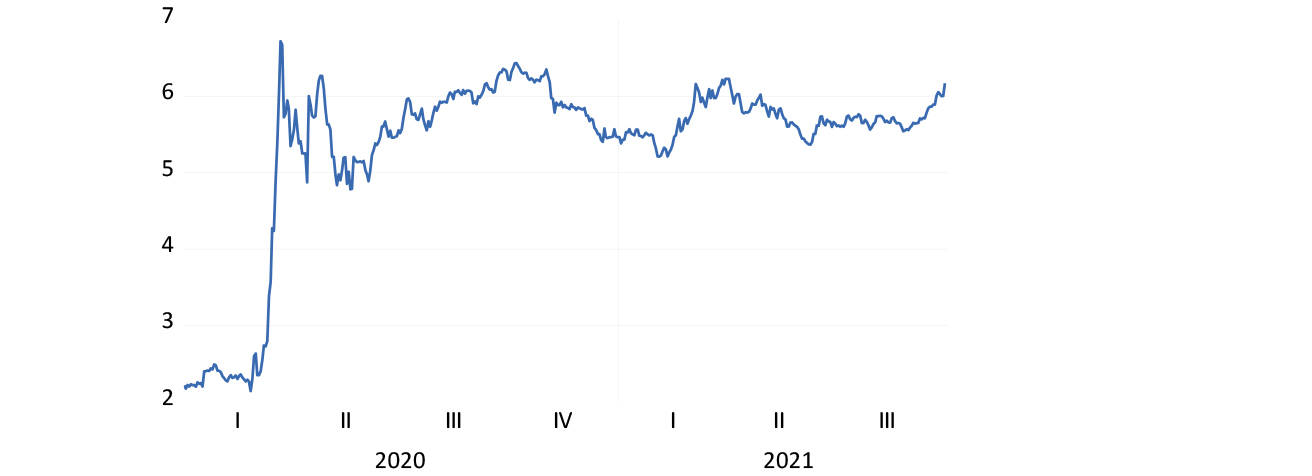
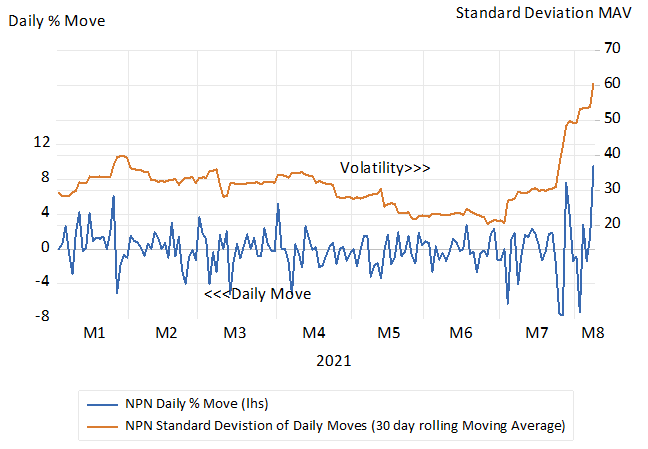
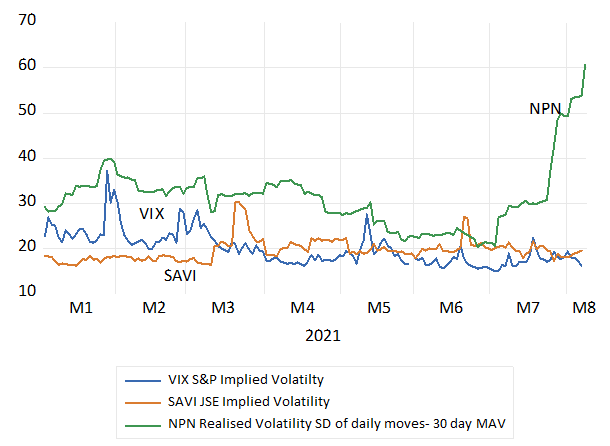
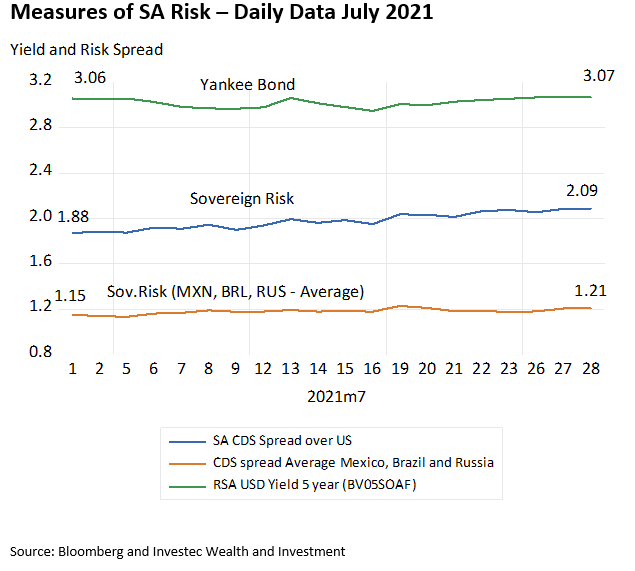
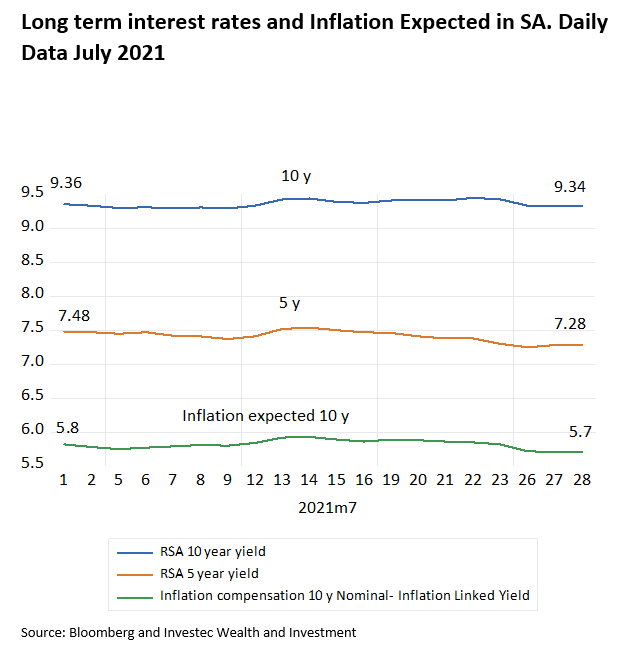
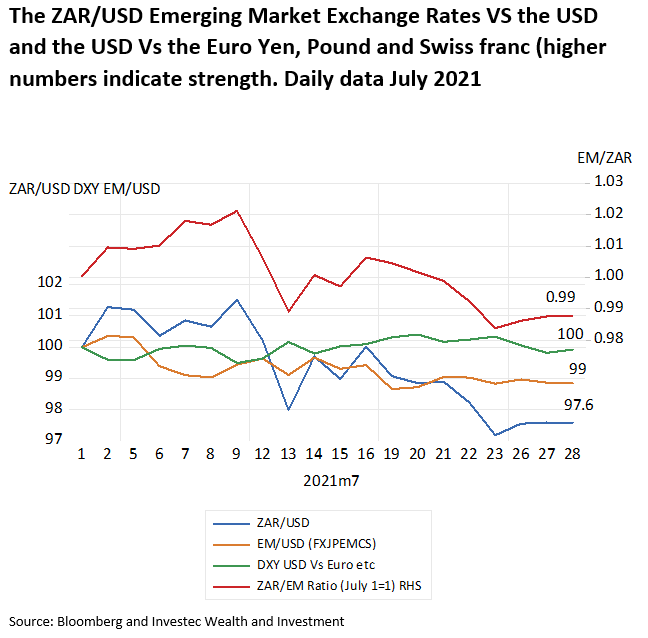
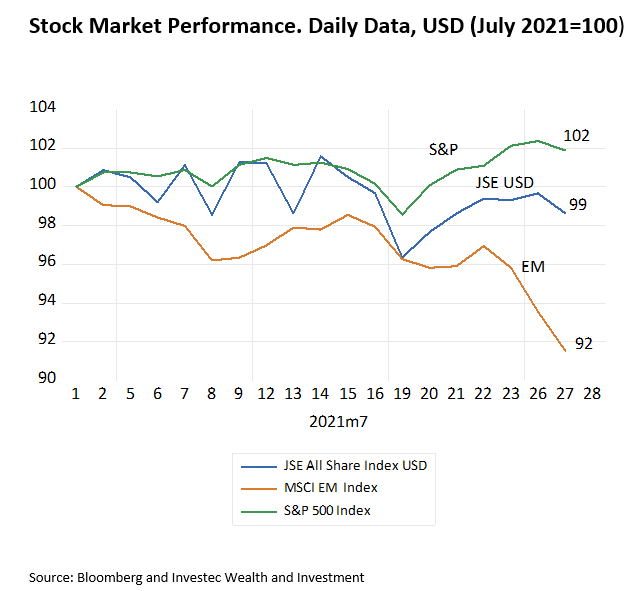
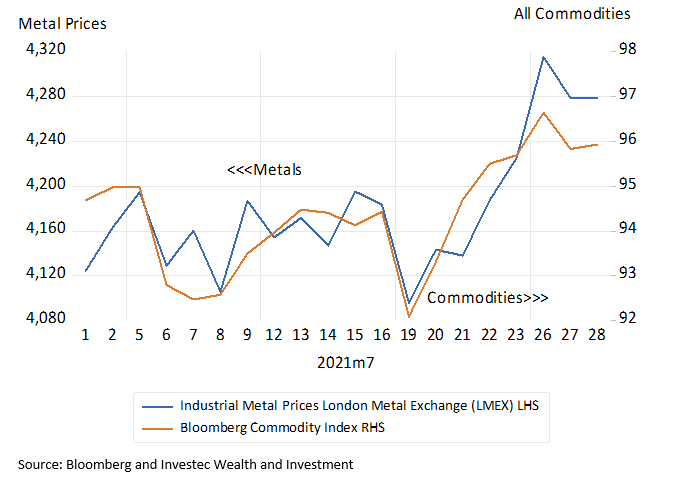
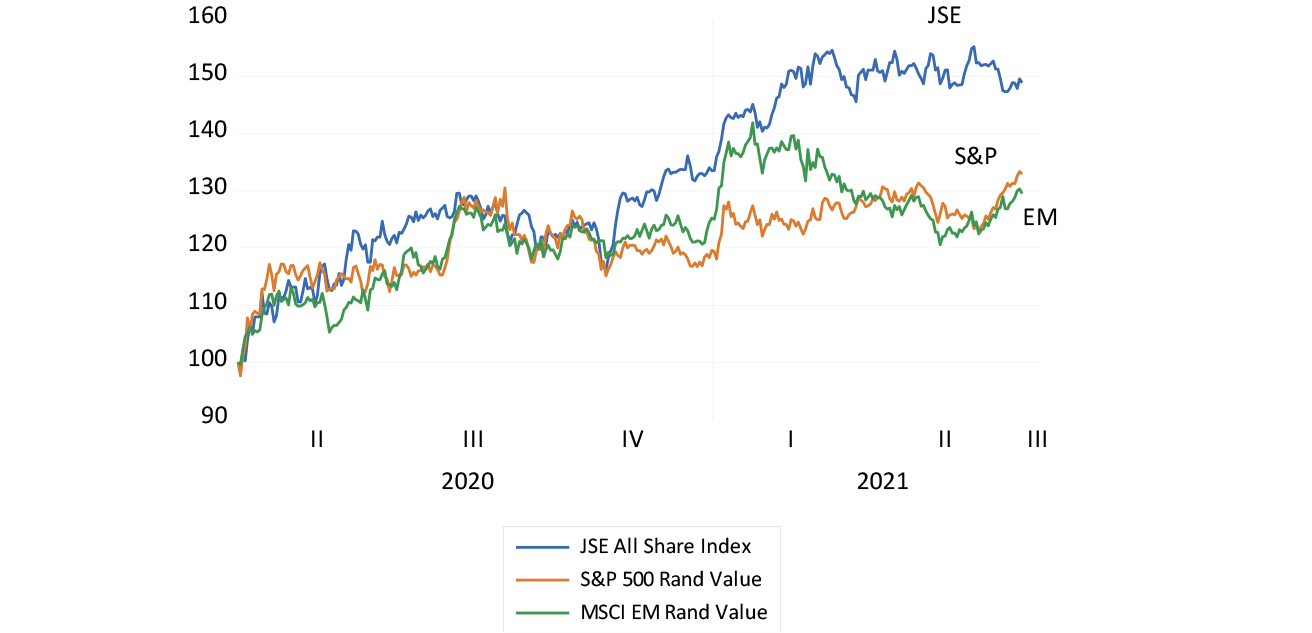
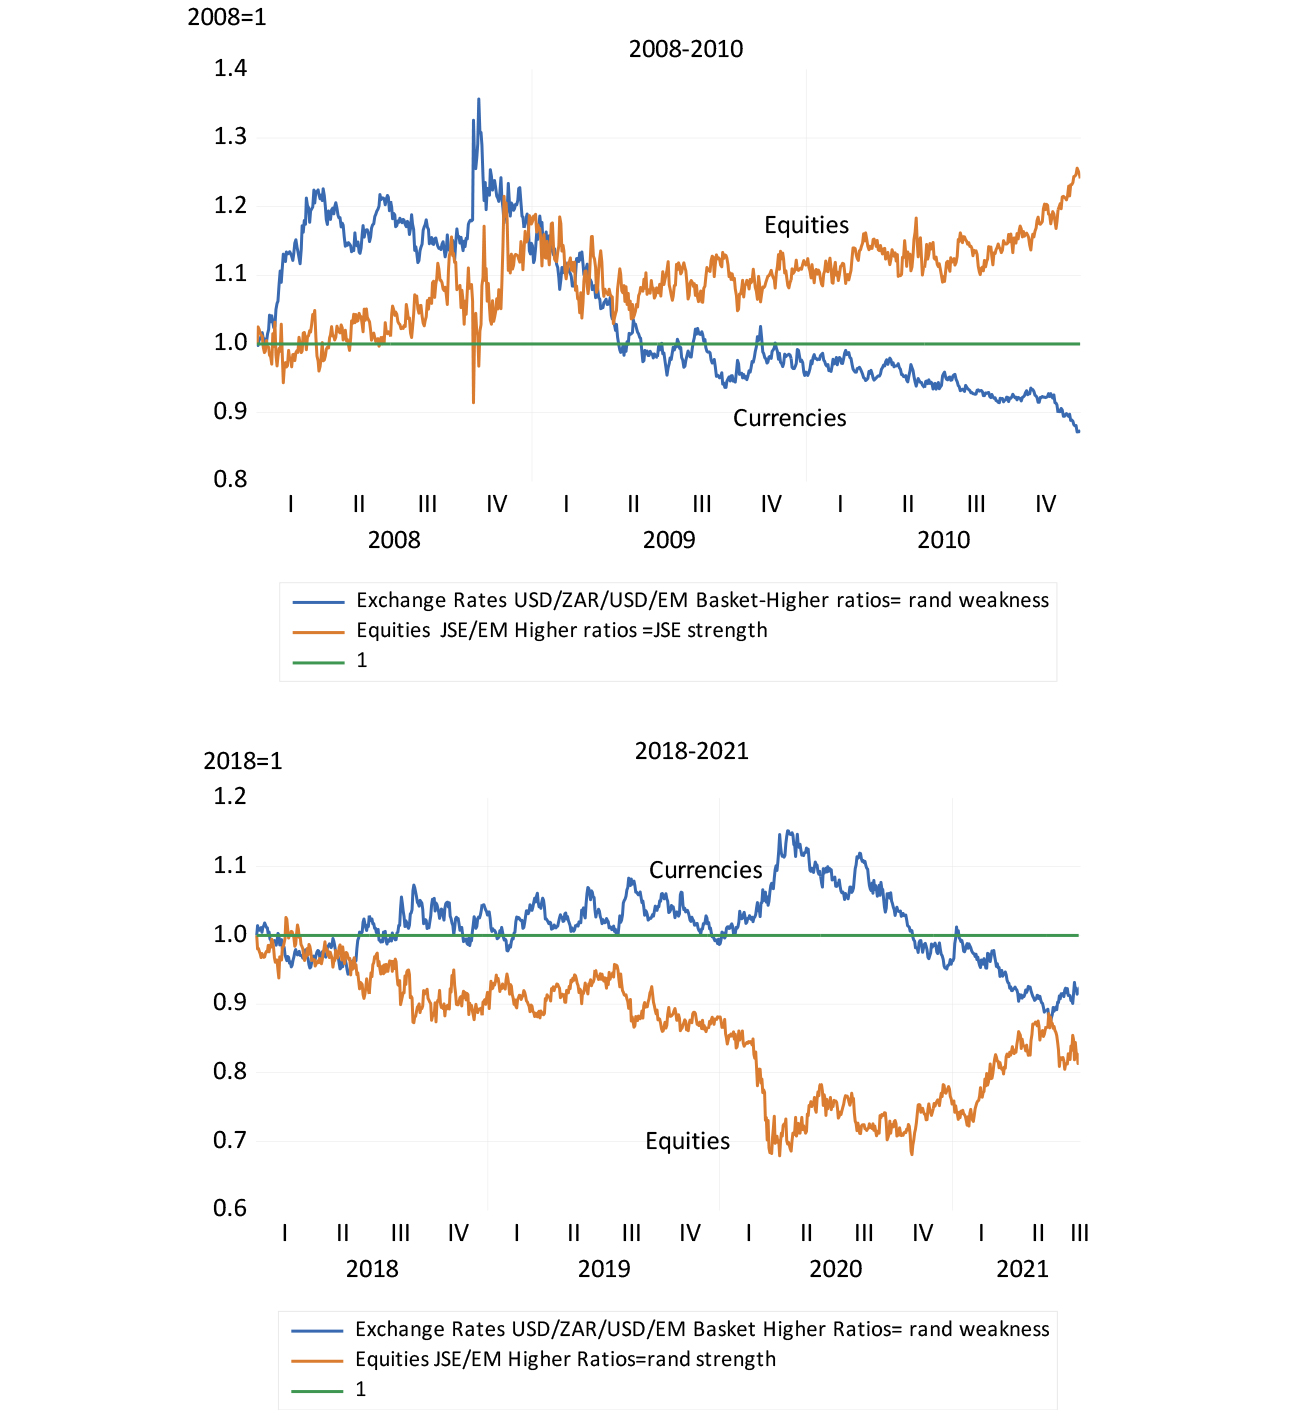
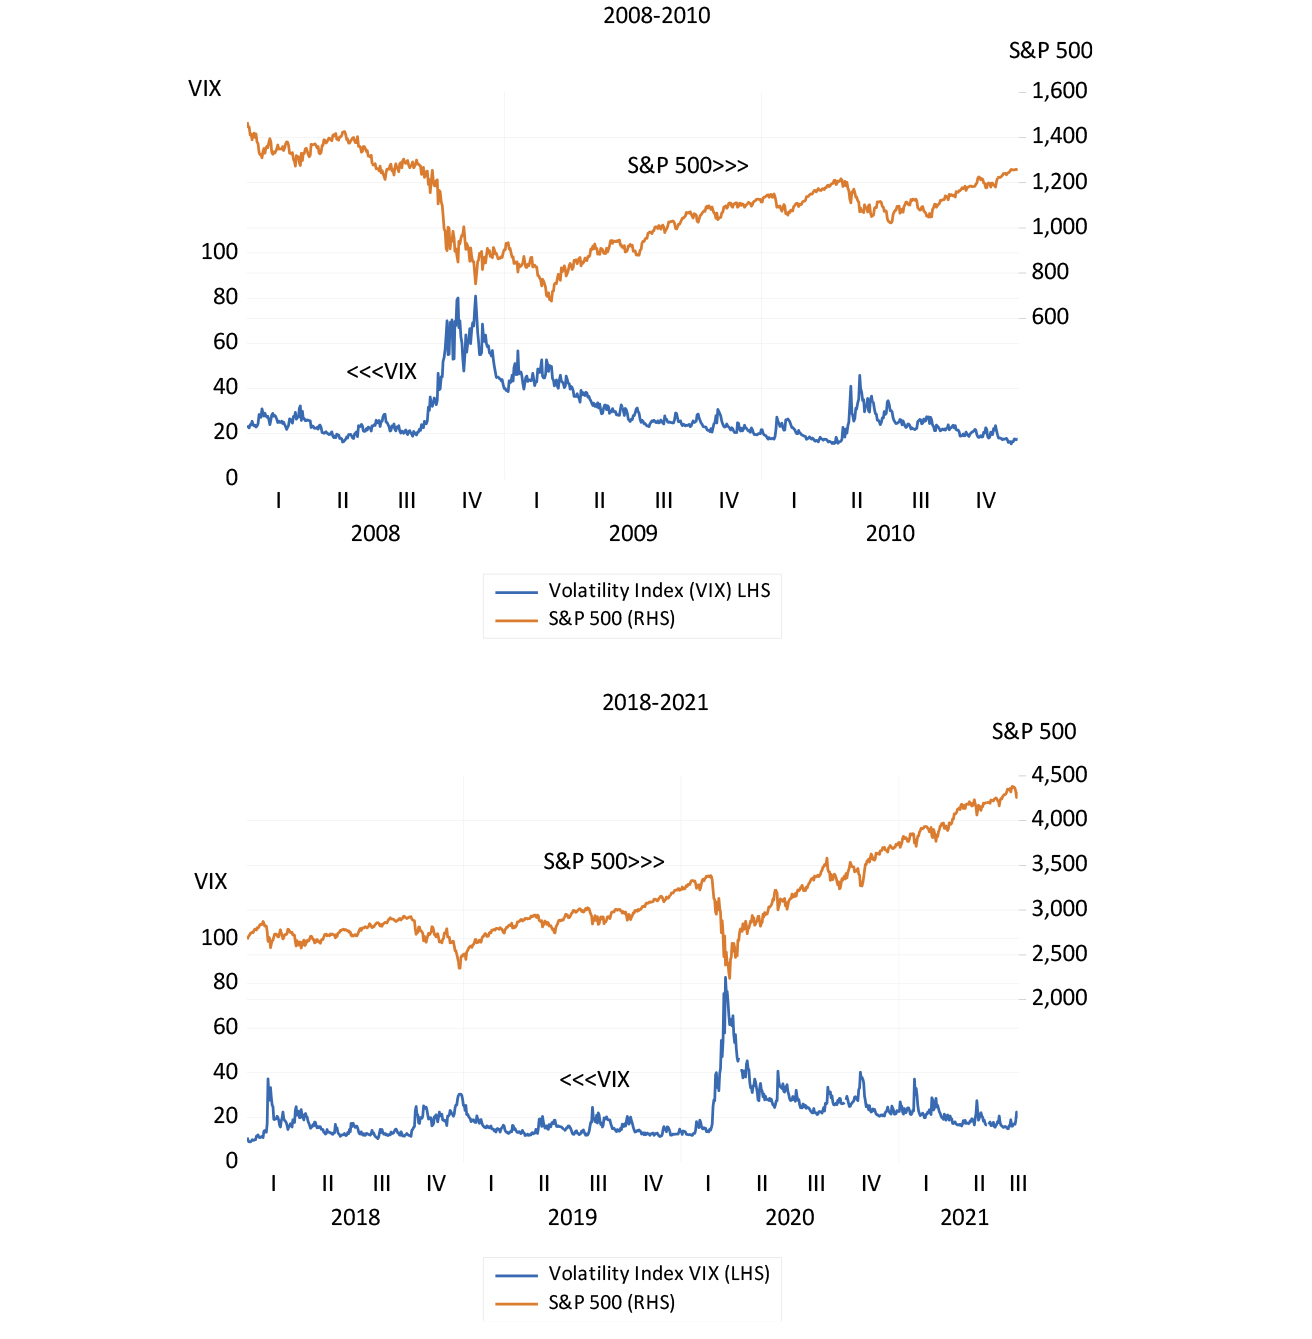
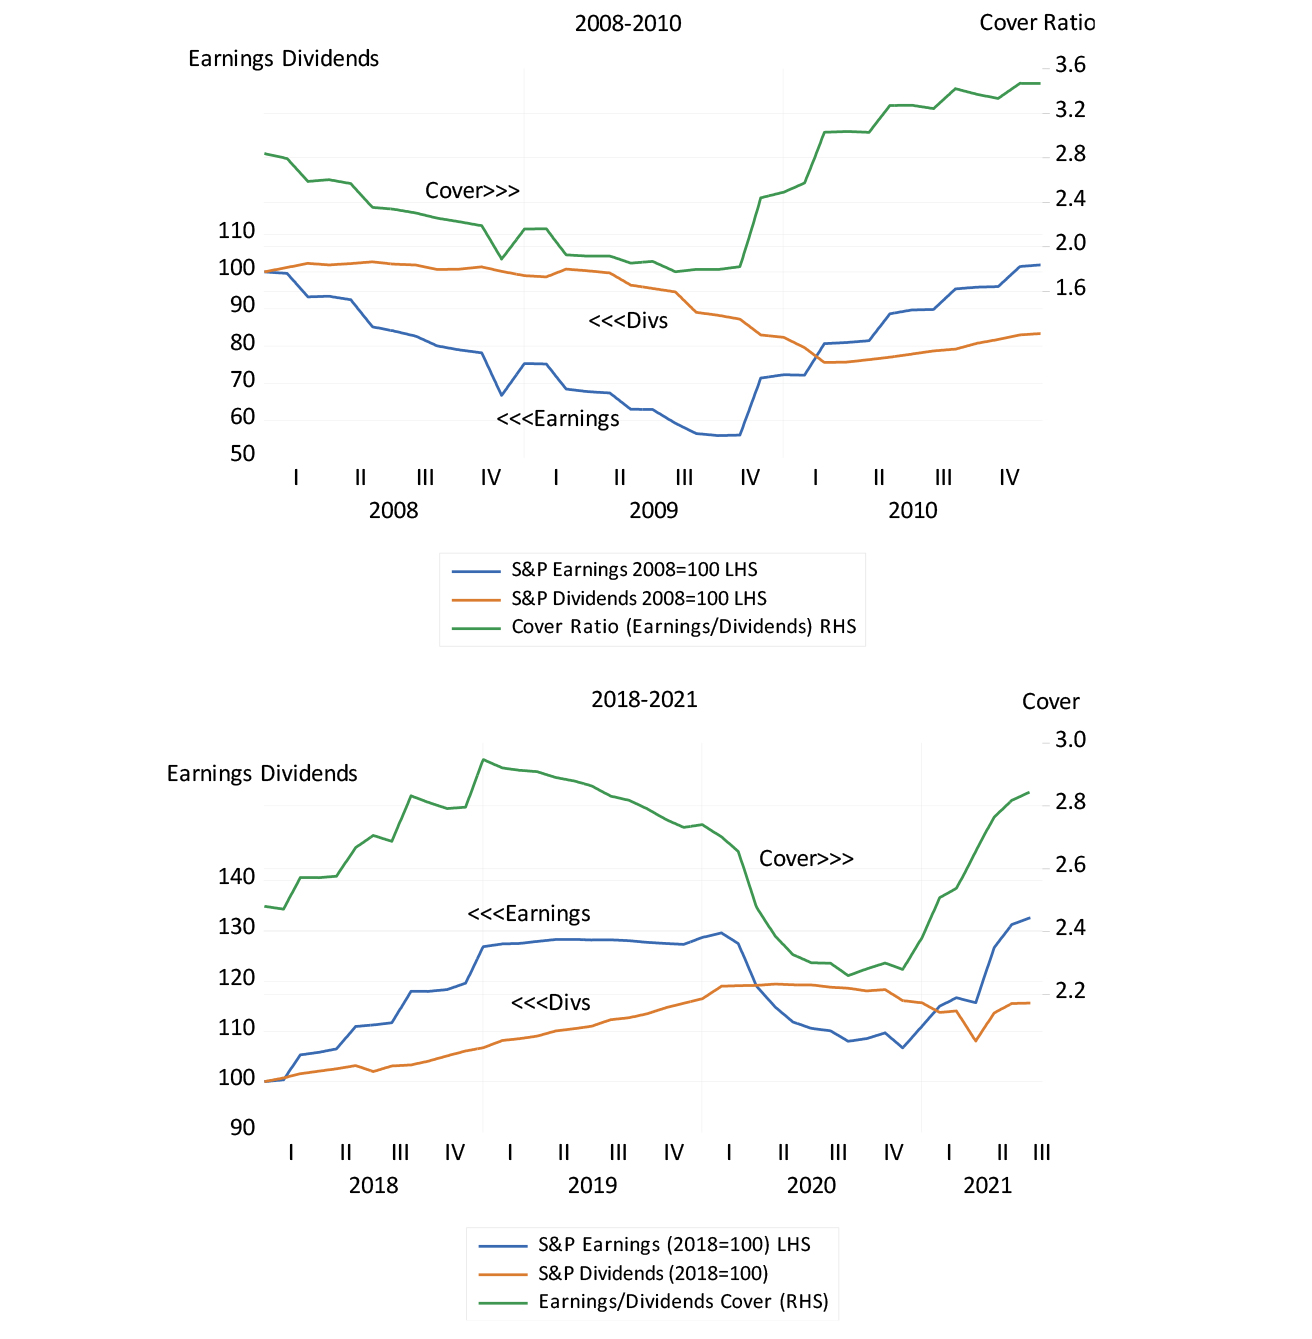
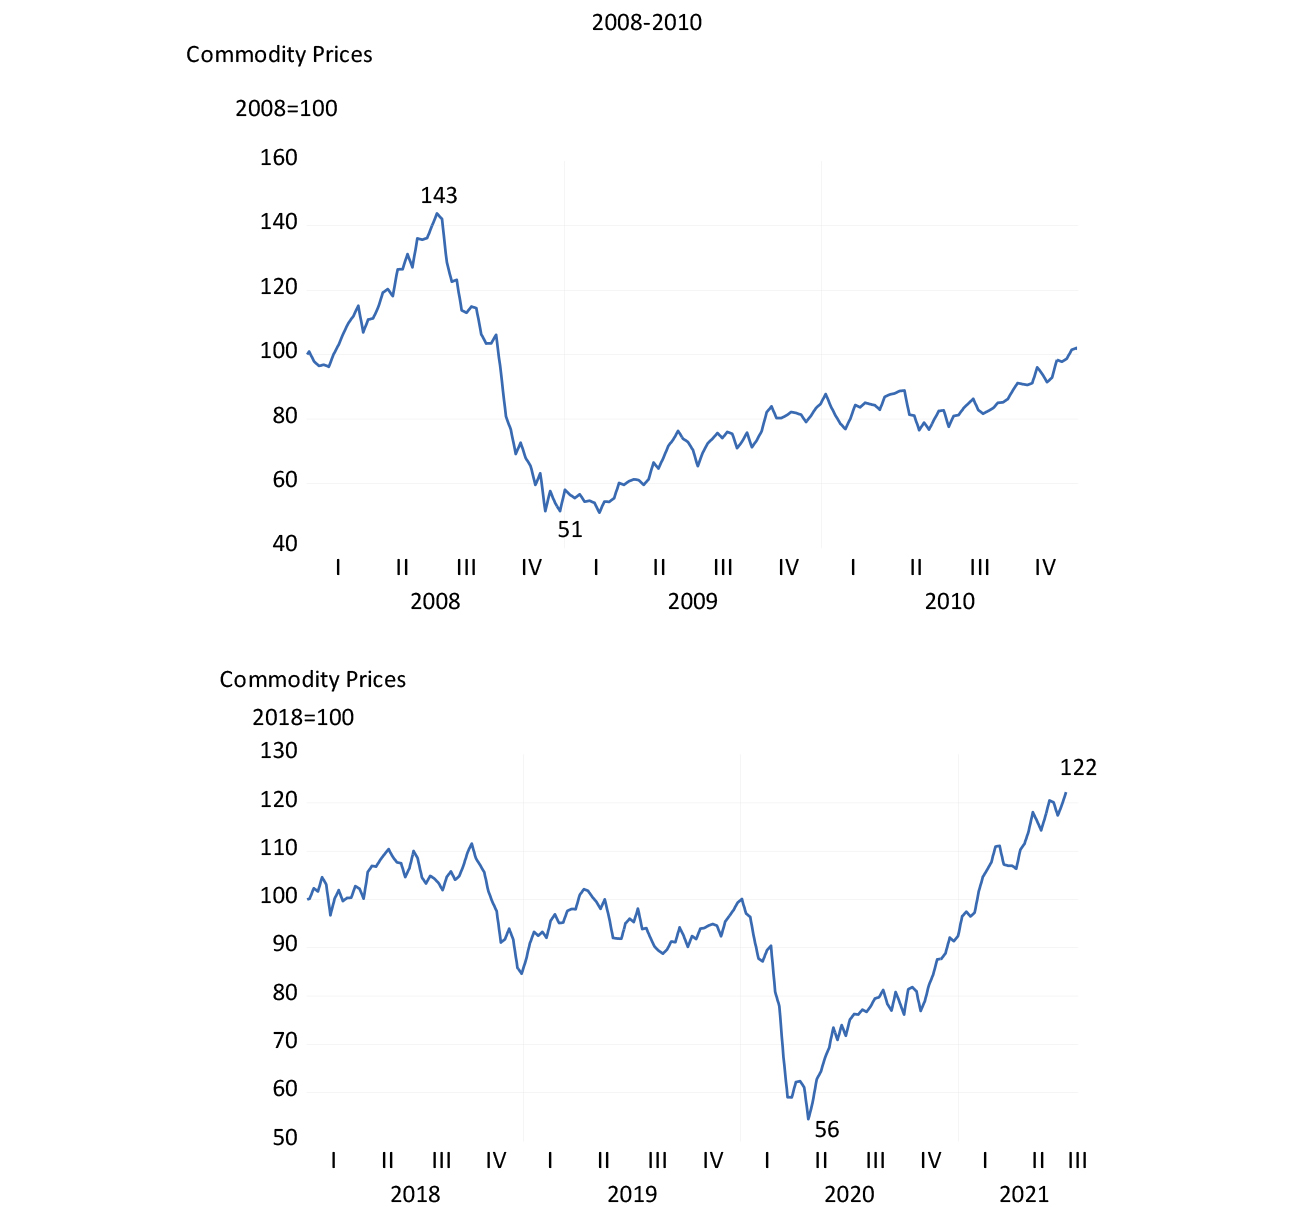
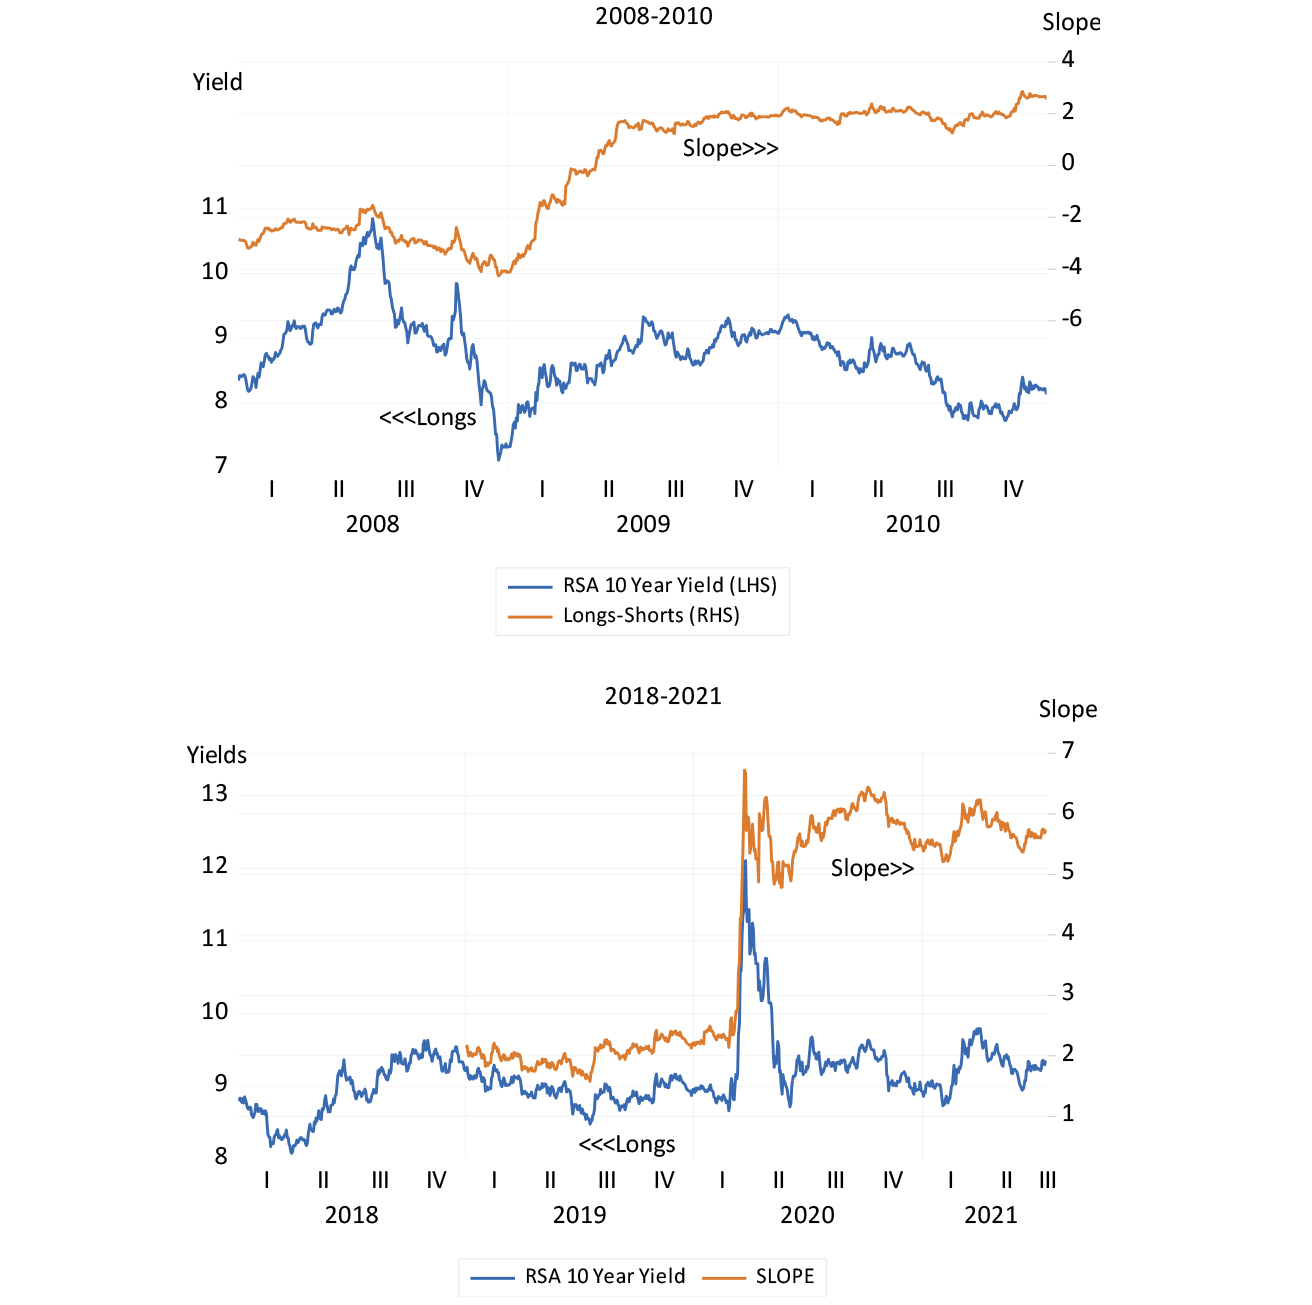
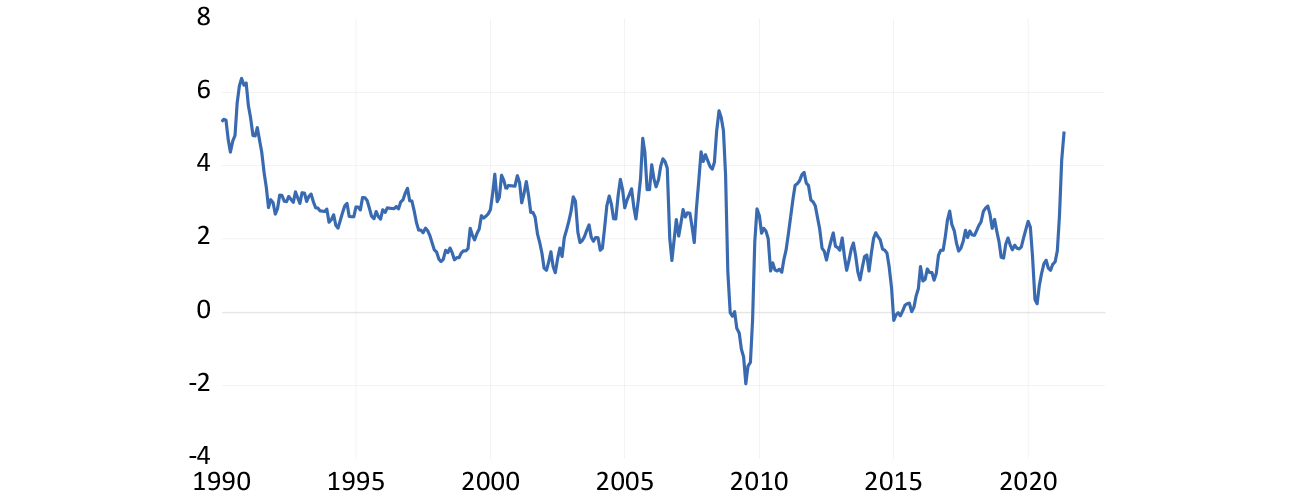
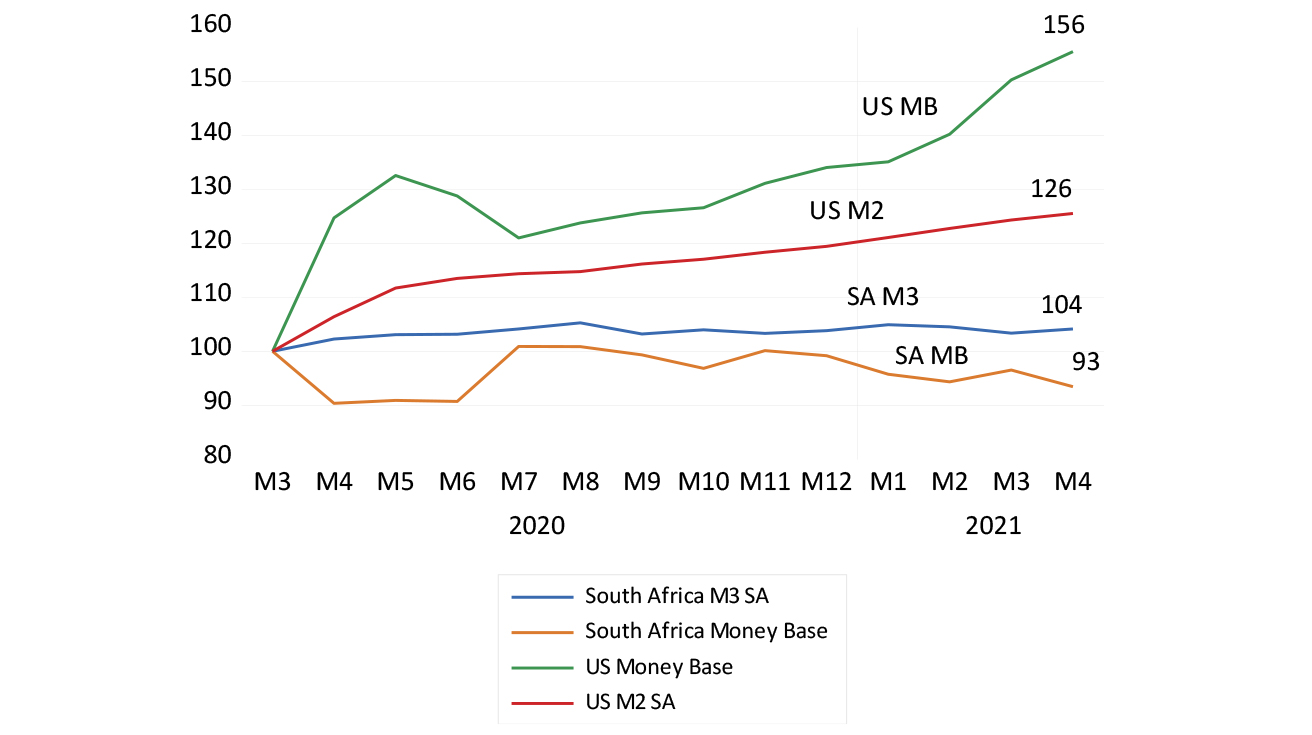
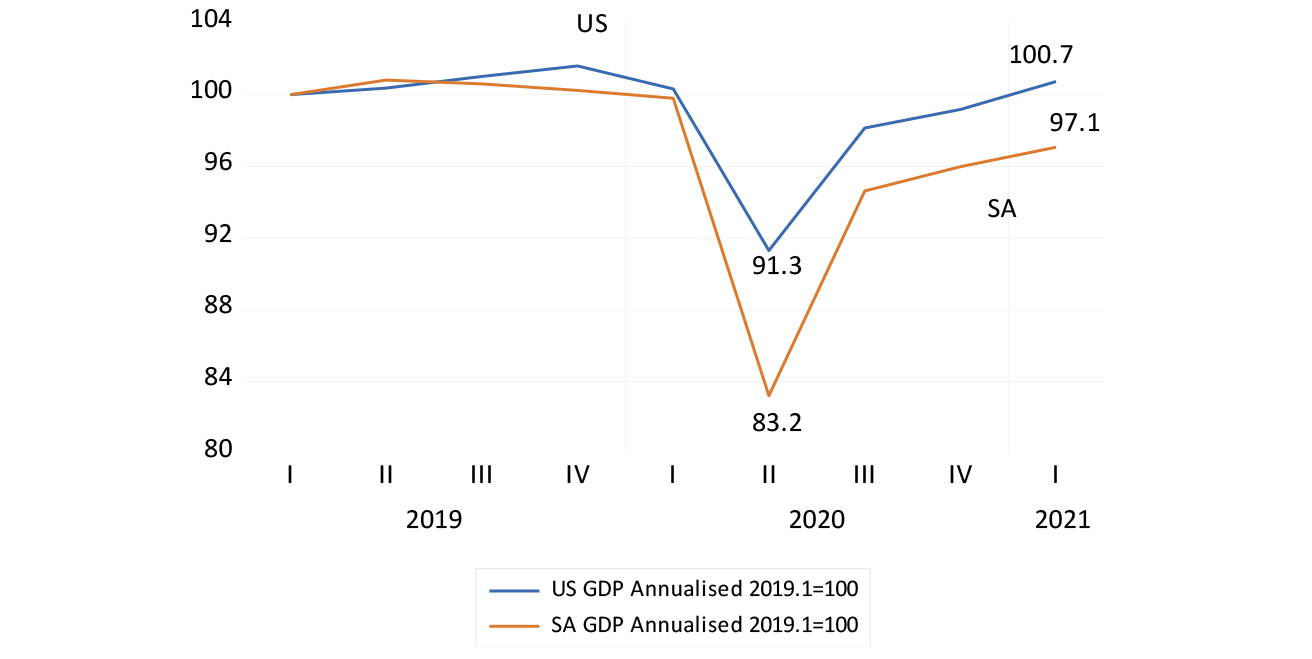
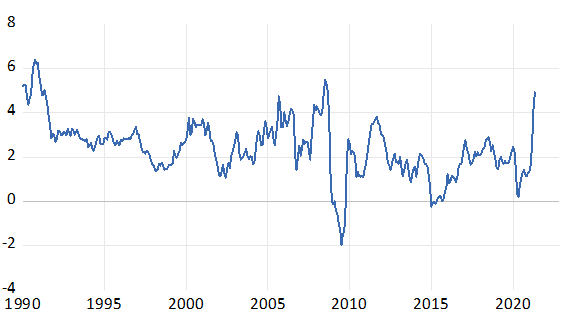
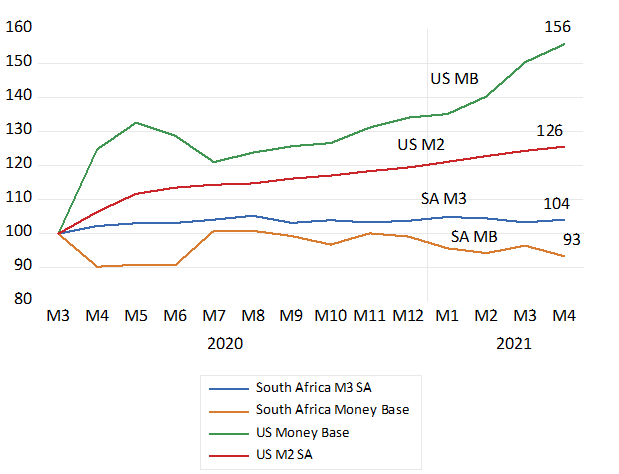
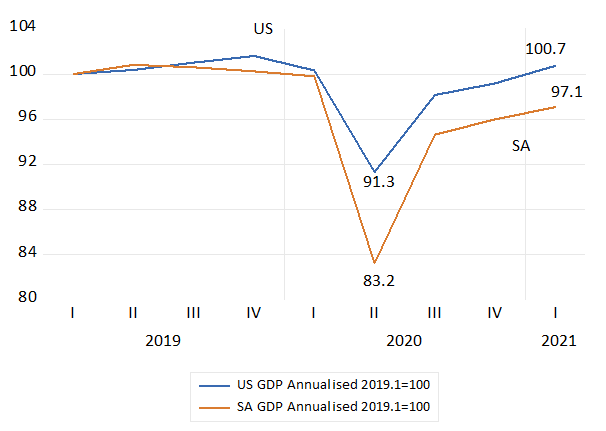
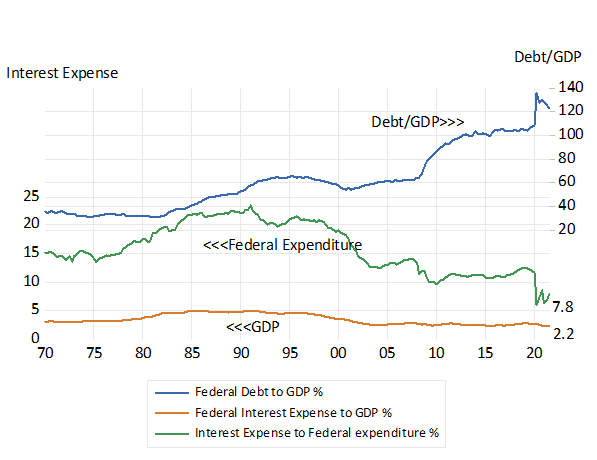
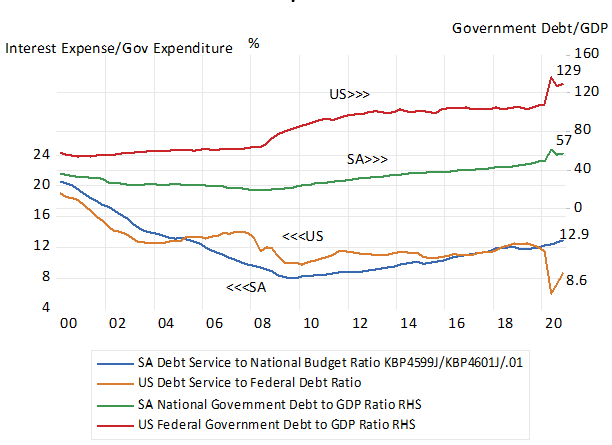