European debt crisis: Are we closer to the denouement?

How much would European Banks be required to write off of their loans to European governments? That is presuming a bad (not worst case) scenario of a 70% write down of Greek, Portuguese and Irish debt and losses of 30% on Spanish and Italian debt. The recent stress tests of 90 European banks and an IMF analysis of the CDS market provide some ball park numbers. The estimate is of the order of EUR260bn: a large amount but not nearly as much as the EUR700bn written off by European banks in the aftermath of the 2008-09 global financial collapse.

A consoling thought is that aside from the failures of their sovereigns, banks in Europe have little other additional exposure to private borrowers that they might have to write off. They have done very little additional lending lately, quite unlike the run up to the global financial crisis when lending growth was robust at close to a 10% annual growth rate.

Equity investors have made their own severe judgments as to the losses European Banks will incur. The Stoxx Europe 600 banks index is down just over 25% since1 August. Société Générale, France’s second-largest listed bank, has lost half of its market value since the beginning of August. Shares in Crédit Agricole, France’s number 3 bank, have dropped 35% while those of BNP Paribas, the largest French bank, are down 32% over the same period. More important perhaps than the absolute fall in the value of their shares, is that the market value of some of these banks is much diminished. This suggests very poor prospects for these banks and very little capacity to raise additional capital from their much damaged shareholders. Since 1 August the market value of Soc Gen has fallen from EUR25bn to its current value of EUR11.79bn while BNP is now worth EUR32.4bn compared to EUR52.4bn on 1 August. As far as shareholders are concerned they have already had to write off very large amounts of capital in their banks.

The question then becomes whether or not the European governments have the will and even perhaps the financial capacity to do what presumably the market place would be unwilling to do, and that is to recapitalize their banks. The alternative is a permanently impaired banking system unable to make the essential contribution to credit availability and economic growth that banks make. And a word of sympathy for banks – that is their shareholders – is in order. You can blame the lending officers of the banks for supporting US mortgage backed credit. You can hardly blame them for lending to their own governments – indeed they are obliged by regulation to do so because they are treated as being the safest of assets.

It can be expected that should some formal Eurozone governments’ defaults be acknowledged of the grave order indicated above (a possible but by no means certain event) governments will have to replenish the capital of their banks. Furthermore the liquidity strains of these banks will continue to be fully satisfied by the ECB – as they have to date. It is this support that has prevented a further melt down in Spanish and Italian debt as well as support for the banks using such debt as collateral for ECB support.

The responses of the US Fed and the US Treasury to the banking and financial crisis has very clearly pointed the way forward for European governments and the ECB. The very effective responses of the Swedish and Norwegian governments to their own banking crisis of the early 1990s are perhaps even better examples of crisis management closer to home.

The share markets may be pricing in not merely a bad case scenario of significant write offs of European government debt. They appear to be pricing a worst case scenario in which European governments and the ECB stand by and watch the European banking and financial collapse. This is a development that would not only harm its banks irreparably but would damage as irreparably the capacity of European governments to raise debt, a notion too ghastly to even contemplate. European leadership and technical central banking skills are surely capable of avoiding the worst case and be able to deal with what is a bad case fully discounted in the market place.

Hard Number Index: Has the gloom been overdone?

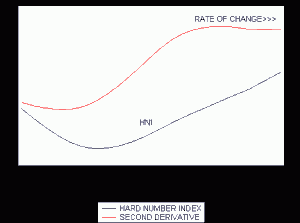
With the release of unit vehicle sales and the size of the note issue for August 2011 we are able to update our hard Number Index (HNI) of the state of the SA economy. As we show below the HNI confirms the SA economy is maintaining its growth momentum. The HNI for July and August 2011 show very little change. The economy appears to moving ahead at a constant speed.

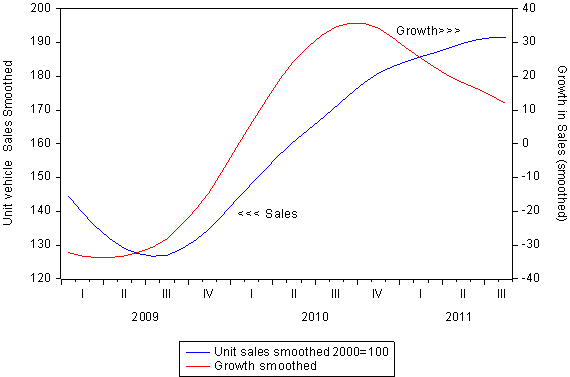
The HNI is an equally weighted mix of vehicle sales and the notes in circulation, adjusted for inflation. The vehicle sale cycle has turned lower – while still indicating good growth. As we reported previously vehicle sales in August recovered well from July 2011 levels – however this pickup in sales was not enough to reverse the declining growth trend.

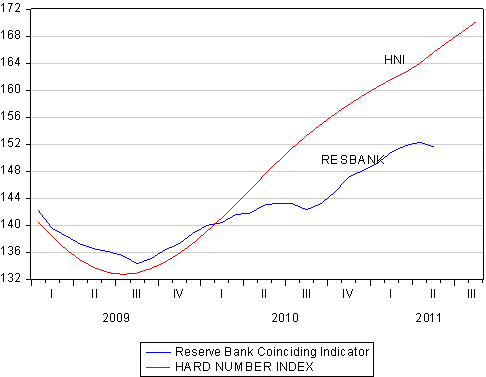
As we also show, the HNI provides a much more up to date measure of the current state of the SA economy than the Business Cycle indicator, released by the Reserve Bank (which is only updated to May). As may be seen the HNI and the Reserve Bank Indicator tuned up in the same quarter of 2009. It may also be seen that the Reserve Bank indicator turned lower in May 20011; though the subsequent progress of the HNI strongly suggests that this economic activity indicator will have followed the HNI higher since then.

The Hard Number Index and the Reserve Bank Coinciding Business Cycle Indicator (2000 = 100)
Vehicle sales smoothed (2000 = 100) and smoothed growth rates

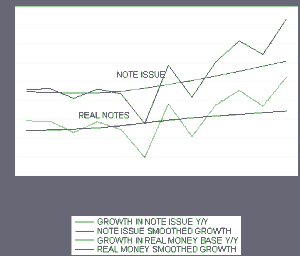
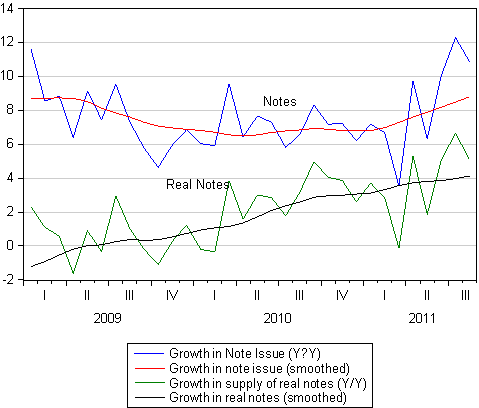
However what was negative for the HNI on the vehicle front was made up almost completely by the strength in demand for extra notes by the public and the banks. Adjusted for inflation, this growth in the note issue has picked up good momentum as we show below. This trend must be regarded as a very helpful one for the SA economy. Growth in the demand for and supply of notes indicates an improved willingness of the public to spend more. It has proved to be a very good indicator of the state of the SA economy. It suggests that the gloom about the prospects for the domestic economy may be overdone.

The notes in circulation cycle

The global economy: A semblance of normal service

The equity markets in New York appeared to gain some late afternoon relief yesterday from the Institute of Supply Management (ISM) survey of the state of nonmanufacturing activity (the NMI) in August. The survey is an influential and comprehensive one covering the very large proportion of economic activity in the US that is service rather than manufacturing based.

To quote the report:

“The NMI registered 53.3 percent in August, 0.6 percentage point higher than the 52.7 percent registered in July, and indicating continued growth at a slightly faster rate in the non-manufacturing sector. The Non-Manufacturing Business Activity Index decreased 0.5 percentage point to 55.6 percent, reflecting growth for the 25th consecutive month, but at a slower rate than in July. The New Orders Index increased by 1.1 percentage points to 52.8 percent. The Employment Index decreased 0.9 percentage point to 51.6 percent, indicating growth in employment for the 12th consecutive month, but at a slower rate than in July. The Prices Index increased 7.6 percentage points to 64.2 percent, indicating that prices increased at a faster rate in August when compared to July. According to the NMI, 10 non-manufacturing industries reported growth in August. Respondents’ comments remain mixed. There is a degree of uncertainty concerning business conditions for the balance of the year.”

Thus it may be presumed that the US economy is still growing but at a modest pace. ISM numbers above 50 indicate positive growth rates. In other words the US economy is not in recession which will have come as something of a relief to the increasingly bearish mood. The employment numbers and hiring intentions indicated in the survey however remain a continued source of economic weakness and uncertainty. The employment sub-index registered 51.6 – therefore also indicating growth but was down from the 52.5 level recorded for July 2011.

Clearly very weak employment growth is the Achilles heel of the US economy and presumably of the re-election ambitions of President Obama. He will address the combined houses of Congress on Friday – on his plans for the economy – but by all accounts expectations are not high about any immediate policy breakthroughs. What could do a great deal for business confidence in the US would be clear directions from the President and his administration that the long term fiscal and debt issues facing the US are being addressed in a serious and realistic way. The concern is that the focus of policy will be on additional short term stimulus measures unlikely to find approval in the House.

The European debt crisis continues to add uncertainty and volatility to the markets with the Spanish government (with the active support of its main opposition) leading the austerity stakes (including support for a constitutional amendment to entrench fiscal conservatism) and the Italian government trailing behind by a day or two – though seemingly able to push through its own austerity programme through the Italian Senate today.

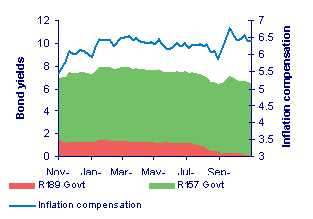
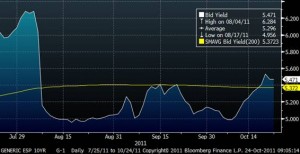
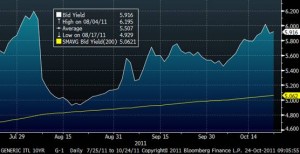
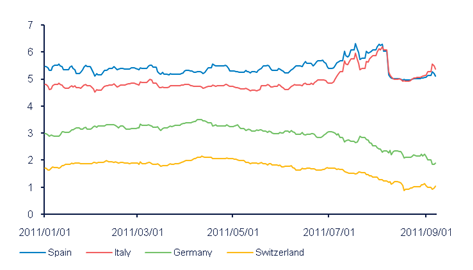
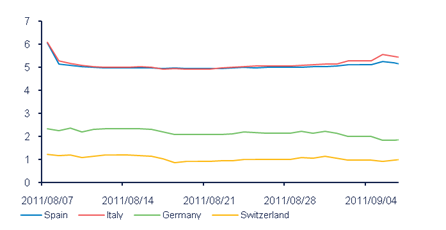
The reactions in the bond market are shown below. As may be seen Spanish 10 year bond yields have now fallen below Italian yields, having traded well above them this year. Such are the rewards for fiscal realism. As may also be seen these yields have been kept under control with ECB support this month. That the key governments under market stress seem able and willing even to bite the austerity bullet will help the ECB to maintain its support. Perhaps it will also encourage Germany to support a Eurozone bond market and the euro in Parliament: the German Constitutional Court has just ruled that this is the responsibility of the Bundestag Budget Committee – so rejecting claims that such support would be unconstitutional.

Euro 10 year bond yields in 2011, daily data
Euro 10 year bond yields in August 2011, daily data

Interest rates: From expectations of a hike to a reduction

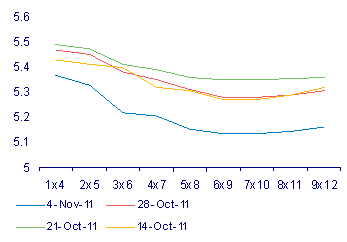
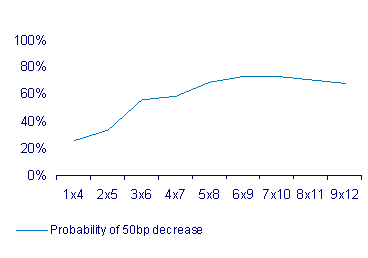
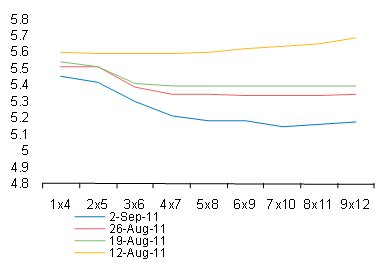
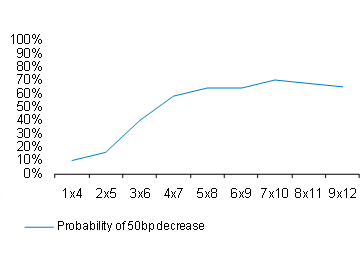
The money market is now pricing in a significant probability of a 50bps cut in the repo rate by early next year. The three month interest rates offered by the SA banks on forward rate agreements have been declining sharply since mid August and they declined further last week indicating a more than 50% chance of a 50bps cut within six months.

SA Bank Forward Rate Agreements (FRAs)
The probability of a 50bps cut in the SA three month interest rate

It seems clear that the focus of the Reserve Bank is now firmly on the state of the SA and the global economy rather than on any short term blips in the inflation rate, over which the Bank has little influence. Without a series of unexpectedly good news about the global economy (and the SA economy, especially about demands for credit), these lower interest rates (now factored into and expected by the financial markets) will become a very necessary reality.

New vehicle sales: Business boost

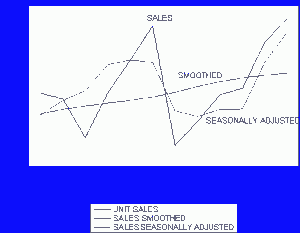
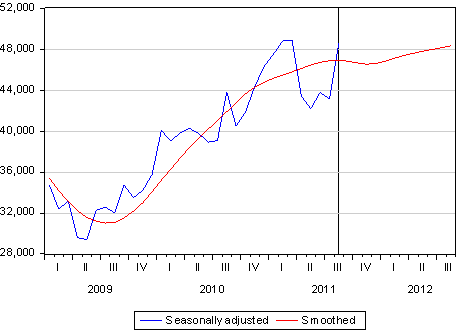
The producers and distributors of new vehicles enjoyed significantly improved trading results in August 2011. Domestic sales were up to 51 436 from 45 686 units sold in July 2011. On a seasonally adjusted basis this represented an impressive increase of 5 471 units in the latest month after flat to declining sales on a seasonally adjusted recorded after March 2011. This recovery, if sustained, would see monthly sales of between 46 000 and 48 000 units to August 2012. This would be regarded as a very satisfactory outcome for the largest contributor to manufacturing output in SA.

New unit vehicle sales (seasonally adjusted and extrapolated)

The recovery in August 2011 sales arrested but did not reverse the declining growth trend that became apparent earlier this year.

The new vehicle sales growth cycle

Sales to businesses, including passenger car sales to rental car companies, new light commercial vehicles, bakkies and minibuses, were particularly strong, while sales of medium and heavy trucks were especially buoyant in August. Export sales of 24 835 units were recorded in August which must also be regarded as satisfactory given uncertainties about the sate of the global economy.

Vehicle sales thus continue to be one of the SA economy’s brighter spots. That growth in demand seems now to be coming more from the investment decisions made by businesses is very welcome given the weakness to date in the willingness of the private sector to add capacity.

JSE earnings: No flash in the pan

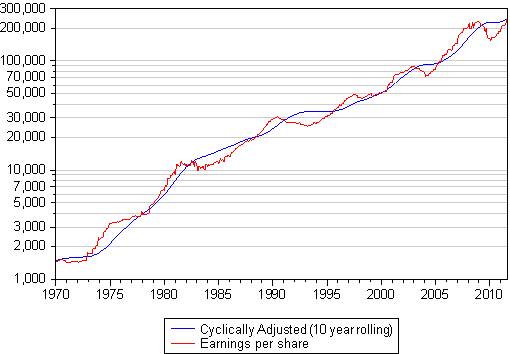
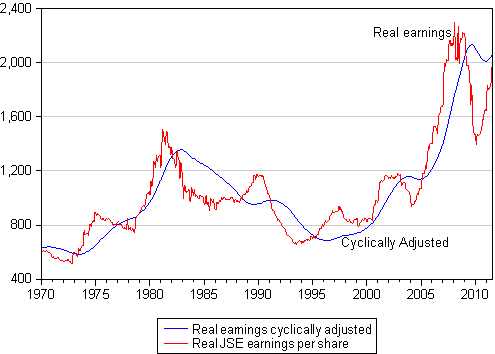
JSE Index earnings per share in current prices have now regained the previous record levels attained before the global financial crisis and the subsequent global recession, which caused earnings to decline very sharply. As we show below, real JSE earnings, adjusted for rising consumer prices, have also recovered very strongly (though are not yet back to pre crisis levels). This should be regarded as a very encouraging signal about the quality of the companies listed on the JSE.

In the figures below we also compare these earnings to what we measure as cyclically adjusted earnings. These are earnings that attempt to look beyond current earnings and the current state of the economy to establish the long term trends that should drive long term valuations. In current price terms JSE earnings per share by end August 2011 have regained their long term trend (a trend that factors in the post financial crisis decline). In real terms JSE earnings per share have a little way to go to regain their long term trend but are well set to do so.
JSE ALSI Index earnings per share- reported and cyclically adjusted
Real JSE ALSI Index earnings per share- reported and cyclically adjusted

The real earnings series pictured above deserves close attention. It should be noticed that in real terms JSE real earnings per share only regained their 1980 levels as late as 2005. This recovery in real earnings that began only in 2000 and continued to 2008 represented an extended period of exceptional growth. It was a huge boom in earnings and dividends for shareholders, which was closely linked to higher metal and mineral prices that had suffered from an extended period of deflation since the early eighties. The role of Chinese and Asian growth in stimulating demand for commodities has been crucial for the surge in commodity prices and the earnings of resource companies that account for close to half of all JSE earnings.

The important question that was asked at the end of the earnings boom in 2008 was whether or not earnings in real terms could ever recover their 2008 levels. Or in other words, could the surge in JSE earnings between 2000 and 2008 (that extended to all sectors of the JSE) form a new base from which JSE earnings could grow further in real terms?

The recent recovery in real JSE earnings, that are now almost back to their previous record levels, provides impressive support for the view that JSE real earnings have indeed established a new higher base. This is testament to the global reach of the companies listed on the JSE that are much more exposed to the global economy than the SA economy.

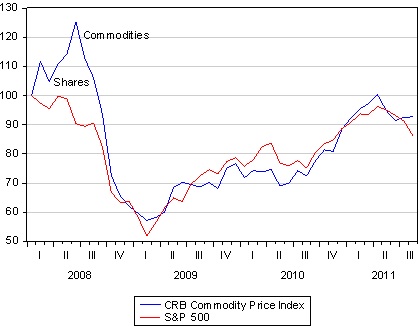
The outlook for JSE earnings in real or US dollar denominated terms will continue to depend upon the global economy from which commodity prices, equity valuations and the rand itself will take their cue. The global economy has recovered from the recession of 2009 and commodity prices have recovered accordingly. We show below that global commodity prices suffered even more than did equities from the financial crisis. However recently commodity and metal prices have held up better than equities, helping to support the view that global growth will not turn markedly weaker.

The S&P 500 and the CRB Commodity Price Index (2008 = 100)

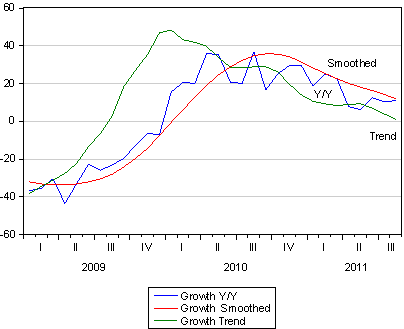
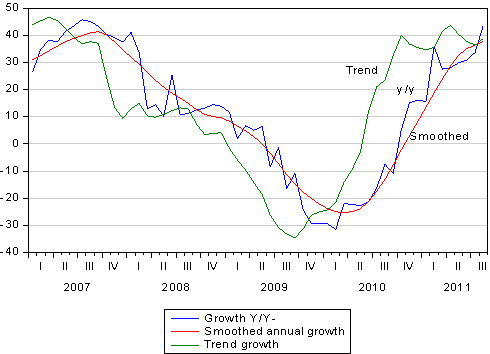
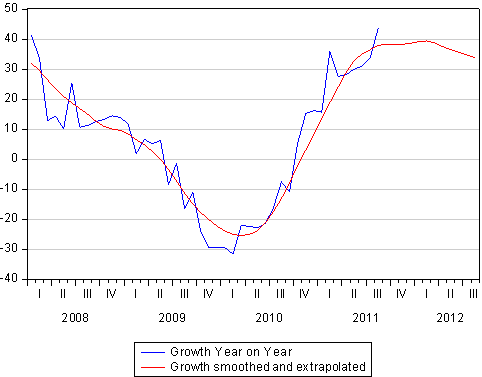
We show below that the JSE earnings cycle by end August 2011 (with many of the first half earnings reported) has realised growth rates to date of about 40%. As may also be seen the trends in this growth rate has not declined but appears to have stabilised at these levels. Thus if recent trends are maintained, helped essentially by stability in commodity prices, further growth can be expected. When we extrapolate recent trends it suggests that significant further growth in earnings per share may well be realised.

The JSE Earnings per share cycle to 31 August 2011

If this were to be the case for JSE earnings per share (as mentioned such earnings outcomes would have to be supported by sustained growth in the global economy) the JSE would be very well and further supported by very good earnings fundamentals.

The JSE earnings per share cycle, smoothed and extrapolated

Growth, money and credit: The case for a cut gets stronger

The updates to the money supply and bank credit statistics (to July 2011) and GDP numbers (second quarter 2011) indicate that while the economy grew in recent months, it was at a declining rate. As is the inconvenient practice in SA, the GDP output and income numbers arrive unaccompanied by the other side of the national income identity, the aggregate expenditure estimates. And given that the current state of the SA economy can be attributed to little demand rather than to limits on the supply side of the economy, it is particularly inconvenient not to have details and explanations about the state of aggregate demand in the economy.

The GDP statistics indicated that activity closely connected to demands from households grew satisfactorily in the second quarter. Government consumption spending accounting for 15.9% of the economy (on employment benefits and consumables such as stationery and travel expenses etc) grew by a robust 5.7% (seasonally adjusted and annualized, as are all rates in this discussion, unless otherwise stated) in the quarter, while activity in the wholesale, retail and transport sectors (13.7% of GDP) grew by 4.1%. Activity in the very important financial and associated business service sectors (21% of GDP), grew by a more pedestrian 2.9%.

The laggards were primary production: agriculture (3.3% of GDP) and mining (7.2% of GDP) that declined at a 7.8% rate in the quarter with mining output falling at a 4.2% rate in the quarter. Industrial output declined at a seasonally adjusted 5.2% annual rate while manufacturing output, with only a 12.7% share of GDP, declined at a disturbing 7% rate. It should be appreciated that mining volumes and mining revenues can tell a very different tale, as they did in this quarter, when mining sales and profits were buoyed by rising prices, while the volume of output that could be exported was seriously constrained by railway capacity. As an indication of an improved top line for SA business the gross operating (profit) surpluses of business grew from R315bn in the first quarter to R346bn in the second. This surplus in money of the day was 11% greater than a year before. Employees took home an extra R7bn in the second quarter, representing an increase of 10%.

Thus the share of operating surpluses in gross value added continued to rise, to 48% while employees share was 44%, with the balance of value added attributed to taxes on output. South African business continues to become more profitable hiring fewer, better paid employees, whose share in value added has declined (despite higher real remuneration). Productivity therefore must have increased, aided by less expensive capital (which was freely available with a lower risk premium).

Money and credit: The housing factor

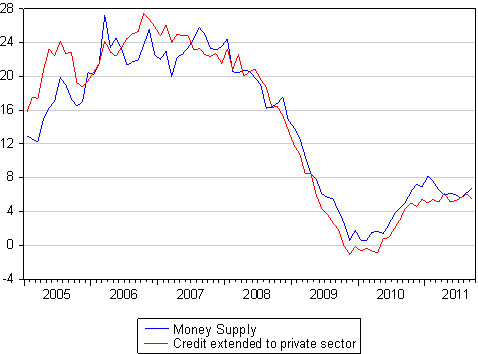
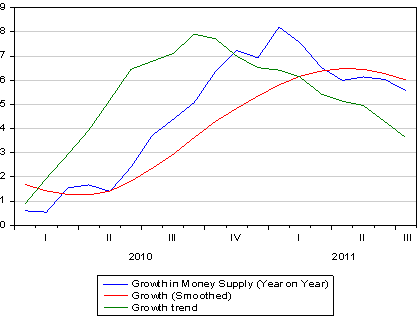
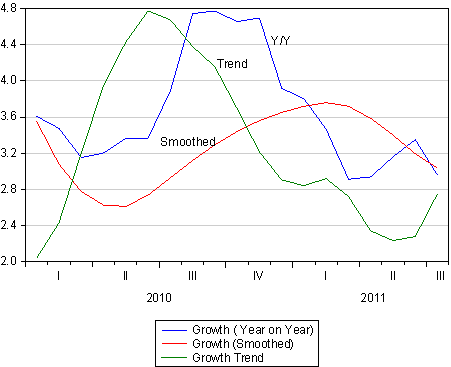
The underlying weakness in aggregate domestic demand is confirmed by the direction of money and credit supplies. As we show below the growth in the money supply broadly defined (M3) has picked up from mid recession growth rates of a year before. But the annual growth rates may well have stalled about the 5%-6% year on year rate. The private credit extended by the banks (approximately the other asset side of the balance sheets of banks) indicates a similar picture of growth, stabilizing at the 5% to 6% rate. The weakest aspect of bank lending, as may be seen, is mortgage lending. Growth in mortgage lending (while positive) appears to be declining to a roughly 3% year on year rate. This does not speak well of the housing market and the demand for extra building and renovation activity. Without a recovery in the housing market the top lines of the banks, about 50% dependent on mortgage lending, is unlikely to improve.

On the evidence of a slowing economy and growth in money supply and credit (which is barely keeping up with inflation), the case for lower interest rates to stimulate demand would seem uncontestable. The money market has begun to factor in the possibility of a cut in short term interest rates by the first quarter of next year. The odds of a 50bps cut in the repo rate are still below evens (about a 35% probability).

Unless the outlook for the domestic and global economies improves and money supply and credit growth pick up soon, these probabilities of a cut in rates will rise. Hindsight confirms what we have long argued, that interest rate settings in SA have been too high for too long for the sake of the economy – without any obvious influence on the exchange rate or the inflation outlook.

Growth in money supply
Growth in mortgage lending

The Eurozone crisis: Mme Lagarde’s three steps to salvation

Christine Lagarde, now head of the IMF and recently Minister of Finance in the Sakorzy government, told the Jackson Hole Conference of central bankers on Saturday of the three key steps that Europe should take to work its way out of crisis:

Step 1 she recommended, was to “… sustain sovereign finances – more fiscal action and more financing….” and cautioned that this did not require “…. drastic upfront belt-tightening—if countries address long-term fiscal risks like rising pension costs or healthcare spending, they will have more space in the short run to support growth and jobs. But without a credible financing path, fiscal adjustment will be doomed to fail. After all, deciding on a deficit path is one thing, getting the money to finance it is another. Sufficient financing can come from the private or official sector—including continued support from the ECB, with full backup of the euro area members.”

Step 2 was more urgent and perhaps more controversial.

That is to say, European banks “….need urgent recapitalization. They must be strong enough to withstand the risks of sovereigns and weak growth. This is key to cutting the chains of contagion. ……The most efficient solution would be mandatory substantial recapitalization—seeking private resources first, but using public funds if necessary. One option would be to mobilize EFSF or other European-wide funding to recapitalize banks directly, which would avoid placing even greater burdens on vulnerable sovereigns…..”

European banks face a large difficulty that is not of their own making. Holding debt issued by their own sovereigns has always been regarded as the safest way for banks to lend out the cash they take in as deposits. Indeed they are often required by regulators to hold significant quantities of securities issued by the government and its agencies. Holding the debt issued by foreign governments has been optional for banks and some governments are more risky than others and pay higher interest rates accordingly. European banks currently own 45% of all European Government debt: some good, some bad and some downright ugly.

The notion that members of the Euro monetary union could default on their debts was unthinkable until recently. Ordinarily governments escape default on debt denominated in their own currency by requiring their central banks to monetize their debt.

The problem when a government is printing cash to fund its expenditure is potential inflation, not default. But, in the terms of the European Monetary Union, only the European Central Bank (ECB) can issue more euros. In the absence of a fiscal union to accompany a monetary union, such powers to print money to resolve a banking crisis have been compromised by national rather European interests. The fiscally sound members of the monetary union, mostly located in Northern Europe, are reluctant to subsidise the fiscally irresponsible members of the union to the south of them. For the central bank to treat all the government bonds issued by all European governments as having the same face value when exchanged for ECB deposits would mean a subsidy to the profligate.

In reality the ECB has been accepting government securities of all kinds without distinction offered to it by all European banks in exchange for cash at its discount or repurchase window. It has pumped in large supplies of cash to European banks who have demanded cash from the ECB, accompanied by collateral in the form of Euro government debt. Such action is within its discretionary powers. Had it not lent so freely Europe would have suffered a run on all its banks and a liquidity crisis. The decline in the yields on Italian and Spanish government bonds has revealed the success these ECB purchases have had in calming the Euro bond market.

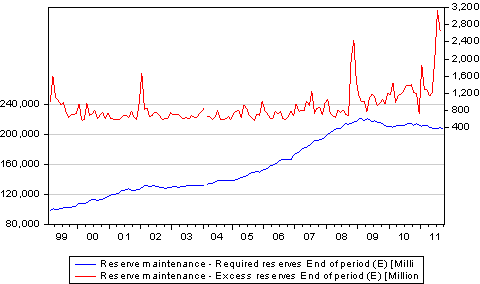
That there is no liquidity crisis in Europe is identified by the increase in the cash held by European banks well in excess of their legal requirements to hold cash. As we show below European banks are following the example of the US counterparts in building up their cash reserves at the expense of their lending.

European Banks - Actual and excess cash reserves

What the ECB cannot do of its own volition is the equivalent of the QE2 or TARP (Troubled Assets Recovery Program) activities conducted by the US Fed and the US Treasury. That is, they cannot go directly into the markets and offer to buy government securities and mortgage backed securities on a large scale to inject liquidity and (more important in the case of TARP) to inject fresh capital into the banks and other financial institutions.

As Mme Legarde has identified, it is capital rather than cash that the European banks are short of. Such a need to raise more capital is reflected by the lower values attached to the shares of European banks. European banks are trading at about half the value of the assets on their books. Their books have an important part made up of suspect government securities which may not have been written down to reflect market realities; while the scope for increasing the size of their books is impaired by the weak Euro economies. This decline in the equity market value of the banks makes them more vulnerable and less able to raise meaningful amounts of capital from their shareholders.

They need the equivalent of a Warren Buffett to come to their rescue, as he did with Bank of America. Failing this shareholders may have no choice but to subscribe to deeply discounted rights issues offered by banks that might otherwise go out of business. The further alternative is of course to rely on governments to subscribe to the capital of banks. The banks may hope that capital provided by governments is a temporary provision (as it has proved to be in the US where banks have paid back the government with a profit) and also not accompanied by too much political interference in the business of banking.

This then brings the discussion to step 3, which Lagarde believes Europe will have to take if it is to enjoy a full recovery and retain its monetary and banking systems in more or less their present form.

To quote her: “Europe needs a common vision for its future. The current economic turmoil has exposed some serious flaws in the architecture of the eurozone, flaws that threaten the sustainability of the entire project. In such an atmosphere, there is no room for ambivalence about its future direction. An unclear or confused message will add to market uncertainty and magnify the eurozone’s economic tensions. So Europe must recommit credibly to a common vision, and it needs to be built on solid foundations—including, for example, fiscal rules that actually work.”

The European monetary union is being sustained by the ability of the ECB to print money to keep its banks and governments afloat. The crisis is being overcome this way. Any permanent solution to the issues Europe faces requires fiscal stability and a fiscal union that effectively limits government spending in Europe to what European taxpayers can support. The hope for Europe is that fiscal responsibility can only be realized by governments spending less – especially in ways that discourage the work, savings and enterprise of its citizens. The limits to the taxes European governments can collect has long been exceeded, as its fiscal crisis makes clear.

Equities: The commodity cue

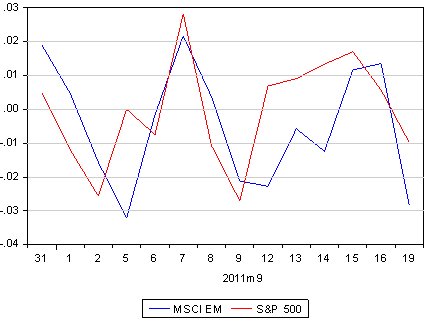
The JSE has continued to take its cue from global equity markets as has the rand. In recent days emerging market equities have lagged behind the S&P 500, with the weaker rand adding some rand value to the JSE.

Equities markets in Q3 2011 (30 June 2011 = 100)

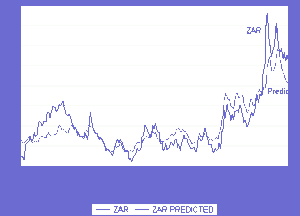
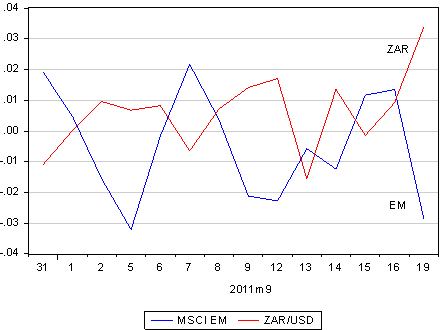
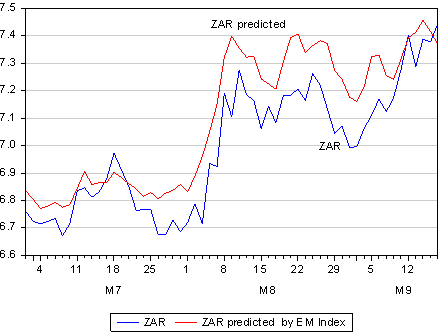
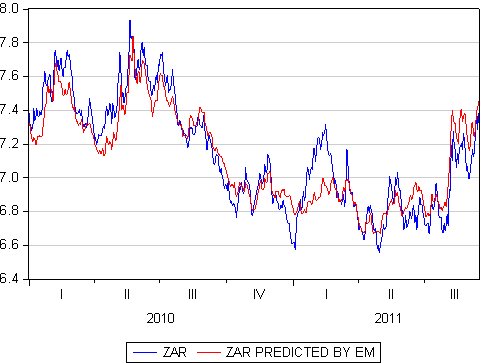
The rand itself has continued to closely follow the direction provided by the emerging equity market Index. As we show below, the rand, if anything, is a little stronger rather than weaker than might have been predicted, given the level of emerging equity markets.

The rand and as predicted by the MSCI EM Index

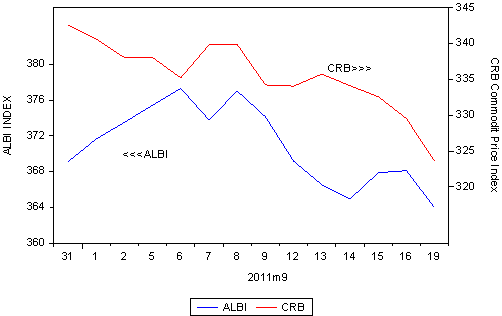
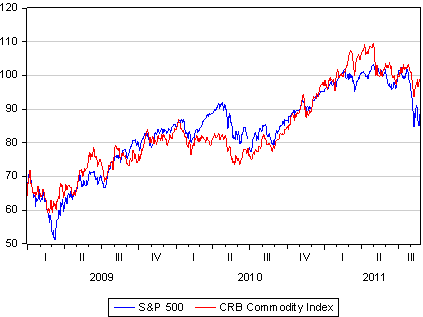
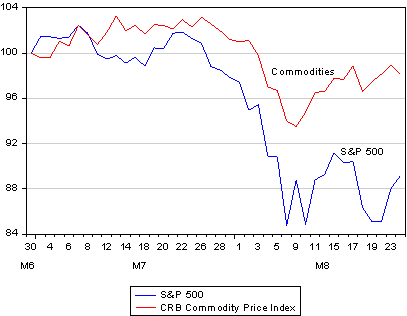
The relationship however between equity and commodity markets has not proved so regular over the past few weeks. As we show below commodity prices have held up much better than equity markets. The anxieties that infected equity and debt markets have not damaged commodity markets to anything like the same extent as occurred during the financial crisis of 2008. As we also show below, commodity prices and equity values have tracked each other closely since 2008 as both sets of prices reflect the growth in global economies. These unusual recent trends in commodity prices relative to equities hopefully indicate that the outlook for global growth has not deteriorated as much as feared by equity investors. If so, the demand for equities may also come to be encouraged, as the demand for metals and commodities has been, by extraordinarily low interest rates.

Equity Markets (S&P 500) and Commodity prices 2009- 2011 (30 June 2011 =100)
Equity markets (S&P 500) and commodity prices, Q3 2011 (30 June 2011 = 100)

Gold: What the gold price move is telling us

What explains the recent ascent of the gold price to record levels? Is this a sign of extreme anxiety about the state of the world – the end of the world as we know it – or perhaps something else, more easily explained by economic fundamentals?

The performance of gold since 2007 has been impressive indeed. The price of gold has risen almost uninterruptedly since early 2007, by about four times since then, with rather low volatility from day to day. Good returns with low risk are a very attractive combination very likely to attract investor interest. More impressive still is that the price of gold was hardly affected by the global financial crisis of 2008-09 when other commodities and metals (and also equities) fell away so dramatically.

The price of gold, copper and oil (January 2011=100)
Oil price over gold price

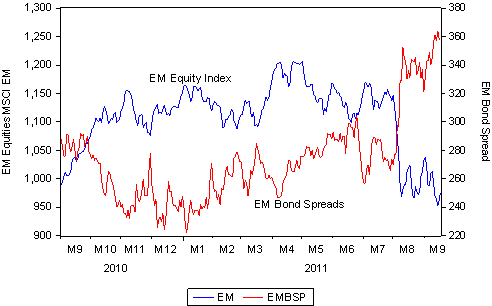
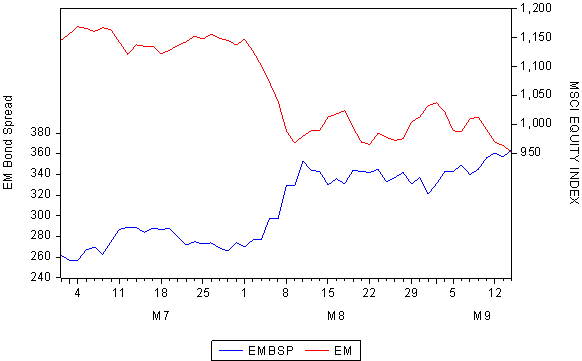
The times have become more uncertain, as is revealed by the indicators of risk and volatility in the form of the volatility priced into options on the S&P 500 (The VIX) as well as the risk spread offered by emerging market (EM) government bonds over the yield on US Treasuries. But as we show below, while these risks have increased significantly lately driving down equity and EM bond prices, they are a far cry from the risks priced into markets at the height of the financial crisis. This is especially true of the emerging market bond spreads which are far below those crisis levels. There may well be a crisis of confidence in global financial markets but, so far at least, it is one far lower on the financial Richter scale than was the crisis of 2008.

Indicators of global financial risk

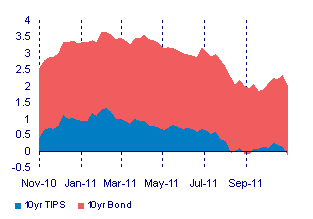
How then to explain the much higher price of gold and its more or less continuous ascent? The cost of holding gold is interest income foregone. Perhaps more relevant as an opportunity cost of holding gold is real, after inflation interest rates foregone. As we show below the price of gold has gone up as real interest rates have fallen. The relationship between the falling real yield on a US 10 year inflation linked bond (TIPS) and the US dollar price of gold over recent years an almost perfectly negative one: the correlation statistic is (-0.90).

Real Interest Rates and the Price of Gold

Gold has gone up as real interest rates have fallen, in a highly consistent way, with the yield on a 10 year Tips now a negative one. Investors are paying up for the right to an inflation linked yield.

Holding cash at even a zero (not negative) yield would seem to offer a superior return. However holding cash is usually in the form of deposits in a bank, which (so some fear) may not to be able to pay the cash back at full face value. This anxiety about the future of banks and uncertainty about future inflation (which may flare up again), may be part of the explanation for negative real interest rates and so the higher price of gold.

However the lack of demand for capital to invest, combined with abundant supplies of savings emanating from China in particular, is a further part of the explanation for very cheap capital and so very low costs of owning gold. These low costs of ownership apply also to other commodities and for that matter equities that pay more or less inflation linked dividends. That gold and other commodities should have so dramatically outperformed equities recently is perhaps the bigger mystery than the price of gold.

The European Debt Crisis: The Latest Twist

The latest twist to the euro debt crisis has come in the form of US money market funds withdrawing cash from European banks. However the European Central Bank (ECB) can print all the cash the banks may require – in exchange for collateral (including European government’s sovereign debt) provided by banks – to replace the deposits lost by the European Banks. This process is well under way.

The ECB in its latest August Monthly Review editorial said that there was “ample liquidity” in the system; enough to keep the ECB still explicitly worried about inflation (amazingly so). Besides indicating its almost ritual concerns about inflation, the editorial also discusses the liquidity supplementing actions under way. To quote the editorial: “While the monetary analysis indicates that the underlying pace of monetary expansion is still moderate, monetary liquidity remains ample and may facilitate the accommodation of price pressures.”

Reference is also made in the editorial to the large and unusual steps that are being taken to add liquidity to the system. To quote the ECB again: “As stated on previous occasions, the provision of liquidity and the allotment modes for refinancing operations will be adjusted when appropriate, taking into account the fact that all the non-standard measures taken during the period of acute financial market tensions are, by construction, temporary in nature…”.

A primary task of any central bank is to save the financial system from imploding for want of liquidity (cash) – caused by a run on the banks – by providing liquidity that it can create without any cost. The withdrawal of US money market funds from Euro banks may be regarded as such a run which could engulf all European banks if it is allowed to degenerate into some kind of panic. This would affect even those banks with strong balance sheets.

Only the ECB has the power to print euros to support the system (the other national central banks tied to the euro no longer have this power). If these other central banks were not constrained by fixed exchange rates to the euro they would be printing money to save their own banks; and if they could there would be no sovereign debt crisis, only an inflation danger. Yet despite QE1 and QE2 and vast amounts of cash injected into the US financial system (that saved it from imploding) the danger of US inflation remains a very distant one, as indicated by very low yields on US Treasury Bonds. The low yields on German bonds indicate the same and make the ECB’s concerns with inflation given the current uncertainties seem otiose. It should be encouraging to those anxious about the future of European banks, their sovereigns and the euro that current spreads on Italian and Spanish government bonds have declined from well over 6% and stabilised around the 5% level. Any downward move in these yields would be comforting; any significant move higher would add to anxieties.

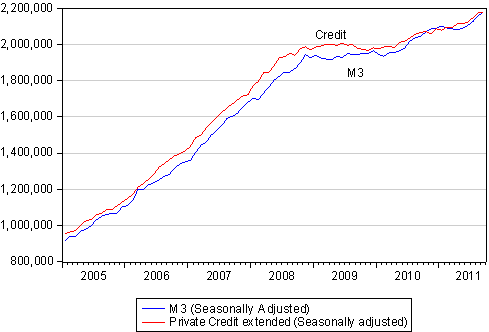
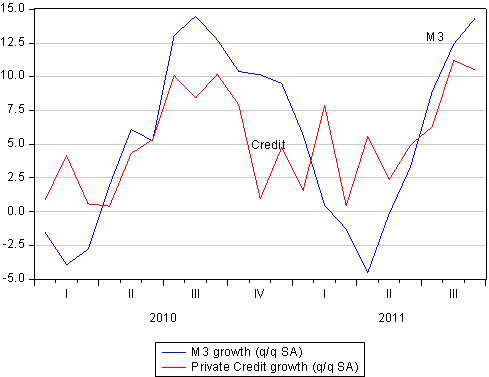
The ample liquidity that the ECB refers to is taking the form of increases in the deposits the Euro banks are holding with their central banks. Like their US counterparts the banks in Europe are holding cash in excess of their legal reserve requirements though, as in the US, not enough cash to prevent the European money supply, broadly defined, from growing. Though, as we show in the chart below, this money supply growth may be slowing down in Europe while picking up in the US. This pick up in money supply growth rates, despite little growth in bank lending, is very welcome and not consistent with a recession.

M3 Growth - Source: ECB
Money supply (M2) and bank lending growth in the US

The question is asked as to why European banks are now valued at considerably less than the value of their books. The answer is that it is only partly to do with the crisis of confidence in the survival prospects of the banks themselves. The quality of the assets on the books of the banks, including sovereign debt, is suspect. Also, the banks are holding more cash earning very little or no interest income, implying lower earnings to come. Furthermore, of perhaps greater significance for the value of banks, the European banks will have to or be required to raise additional capital to secure their futures. The capital may come from the market or, if shareholders are not forthcoming, from their governments. The earnings outlook for European banks is not promising. They will survive – but may not be able to generate returns on capital that justify any premium to book value.

The interest rate outlook for SA has changed dramatically

There have been dramatic developments on the SA interest rate front over the past two weeks. The money market, having confidently predicted an increase in short term rates this year or early next year, now very confidently expects short term interest rates to stay on hold for 12 months or more. The figures below tell the story of how the prediction of slower global growth has influenced the outlook for the SA economy and so interest rates. The case for lower interest rates in SA, one we have made for some time, has become even stronger and might in turn become reflected in a negatively sloped rather than flat short term yield curve.

The short term yield curve as implied by three month Forward Rate Agreements
Probability of a hike

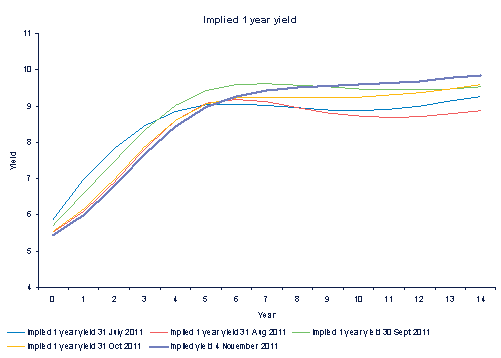
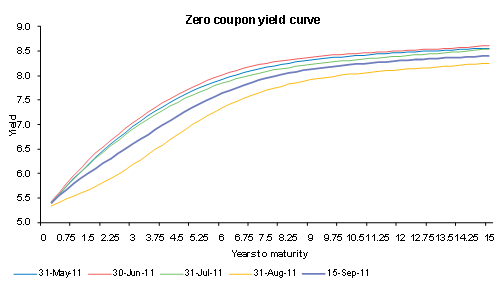
The long term yield curve has also flattened significantly in response to the outlook for lower short term rates. The slope of the long term yield is still positive, indicating that short rates are expected to rise rather than fall in due course. However the one year benchmark interest rate is now only expected to move above 7% in three years’ time. As may be seen in the charts below, the one year rate is now expected to flatten out below the 9% rate in about six years.

Zero Coupon Yield Curve
Implied One Year Yield

The question then arises as to what might cause the yield curve to flatten or steepen in the year to come. Were the global economy to grow faster than is now expected, this surely would be associated with strength in emerging market equities and therefore also in the rand. The outlook for SA growth would improve in these circumstances while the outlook for inflation (given rand strength) would not deteriorate. The yield curve might then shift lower at the longer end and there would be downward market pressure on short rates (which the Reserve Bank might choose to resist).

Were the outlook for the global economy to deteriorate further, there would be additional downward pressure on short rates. The yield curve might well turn negative, should short term rates be expected to decline given slower growth. However the rand is unlikely to be well supported in such circumstances and so the outlook for inflation may not improve if we were to see a combination of a weaker rand and lower global commodity prices, including a lower oil price. These opposing forces (slower global growth plus a weaker rand) will restrain any fall in inflation or inflation expected over the long run and so limit the fall in long term rates. A flat to negatively sloped yield curve might then prevail until the outlook for the global and SA economy improved.

Clearly the combination of faster global growth without more inflation (shielded by a stronger rand) is much to be preferred. However there is one great consolation, should the global economy not help the SA economy along: the danger of an increase in short term rates has passed. The money market is confirming this and the Reserve Bank will indicate as much in due course.

Resources: In times of turbulence, maybe focus on earnings

In the midst of market turbulence it may prove helpful to focus on earnings rather than prices. Index weighted earnings per share reported by the Resource companies listed on the JSE over the past 12 months have risen very sharply.

JSE Resource Index Earnings per share

These earnings per share in rands have grown by about 80% over the past 12 months (given rand stability the growth rates in rands have been very similar to growth recorded in US dollars). Resource companies have significantly outperformed other sectors of the JSE on the earnings front. Yet when valuations are considered, JSE Resources have proved distinct underperformers since the beginning of the year. JSE resources, when compared to the Financial and Industrial Index, are about 20% weaker than in early 2011.

The JSE earnings cycles- Smoothed growth in Index earnings per share (rands)
Ratio of the Resources Index to the Financial and Industrial Index, August 2010 = 1

Clearly the share market must be expecting a very sharp decline in resources earnings from current levels to have derated the sector as much as it has. As we show below, the peaks in the resource earnings cycle have often been associated with declines in the price to earnings ratios established for the sector. This relationship – a peak in the price to earnings multiple and a trough in the earnings cycle – appears particularly obvious over the past 12 months. The earnings cycle is approaching a very high peak while the price to earnings multiple has headed sharply in the other direction.

The valuations therefore seem to be predicting the impact of a global recession on underlying metal and mineral prices and therefore in turn on resource earnings.

The JSE Resources price:earnings multiple and the earnings cycle

Commodity prices have however have held up over the past and in recent turbulent weeks rather better than equity valuations, as we show below. Recession fears – especially for the global economy – may be overdone. If so commodity prices may remain resilient and current resource valuations will then prove very undemanding.

Commodity prices in 2011 ( January 2011 = 100), daily data
Commodity prices July to 12 August 2011 (30 June = 100), daily data

Market volatility: Not a pretty picture at all

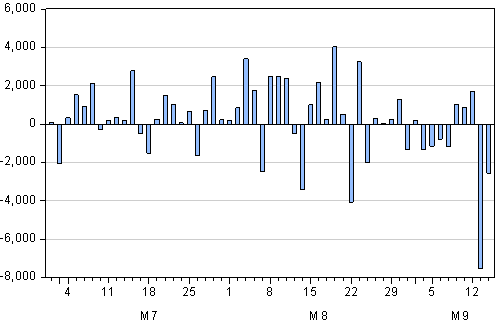
The equity markets late yesterday in Europe and also late in the New York day made a spectacle of themselves and it was not a pretty sight at all, especially when the futures on the DJ Industrials and S&P 500 moved sharply higher after the close. The biggest losers (on a day that saw the major markets down by more than 4%, having been up by the same percentage more or less the day before) were the European and US banks.

SocGen, a major French bank, was down over 26% by the close of the trading day on rumours, soon denied, that French sovereign debt was about to be downgraded by the rating agencies. BNP Paribas lost 11% on the day and Credit Agricole almost 15% off. On the other side of the Atlantic, Bank of America was down another 10.9% while Citi and Goldman Sachs both lost 10.5% on the day. JPMorgan escaped relatively lightly with a 5.6% loss and Wells Fargo was down 7.7% on the day.

Dow Jones Industrial Index, 10 August 2011
The Volatility Indicator (VIX) – a 12 month view

We have pointed out before that no national bank can hope to survive the default of its sovereign, or even in some senses, the serious expectation of its default if it were forced to revalue its assets at their reduced market value. This is because the presumed safest part of the banks’ balance sheets are committed and required by banking rules to be invested in significant proportions in sovereign debt.

The way governments and their banks usually avoid notional default on their debts is by printing money. This may mean more inflation, but also avoids banking failure since the banks’ assets and their liabilities also inflate more or less to the same degree.

The European Central Bank (ECB) is the only central bank in the euro system with the power to print euros. It continues to demonstrate a degree of reluctance to do so, out of fear (or perhaps German fears) of providing an easy way for European governments to get out of their fiscal crises and so avoid the necessity of cutting spending. The reality is that the ECB will have no alternative but to buy the bonds of threatened European governments if a banking crisis is to be avoided; or to indicate that it would be prepared to do so aggressively if called upon. Such unambiguous intentions might in themselves be more than enough to put the bond and bank short sellers to flight. The primary purpose of any central bank is to avoid a financial crisis and to use its considerable (and essential) power to print money without limits in order to prevent crisis. Further, when circumstances permit, they have the power to take the cash back again, usually with the profits that come with crisis resolution. The actions taken by the US Fed to pump money into the US financial system not only saved the system but did so at a profit to taxpayers. The ECB no doubt is well aware of this responsibility. Exercising it with vigour is well overdue. After all, financial instability is a threat not only to the financial system but to the real economy.

Equity and commodity markets this quarter (30 June = 100)

It is of interest to note that the emerging equity and the commodity markets (and so the rand) after having been engulfed by global fears on Monday, actually ended yesterday higher rather than lower. The volatility yesterday was clearly a crisis of confidence in European banks and in the willingness of the ECB to deal with it rather than new fears about the global economy. Commodity markets in general, as represented by the Reuters CRB Index can be regarded as having survived rather well the recent revival of risk aversion

Global markets: The risks are to the developed economies – not emerging ones

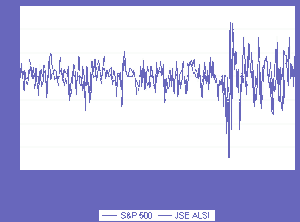
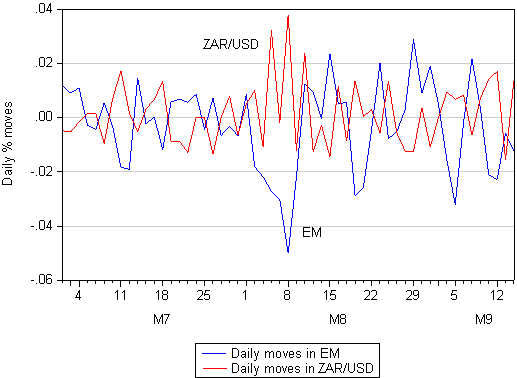
The world as reflected in equity markets has become a riskier environment. Day to day and even intraday, share price movements have become more pronounced (volatility or risks rising) with an inevitable and distinct downward bias. The outlook for the global economy has become more uncertain and this uncertainty has been demonstrated in the form of lower and more volatile valuations. In the figure below we show how much daily percentage moves in the S&P volatility indicator, the VIX, and daily per cent moves in the S&P 500 have increased over the past week.

Daily percentage moves in S&P volatility (VIX) and the S&P 500

In a clearly riskier environment such as this, a degree of rand weakness might have been expected. In fact the rand has held up very well against not only the US dollar and the euro, but also the Aussie dollar and the Brazilian real.

The rand vs the euro, Aussie dollar, US dollar and Brazilian real, Q3 2011 (Daily data)

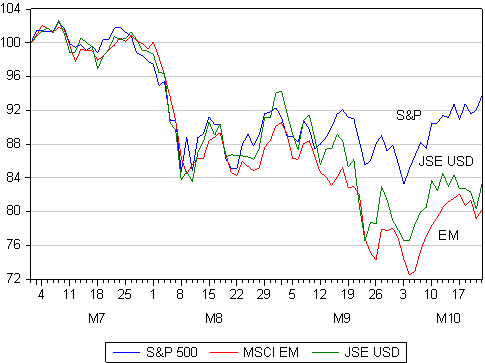
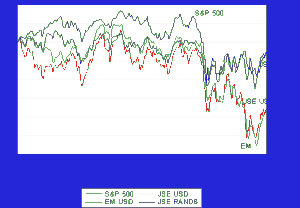
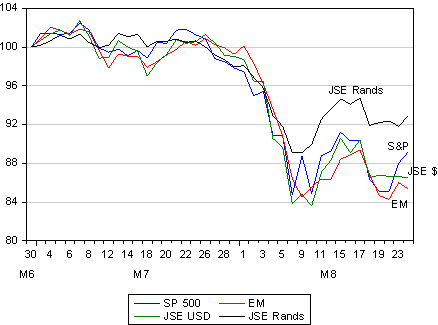
The explanation for these unusual currency events – the rand strengthening in a riskier environment – deserves an explanation. The explanation is to be found in the behaviour of emerging equity markets from which the JSE and the rand take their cue. Emerging equity markets have held up better than the US market. It may be seen that this quarter and particularly this week, the emerging market (EM) Index has declined less than has the S&P 500. The average EM market by the close on 2 August was off by a mere one and a half per cent compared with 30 June. The S&P 500 had lost nearly 5% over this period and the JSE about 3% in US dollars.

The S&P 500, the MSCI EM and the JSE (USD), Q3 2011 (30 June =100)

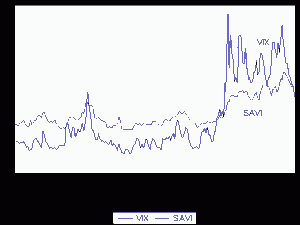
Moreover the emerging markets have not been as volatile as the New York equity markets. The volatility priced into options traded on the JSE represented by the SAVI is now less than that of volatility priced into the S&P 500, as represented by the VIX that.

Volatility Indicators for the S&P 500 (VIX) and the JSE (SAVI)

And so when we run our model (utilising daily data since January 2009) to explain the rand/US dollar exchange rate with the EM Equity Index, the model predicts a rand/US dollar rate of R6.90 compared with an actual R6.80 on 2 August.

The rand and its value predicted by the EM Index

The enhanced risks therefore may be recognised as more uncertainty about the outlook for the US economy than anxiety about the prospects for emerging market economies (as well as the companies that serve them, including those listed on the JSE). This makes every sense. It is the developed world that needs to get its fiscal house in order, not the emerging economies that are mostly in comparatively good economic and fiscal shape.

Perhaps the agitated state of the developed equity markets indicates that there is now even less confidence in the ability of the Obama administration to sustain faster US growth, given the shenanigans that accompanied the lifting of the US debt ceiling. It was not the President’s nor his party’s finest hour.

It is surely up to President Obama to prove that the market is misjudging him. But he has little time to prove the market wrong before facing the US electorate in November 2012. To build the confidence that would revive spending plans of firms and households and employment, he would need to convince Americans that he can implement a realistic long term plan to deal with the US deficit without raising tax rates. Faster economic growth is essential to this purpose. Such a plan would have to include critical features like reining in the threatened runaway government spending on medical benefits under Obama care. This will not come easily.

Vehicle sales, house prices and credit: Operating below potential

New vehicle sales in South Africa in July rose from 44 880 in June to 45 703 units sold. On a seasonally adjusted basis this represents a marginal increase of about 70 units. As we also show below, the new vehicle cycle has clearly peaked and if present trends continue the level of new vehicle sales will remain more or less at current levels and growth will turn marginally negative (off its higher 2011 base) by early 2012.

New vehicle sales in South Africa

Growth in new vehicle sales

In 2010 SA Households increased their spending on durable consumer goods by 24% off a very depressed base. This growth in the first quarter of 2011 was maintained at a very robust 21.5% annual rate helped by particularly buoyant sales of new vehicles in March 2011. The impetus provided to the SA economy by increased sales of new vehicles and perhaps also sales of other durable consumer goods, is losing momentum.

Such lack of momentum is also revealed by very tepid growth in the supply of bank credit and money to June 2011, a trend confirmed by the results reported by the retail banks this week. The revenue line of the SA banks is growing very slowly because house prices and so demands for additional mortgage loans have increased at a very modest rate and growth in the supply of money and credit may be slowing down rather than picking up.

Average house prices and house price inflation
SA banks growth in assets and liabilities

These trends in vehicle sales, house prices and credit and money supply suggest that the SA economy will operate below its potential for some time to come. The potential stimulus to growth from the global economy and exports now also seems less likely to provide additional strength to incomes and employment. The MPC after its July meeting told us that it had not even considered lowering interest rates only raising them- a temptation that was strongly resisted as we were also told. Given these updates on the SA economy it should have considered lowering interest rates

US debt ceiling: Triumph of the Tea Party

The good news for the equity markets over the agreement to lift the US debt ceiling was overtaken by further doubts about the US and global economy due to the weak ISM manufacturing report that came in below expectations. The index indicated that manufacturing output in the US had barely expanded in July and the subsectors of the index reporting on orders and employment intentions offered little comfort about the outlook for the economy.

The agreement found overwhelming support in the House of Representatives from Republicans, while Democrats were evenly split 91-91. The Senate will undoubtedly follow suit today. The Republicans had successfully held the line against tax increases and the Wall Street Journal described the outcome as representing a new dawn for fiscal outcomes in the US (spending cuts without tax increases) and a triumph for the Tea Party activists.

It is clear that faster economic growth in the US and other debt assailed economies is what is needed. The debate in the US will be how to realise this faster growth. Higher tax rates (on the rich and highly paid) may be regarded by some as only fair but they are surely not good for growth. Extra government spending financed by higher taxes surely crowds out private spending over the longer run. And even when an economy is operating well below its potential the threat of more government spending (and the taxes to follow) may immediately frighten away business and household spending. That the limits to the ability of the Federal Government and of municipal and state governments in the US to raise tax rates have been reached might well be regarded as very good for growth.

Also good for growth everywhere would be reforms of the entitlement programmes that encouraged workers to retire later. Essential too would be to mean test medical benefits for the over 67s (or should it be over 70s?), and in so doing recognise much improved life expectancies. A genuine market place for medical services and for private insurance to cover medical expenses would help greatly to discipline spending on doctors and prescription drugs.

Finding the path to faster growth in the US need not be complex. What it does require is the appropriate political will. The will to resist higher tax rates, has been demonstrated in the US. However the will to pare back entitlements and to rationalise access to them has still to be demonstrated. This debate in the US will intensify as the elections of 2012 approach. President Obama knows his re-election prospects will be much diminished if the unemployment rate does not recede sharply from the current 9%. Unless he can encourage households and especially firms to spend more, he will not succeed in this. He might therefore well become a great deal more business friendly: this would also be good for US growth

Money and economic activity

In the eighties and early nineties a number of attempts were made to measure the relationship between various measures of money supply growth and the growth in GDP, GDE, Household Consumption Expenditure and Consumer Prices between 1966 and 1993. (82, 1984,1989, 1990b, 1993) This earlier work on the relationship between money economic activity and prices was concluded in 1990 with an attempt to separate monetary causes and effects. That is to estimate whether the money to expenditure and income link was stronger than the income to money link, given the accommodative nature of money supply responses. It was reported that the money to income link was stronger than the reverse income to money influence, using a vector auto-regression approach. (1990a). The purpose of this paper is to update this analysis to include the past twenty years of data to establish whether or not money still matters for the SA economy in the way it did.

The full paper is available here: Money supply and economic activity (2012)

The rand: No surprises

The recent strength of the rand should not have come as a surprise. The rand has continued to follow very closely the day to day the direction provided by emerging equity and bond markets.

A simple regression equation linking emerging equity markets (represented by the benchmark MSCI EM Index) to the rand explains over 95% of the daily value of the rand as we show below. This model predicted a value of R6.80 on Wednesday 27 July, slightly weaker than the R6.70 at which the rand traded that day.

This relationship seems obvious and persistent enough and very likely to continue: where emerging market (EM) equity markets go and where global growth and risk appetite take them, the rand will follow.

The explanation for the strength of the relationship is perhaps less than obvious. That the JSE All Share Index, especially when converted to US dollar, also follows the EM Index very closely, is part of the explanation. This connection that makes the JSE so highly representative of the average EM is by no means accidental. As we have pointed out, JSE earnings in US dollars follows average EM Index earnings as closely as does the Index. This is because the major companies listed on the JSE have a global and emerging market economy reach, rather than being dependent on the SA economy. And so capital tends to flow into and out of the JSE and the SA bond market, depending on the simultaneous direction being taken by the EM equity and bond markets generally.

It should moreover be recognised that the market in rands is a large, active and liquid global market. Each day up to US$20bn worth of rands is now being traded according the SA Reserve Bank. Much of this trade is conducted between third parties not directly engaged in SA trade or finance; they are presumably trading the rand because they can easily do so and are doing so because presumably the buying and selling of rands enables traders and investors to hedge exposure to Emerging Markets and their currencies that cannot be traded as easily.

This makes the rand much more of an emerging equity market currency and much less influenced by the direction of SA foreign trade and the implications that inflation differences, or purchasing power parity (PPP), can have for this trade. Exports are encouraged when the rand is undervalued – that is exchanged for the US dollar at a lower rate than its PPP equivalent; while imports are encouraged when the US dollar is cheaper and can be bought for less than its PPP equivalent value.

It all depends on where you start

The history of the rand relative to its PPP value, that is, its value explained by the difference between higher SA inflation and lower US inflation alone is shown below. In the decade of the 1990s the rand stayed close to PPP until 1995. Thereafter it depreciated at a much faster rate than PPP until the rand blew out in 2001. By then the rand was substantially undervalued relative to PPP. However by 2011, the rand was back to its 1990 PPP equivalent.

Thus if we begin the calculation of PPP in 2000 and carry it forward until now, the picture becomes very different. By 2011 the rand, compared with its PPP value, is substantially overvalued compared to its undervalued position in 2000 and 2001. The PPP value for the rand today (with January 2000 taken as the starting point) would be about R9 to the US dollar. But the strength of the rand over the last decade was due to the recoveries from two major shocks: the 2001 shock was almost completely domestic in origin – it was linked to the initiation of the asset swap facility. The shock in 2008 and the recovery thereafter represent the impact almost entirely of global forces (that is the impact of the global financial crisis on all emerging market currencies) including the rand and the subsequent recovery from this crisis.

As indicated, the rand cannot be well explained by PPP. Capital flows explain these differences from PPP and will continue to do so whatever the SA Reserve Bank might hope or try to do about this by interventions in the currency market. The market is just too big for the Bank to hope to muscle in one or other preferred direction.

These flows and their influence on the rand were severely restricted by exchange controls before 1995. Capital flows were captured within the financial rand pool and the financial rand exchange rate insulated the (commercial) rand. These controls were lifted for foreign investors in 1995 and gradually for SA investors ever since. The relief of the exchange control log jam after 1995 and panic demand for asset swaps by individuals in 2001 explains most of the persistent weakness of the rand between 1995 and 2001 (just as the global financial crisis explained the weakness and recovery in 2008-2010). By 2002 global forces had taken over the exchange value of the ZAR.

It should be appreciated that with the almost complete lifting of exchange controls and the trading appetite for rands abroad, the rand is no longer a one way bet. It is much more a bet on emerging markets. Those who like to believe that rand weakness (given higher SA inflation) is a fact of economic life should think again. And they should also appreciate that a stable rand helps to reduce inflation pressures in SA.

To view the graphs and tables referred to in the article, see Daily Ideas in the Daily View
: Daily View 29 July

US earnings: The benefits of going global

A Wall Street Journal Report today by Kate Linebaugh and James Hagerty, Business Abroad Drives U.S. Profits, points to way foreign operations of leading US corporations have contributed to the very satisfactory second quarter earnings season now well under way in New York. One third through the earnings reporting season for the S&P 500 companies, earnings are the highest they have been in four years.

These S&P 500 earnings per share may well exceed $100 for the 2011 calendar year. The drivers for this earnings growth however, as the report points out, is not the struggling US economy, but the off shore operations of these companies.

About three quarters of the companies that have reported so far have done better than analysts expected. As the WSJ report states, “…Many of them – ranging from manufacturers Honeywell International Inc. and Caterpillar Inc. to drug maker Abbott Laboratories – raised their earnings forecasts for later in the year.

The report refers to the bellwether industrial giant GE that reported a 21% increase in earnings to $3.8bn for the second quarter. Yet US revenues in GE’s core industrial businesses shrank about 3.4% while international industrial revenue soared 23% to $13.4bn, accounting for about 59% of the company’s total industrial revenue. This translates into growth in capital expenditure and employment offshore rather than on US shores making the US economic recovery less likely to benefit from the financial strength of US corporations, many of whom have a strong global footprint.

We have been firmly of the view that the most compelling way to gain exposure to the global economy is via the companies listed on the S&P 500. The valuations of these companies appeared very undemanding of earnings growth, trading as they do well below their average price to trailing earnings multiples (which averaged as much as 21 times between 1980 and 2011). The current trailing S&P 500 earnings per share, calculated before higher second quarter earnings have been reported, is US$81.31. This puts the S&P on a trailing 16.5x earnings and a prospective forward PE of under 14 times earnings to be reported in the first quarter of 2012.

This advice has proven apposite as we show below. Since 1 January 2011, the S&P 500 has gained almost 7% (to 23 July) while the MSCI EM is flat and the JSE in US dollars is 2.5% weaker than on 1 January 2011.

However as we also show, S&P earnings year to date have significantly outpaced the share market index, adding to the case for investing in the S&P 500. We remain firmly of the view that the S&P 500 is still very undemanding of future earnings growth and even less demanding than it was. And the unsatisfactory state of the US economy can be expected to continue to keep down interest rates in the US (and so the competition for equities from fixed interest income)

To view the graphs and tables referred to in the article, see Daily Ideas in the Daily View
: Daily View 25 July