The SA economy needs lower not higher short term interest rates. Will it get them?

The SA economy, according to our Hard Number Indicator (HNI) continued to move ahead in August 2013. Growth in economic activity remained positive in August. However the forward motion of the economy appears to be losing rather than gaining speed. Our very up to date business cycle indicator is based on two equally weighted hard numbers that are released very soon after the end of the previous month, unit vehicle sales and the note issue.

This Indicator, the HNI, has proved to be very relaible in recognising the turning points in the offcial business cycle, the coinciding business cycle indicator published by the S.A Reserve Bank, that is based on a larger number of economic indicators derived mostly based on sample surveys, not hard numbers, and therefore is only published at best two or three months later than the HNI.

As we show the HNI appears to have reached a plateau suggesting that the forward momentum of the economy that has picked up speed strongly since the recession of 2008-09 has now stabilised. The forecast also suggests that the economy may not grow any faster over the next twelve months. (See below)

The Hard Number Indicator of the Current State of the SA economy.

The components of the HNI are shown below. As may be seen the supply of and demand for cash continued to grow at a rapid rate in August 2013 in both nominal and inflation adjusted terms. The trend in the extra cash supplied by the Reserve Bank to the economy remains above a 10% p.a. rate though the trend appears to be declining. Adjusted for rising inflation the real growth rates remain above 4% p.a as may be seen. This growth must be attributed in good measure to underestimated informal economic activity that is cash intensive.

The cash cycle- rowth in the supply of Reserve Bank Notes

New unit vehicle sales, that have been such a source of strength for the economy over the past two years, appears to be losing momentum, as we show below. On a seasonally adjusted basis August unit vehicle sales on the domestic market were well down on July sales and suggest that new vehicle sales are unlikely to increase over the next twelve months. Yet if sales volumes can be maintained at current seasonally adjusted levels, such outcomes, in the light of the history of the sector would be regarded as satisfactory. Significant increases in exports of new vehicles, labour relations permitting, could add to motor manufacturing activity.

Growth in new unit vehicle sales to the SA market.

SA Unit Vehicle Sales. Annualised and Forecast.

The National Income Accounts released on August 27th estimated that GDP grew at an improved seasonally adjusted 3% rate in Q2 2013. However GDP in Q2 2013 was only 2% higher than year before. These growth rates must be regarded as highly unsatisfactory given the potential for faster growth. Such GDP outcomes would ordinarily call for lower interest rates. Unfortunately the times cannot be regarded as ordinary with the foreign exchange value of the rand, in company with other foreign capital dependent economies, under so much pressure form higher long term interest rates in the US.

The inflationary implications of a weaker rand therefore make lower short term interest rates less likely. Lower rates would be very helpful for not only vehicle sales but housing prices and employment creating residential construction activity. Were mortgage rates closer to five per cent than ten per cent a lively housing market and many more new houses would surrely follow.

Higher short term interest rates, incluinding the rates charged for mortgage or car loans would further slow down the SA economy and hopefully will be avoided. The weaker rand and the higher prices to be charged domestuic consumers will anayway be taking their toll of domestic spending. Already subdued domestic spending will be under enough additional downward from higher prices, particularly from higher petrol and diesel prices. Spending does not need further discouragement from still higher interest rates.

Higher rand prices for exported goods should however encourage the mining and agricultural sectors to produce more. Manufacturing activity should also benefit from incentives to export more and also as domestic producers compete with now more expensive imported goods for space on the shelves of retailers. But extra output and incomes can only be realised if the mines and factories stay open for business.

The rand is not only a play on US interest rates. It is a play on SA labour relations that deteriorated so badly a year and more ago at the Marikana platinum mine that saw the ZAR perform so poorly not only against the USD but also against other Emerging Market currencies.

An unexpected recent degree of realism about wage demands appears now to be influencing the SA labour market. The outlook for mining and manufacturing output has improved accordingly and the rand has benefitted to a degree from this. In recent weeks and days the ZAR has been a relatively strong EM currency and the Indian Rupee particularly weak, as we show below.

The foreign currency cost of a rand

This small degree of rand strength has been accompanied by some relief for long term interest rates in South Africa. These rates as they did throughout the EM world followed higher yields in the US higher after warnings of the tapering of Quantitative Easing entered the global financial markets in late May 2013. In recent days the gap between RSA and USA yields has also narrowed indicating a lower cost of forward cover and somewhat less rand depreciation expected over the next ten years. (See below)

Long term interest rates; RSA and USA

The interest rate yield premium. (RSA-USA ten year bond yields)

More of the same – that is SA specific reasons for a stronger rand linked to more production on the mines and in the factories –especially if accompanied by lower rather than higher US bond yields – would be especially welcome news for the SA economy. It would improve the outlook for inflation and perhaps allow for lower rather than higher short term interest.

But in the absence of such favourable forces the right monetary policy response to higher US rates and a stronger dollar would be to continue to leave the adjustment process to a fully market determined ZAR and to keep short term interest rates where they are .

The Hard Number Index: Looking to export prices and volumes to revive the SA economy – held up by domestic spending

By Brian Kantor

There are at least two strong features of the SA economy, notably domestic unit vehicle sales and the supply of notes. Domestic vehicle sales in the 12 months to July are being sustained at 66 2000 units, close to the record sales of over 700 000 units in 2006-7 terms. The growth rate in vehicle sales has declined but remains positive at about 5%, helped by low financing costs and low rates of inflation of the prices of new vehicles.

The Reserve Bank note issue has grown by more than 12% over the past 12 months. Growth has held up strongly over the past three months to July, though the trend would appear to be in decline to about a 9% rate over 12 months.


The demand for new vehicle sales of all sizes comes largely from the formal sector of the economy – those with access to bank credit – while the growth in the note issue reflects less formal economic activity of those who prefer cash to credit or debit cards. Both sources of demand have been very welcome to an economy under pressure.

We combine both of these very up to date series to form our Hard Number Index (HNI) of the current state of the SA economy with the note issue, deflated by consumer prices. The results are shown below. The Hard Number Index has moved higher but appears to be peaking. Growth in economic activity, while still positive, is slowing down.

This latest indicator of the state of the SA economy, of sub-par growth subsiding, will not come as much of a surprise to economy watchers. Growth in domestic spending has probably held up better than many would have predicted and meant the economy could maintain some forward momentum, despite the weakness of exports and export prices. But the economy could do with all the further help it can get from stronger demands from world markets to boost local production and incomes.

Sustained output of minerals and metals, less disrupted by strikes and walkouts, would be a big plus for growth. Higher prices for commodities coupled with better export volumes and revenues would also help the rand. A stronger rand would mean less inflation to come and lead to lower interest rates that could help sustain domestic spending. The problems in mining have not only damaged output and employment in mining and manufacturing; they have kept up interest rates. The domestic economy has deserved the lower interest rates that an improved foreign trade account and better than expected labour relations could help deliver.

Economic policy: The solution for poor project management in SA is private ownership

When a private company grossly mismanages a project designed to add revenues and profits or mismanages the project such that its capital costs grossly exceed budget, the management takes the blame. They may lose their jobs as well as their reputations, and the shareholders who appointed them have to bear the burden of a lower return on the extra plant and equipment created. In extreme cases the overruns and the waste of capital incurred may bring the company down, causing shareholders to lose all and debt holders to salvage what they can out of the loss making wreck.

In the case of a government-owned and regulated monopoly the outcomes for the management and the company may not be so severe. Unlike the private company, the regulator may be persuaded to allow the company to charge more to maintain a regulated return on the extra capital employed. Unlike the private company facing competition and market determined prices, largely beyond its control, the public monopoly may be able to cover its cost overruns with higher prices. With little alternative, the consumer will have to pay up and hope to economise on the more expensive essential service. The consumers, not the company, then have to bear the consequences of what might well be very poor project management. And the international competitiveness of all those who use the now more expensive service suffers accordingly. Factories and mines will then become less profitable, especially in export markets, because they will not be able to pass on higher costs, so discouraging further investment in their enterprises. And households will see their real disposable incomes taxed further, discouraging consumption of other goods and services.

Making customers rather than owners carry the proverbial can for poor project management is not only unfair – it covers up for poor management so encouraging managers to become less responsible and efficient.

Price and return on capital-regulated state owned enterprises play a critical role in supplying the SA economy with essential infrastructure, such as new power stations (Medupi) and new pipelines (Transnet’s new pipeline from Durban to Gauteng). The problem is that the managers of these state owned enterprises are not making a very good fist of project management. These important projects are well behind time and well over original budget.

Fortunately for the consumers of electricity or pipelines, the regulator is adopting a more critical approach to the costs, both capital and operating, claimed by Eskom and Transnet to justify higher prices. A report (Businessday/BDlive, Razina Munshi, 2 August 2013) commented:

“The National Energy Regulator of South Africa (Nersa) is investigating the near doubling of the costs of Transnet’s new multiproduct fuel pipeline from Durban to Gauteng, in a move that could herald closer scrutiny of big cost overruns on state infrastructure projects. The outcome of the probe could also have implications for petroleum pipeline tariff hike requests in the future……. Transnet originally budgeted R12.7bn for the project, but this soon rose to R15.4bn, and it quickly became clear that even that was conservative. The final price tag of R23.4bn includes the cost of pump stations in Durban and Heidelberg, still under construction….”

Commenting on Eskom’s claim for higher prices, Business Report (12 July 2013 ) said: “The failure to push through big-enough price increases has created a 225 billion-rand cash-flow shortfall as the company struggles to meet the continent’s biggest economy’s electricity demands.”

This cash flow shortfall – the difference for Eskom revenues between a 16% per annum price increase over five years and the 8% per annum increase granted by Nersa – helps reinforce the important point. If the consumers cannot be forced to pay up for management failure, then the owners have to.

The owner of Eskom and Transnet is of course the Republic of South Africa, ie the citizens whom the government represents. To overcome the huge cost overruns they, the people, have to come up with the extra cash, that is the extra capital required to keep Eskom and Transnet going. They have to borrow the money and pay the extra interest on the additional debt, and/or impose additional taxes on themselves to cover up for poor project management. Even if some of the people believe that others, not themselves, will be stumping up it is clear that the funds so raised and the taxes paid could be put to better alternative uses, for example building homes, schools or hospitals.

It is not at all clear why the people of SA would wish to take on these risks of poor project management that they need not have to do. The assets and activities of Eskom and Transnet could be privatised, as they are in many economies, with the current plant and equipment sold off at market determined prices. The pipeline would fetch a pretty penny at current regulated prices. In this way not only would the debt levels and interest expense of the Republic be reduced significantly, the exposure of the SA citizen to huge cost overruns would be eliminated. Shareholders in privately owned utilities with highly predictable revenue streams would willingly bear those risks, especially if the regulator offers them a fair risk-adjusted return on capital. And the Republic would also collect its normal share (28%) of the profits earned by a privately owned utility and the dividends paid out.

Little sympathy should be accorded to Eskom having to raise the extra debt to cover their cost overruns. A recent positive response by a private company, Exxaro/GDF Suez Energy to a Department of Energy call for participation in electricity generation (13 June 2013);if accepted, will allow this private company to build a new coal fired power station producing a respectable 680MW of electricity, to be delivered to the grid at presumably current wholesale prices set by the regulator for Eskom – plus inflation.

This indicates that the price of electricity in SA is now more than high enough to encourage private owners to risk their capital to supply additional electricity. No doubt the company has built in high enough returns on the capital it intends to employ to make the project viable. Should it succeed SARS will be looking to its normal share of profits. And should it fail to produce a profit, or even go out of business, the shareholders will have to stand up and bear the loss. Some other group of owners would then take over the plant at what will be a distressed price and hope to manage it better.

SA citizens would surely find this a better prospect than having to bear the risks of owning assets over which they have very little control and their managers do not appear to do a very good job of managing.

Turning Income into Wealth – something not necessarily under the control of the saver

Earning an above average income does not make you well off or wealthy. The best one can do is to save and hope for the miracle of compound returns to give you the retirement you aspire to.

It is savings not income that makes you wealthy

Earning an above average income does not make you well off or wealthy. You might spend it all on the good things in life and have nothing left over when the income from work dries up – as it must at some point in time when age, infirmity or injury undermines your income earning capacity. It is not only the body but the creative mind that may give in prematurely. The profligate actor, artist, musician, writer or sports star may have a brief life in the fast lane and have nothing left to show for it other than some great stories, unless they put away some of their extraordinary earnings. Mick Jagger and his ever rolling stones would be a notable exception.


Save and hope for the miracle of compound returns to give you the retirement you aspire to

Wealth is gained by saving – consuming less than your income and by investing the savings in (hopefully) income earning assets and, most important , reinvesting rather than consuming this extra income your wealth is bringing (at least until you need it to sustain your life style in the hoped for accustomed manner). By accustomed we would mean being able to consume as much or almost as much  as you did when you could rely on a more or less regular income from your work. A rule of thumb is that your wealth or capital should be sufficient to allow you to continue to spend at the rate equivalent to 75% of the real goods and services consumed before retirement. (The pattern of spending may well alter with age but the real volume of spending will ideally be well sustained). Sustaining this pre-retirement standard of living might require gradually drawing down capital to support these consumption demands.


Yet 75% of a low number may well remain a low number. Many would aspire to at least 75% of a large number rather than a small number. This means earning well, saving a good proportion of these earnings and perhaps, even more important, achieving very good returns on the savings made. High incomes, a consistently high savings rate and excellent returns on savings is the path to true wealth – it is a much steeper path than one that could lead to a comfortable retirement for the middle income earner.


How to get more than comfortable: that is, how to get rich

True riches, achieved by the relatively few, are when the wealth or capital that has been accumulated over a life time can provide for a very comfortable life style without the wealth owner having to consume any of that wealth. That is to say, a stock of capital that generates enough income to provide for both generous consumption demands and enable further savings to not only preserve, but indeed to add to the real value of the capital owned.


There are perhaps two obvious routes to conspicuous wealth (if not conspicuous consumption) for the self-made man or woman. The first is to establish and manage-own a very successful business. Success in this way will very likely mean not only the successful execution of a business model. It may require mortgaging the home to raise the initial funds to start the venture and then to sustain growth by reinvesting a high proportion of the cash flow generated by the enterprise. This process of saving income and reinvesting it in the successful business can realise a very high rate of return, making the owner manager very wealthy.


These returns on the capital invested will be measured by the increase in the market value (assets less debts) of the business plus the extra income earned that again may be mostly reinvested in the business. Such a high savings and investment plan by a owner-manager is inevitably highly risky – all the family eggs are in one basket and risk adjusted returns have to be high to justify the risks taken. When the value of the enterprise is well proven, the owner manager may wish to cash in by selling up or by selling a share in the company and by paying dividends that are then used to fund a more diversified portfolio of other assets.

Another path to riches may be climbing the slippery ladder of a well established stock exchange listed corporation. This would be one that enjoys growing appreciation from fund managers and is awarded a rising market value. Significant wealth for the top management will come with the increased value of their share options or the shares regularly awarded as part of remuneration and held by them. On retirement or resignation, these shares can be held or again exchanged for a more diversified, less risky portfolio of assets.


Options for the risk-averse family man or woman or professional.

The usually risk averse average salary man or woman and the highly successful partner or principal in a professional practice will typically take a different path to comfortable retirement or, possibly, great wealth if the income is high enough. They will have to save a proportion of their incomes and contribute to a pension or retirement fund. The tax advantages of such contractual savings schemes are considerable while there may also be opportunities for the higher income earners, the highly successful professional, to save and invest independently in the stock, bond or property markets.


It is investment returns more than the contribution rate that matters for the saver.

The more the salary man and professional save and the sooner they contribute to a savings plan, the more wealth they will accumulate. But as (or more) important will be the returns they earn on their investments. We will demonstrate and illustrate the differences it makes to the wealth outcomes between a low or higher real rate of return on a portfolio, especially when these returns are compounded over an extended period of time.


Doing the numbers – demonstrating the miracle of compound returns

In an earlier exercise of this kind published in our Daily View we considered a salaried individual aged 55 in SA in December 2001 expecting to retire 11 years later. By 2001 this individual was assumed to have accumulated assets of R5m and was earning a gross salary of R500 000 per annum and also assumed to contribute 15% of this gross salary  to a no fee no tax pension fund. We also assumed that the salary would grow at 8% per annum. The Pension was invested fairly conservatively in a constant mix: 60% in the JSE All Share Index, 30% in the All Bond Index and 10% in the money market. We calculated the performance of this fund using realised returns over the period to April 2013 some 137 months later.

The results of this savings plan would have been very good indeed. The salary would have grown at an 8% p.a. compound rate from R500 000 to R1 165 813 while the value of the portfolio, worth R5m at the beginning of the period, would have been worth R23.952m in April 2013. The ratio of wealth to salary that was 10 times in 2002 would have increased to 20 times the final salary earned in 2013. This individual would have been able to support a life style much better than the equivalent of 75% of final salary. Consuming at a mere 5% rate of this capital – a rate likely to preserve real capital – would yield R1.19m in year one – slightly more than the final salary. At current interest rates in SA R1m of capital, to be consumed, can buy you about R80 000 of more or less certain nominal annuity income per annum or about R35 000 of inflation linked income at 65, for as long as you or your spouse survive.


Excellent past performance is not guranteed

The reason for these highly favourable outcomes for the saver retiring about now, was the excellent real returns realised by the equity, bond and money markets over the period. The JSE delivered an average 15.58% p.a. return over the period, the All Bond Index 10.55% p.a. and the money market 8.22% p.a. on average. Combining these asset classes in the proportion 60, 30, 10 would have given an average annual return of 13.3% p.a. over the period, well ahead of inflation that averaged 5.9% p.a. This average real return of 7.4% p.a. was well ahead of the growth in salary of 8% p.a. equivalent to a real inflation adjusted 2.1% p.a. Hence the increase in the ratio of wealth to salary from 10 to 20 times. Incidentally, had this salary earner in 2002 decided not to save any more of his or her salary after 2001,  the outcomes would still have been highly satisfactory. The portfolio would have grown to R21.291m through the effect of compounding high returns and reinvesting income.

It would be unrealistic to expect real returns of this kind over the next 10 years.


A simulation exercise to guide future savings plans

We will show in a simulation exercise what might apply to future contributors to SA savings plans. We will demonstrate that the rate of compounding real after inflation returns – higher or lower – especially when sustained over a long period – will overwhelm the impact of higher or lower savings rates. The Excel spread sheet attached to this report can be used to demonstrate this point. It allows for a great variety of savings options and real return and inflation assumptions that readers, with Excel at their command can try out for themselves.


The model and the scenarios

The model assumes a starting monthly salary of R10000 and a working life of 40 years. This working life is broken into three stages: a 10 year phase followed by a further 20 year phase with a final phase of 10 years to allow for different assumptions about real salary growth, percentage of salary invested and real returns through the phases. The simulation exercise also allows for different constant rates of inflation over the 40 year period. Given the emphasis on real growth, the assumed inflation rate has very little influence on the real outcomes though it will affect the nominal rand values as will be shown.


Let us then demonstrate a few outcomes to help make the essential points.

Scenario 1 may be regarded as highly, unrealistically favourable to the long term saver, assuming equity like returns of the kind realised by the JSE over the past 10 years, that is average real returns of 10%. It assumes a contribution rate of 15% over the full 40 year period and real, above inflation salary growth of 2% p.a. for the first 10 years of working life, 4% pa. for the next 20 years and 2% p.a. real growth over the final 10 years of employment. The assumed inflation rate is 6% p.a.


The results are shown below in two figures. The first tracks the salary and portfolio in money of the day (assuming 6% p.a inflation) and the second tracks the important ratio of wealth to final salary. A ratio of above 10 can be regarded as highly satisfactory with retirement in prospect. As may be seen, Scenario 1 leads to some very large numbers after 40 years: a final salary of R3.7m and a portfolio worth R92.7m – a highly satisfactory wealth to income ratio of 24.65 times.


Scenario 1: High returns


Ratio of Wealth to Income


Source: Investec Wealth & Investment


Scenario 2 is much less favourable for the saver. With the same inflation and real salary growth assumption and despite a higher constant 20% contribution rate,  the assumption of an average 3% real return on the portfolio means that the portfolio would be worth a mere R29.3m after 40 years of contributions, or only 7.8 times the same final salary. Retirement in these circumstances would call for a much reduced standard of living.


Scenario 2: Low returns – high contribution rate


Source: Investec Wealth & Investment


Scenario 3 is hopefully more realistic. It assumes an average 6% p.a. real return and a 15% constant contribution rate. The results as shown below may be regarded as satisfactory. The final wealth to income ratio would be 10.4 times.


Scenario 3: Satisfactory returns – 15% contribution rate


Source: Investec Wealth & Investment

Were the saver in Scenario 3 to only contribute a modest 7% of salary for the first 10 years to the pension plan yielding a satisfactory 6% real return, the final portfolio would have grown to R32.055m in 40 years or 8.5 times compared to the 10.4 times or R39.299m that would have been available had the initial contributions been at the 15% rate.

The implication of this analysis is that achieving a satisfactory wealth to final income ratio of 10 times is no gimme – even with the most favourable savings outcomes. Consistently saving 20% of gross salary for 40 years might not get you there unless real returns were well north of a real 3% p.a. These essential higher real returns are by no means guaranteed even if equity risk were taken on in large measure.

The advice to new entrants to the labour force would be to start saving early in a working life and hope for high real returns. Unfortunately what is in your control, raising your savings rate, will not compensate for low real returns. This conclusion suggests very strongly that the long term saver should have a strong bias in favour of risky equities from which higher returns can be legitimately expected. But such higher returns that might compensate for more equity risk cannot be guaranteed any more than can the returns on bonds or cash be estimated with any certainty.

Saving in addition to the pension plan

It would therefore be highly advisable to supplement a pension plan with home ownership. Paying off a mortgage bond over 30 years is a savings scheme that will give you an effective real rental return of the order of 5% p.a. It will give you the choice of consuming accommodation service in the style to which you are accustomed, that is by staying on in the house you own. Or by offering the choice of scaling down your consumption of house, moving to the smaller apartment or less expensive home in the country town, and converting some of the remaining home equity into other income producing assets. What should be strongly resisted is converting home equity into consumption before retirement. Forced contractual saving in the form of paying off the bond is a constraint worth accepting for the long run.

A further form of saving is early membership of a medical aid scheme. Initial early contributions to medical insurance cover more than the risks – later contributions by the older member typically do not provide cover. The excess premiums paid by the younger worker are a form of saving to be cashed in when old. Carrying full medical insurance is a very good way to save up for the medical bills that form such a large proportion of post retirement spending.

Please note that the attached spread sheet is based on an Investec Wealth & Investment model, according to the assumptions explained in the article: Click here to access spreadsheet


Global markets: The essential patterns

By Brian Kantor

We have suggested that the most important indicator of the state of global financial markets, of which SA is very much a part, is the direction of US long bond yields. Thursday and Friday last week provided a further demonstration of their importance for the markets and why they do what they do – and that is to respond the expected state of the US economy.

The better the economic news, the sooner the tapering of Fed injections of cash through additional purchases of US bonds and mortgage backed paper, currently running at USD85b per month, and so the higher the US long bond yields and yields everywhere else, including on SA government bonds.

The backdrop to these interest rate movements were reports on the US labour market. On Thursday afternoon (morning on the US East Coast, or 08h30), it was announced that initial claims for unemployment benefits had declined unexpectedly. This was good news about the US economy and so interest rates went up. On Friday at the same time the employment gains were announced: these were well below expectations – not good news at all.

The reactions in the markets are shown below. US Treasury bond yields went up on Thursday and down on Friday and the RSAs follow very closely (Figure 1). In Figure 2 it is shown how US Treasury bond yields go up and down in similar order and the rand/US dollar exchange rate follows in very close order as capital flows to and from emerging market bond markets responded to the higher then lower US Treasuries.

In Figure 3 we show the links between US bond yields and the S&P 500 Index. The good news that drove up interest rates was good news for the equity market on the Thursday. The initial reaction to the less good news on the Friday morning was to weaken the equity markets. But then through the Friday, the S&P 500 recovered its losses to end the day where it had started. This demonstrated a rather robust state of mind of equity investors. Perhaps the underlying fundamentals in the form of earnings reports and the outlook for them is proving supportive.

Of further interest, in Figure 4, is that the JSE followed the S&P 500 very closely throughout this period. We show this relationship through the index futures that offer more overlap than the spot indices.

QE: An exchange of bonds held by the public for cash issued by the Fed

QE easing may be regarded as an exchange of bonds for cash. The Fed holds more bonds and the banks hold more cash in the form of a Fed deposit. If the balance sheets of the US Fed and the Treasury were consolidated (as they should be since both are agencies of Uncle Sam) the consolidated US government balance sheet after QE is of the order of $2.4 trillion. It now shows lower liabilities to the public in the form of bonds that pay relatively high rates of interest, about 2.6% p.a for 10 year loans, and much larger liabilities in the form of bank deposits with the Fed (some $3.2 trillion) that pay much lower rates of interest, 0.25% p.a.

That these Fed deposits earn anything at all is something of an anomaly – something paid out of the goodness of the heart of Ben Bernanke to the shareholders of banks. It improves their income line and probably (controversially) makes the banks less reluctant to hold on to cash rather than lend it out.

But cash for bonds is likely to cause interest rates to fall and reversing the process – bonds exchanged for cash, as must eventually happen – should cause interest rates to rise. The market understands this very well. What it struggles with is the timing of this reversal, which will be dependent on the state of the US economy. And that is especially hard to predict.

Global Equity Markets: Well Developed?

A notable aspect of equity markets over the past two years has been the absolute and relative strength of developed equity markets. This newfound strength has come to reverse years of distinct underperformance compared to emerging markets, including the JSE.

In the figure below, we compare the performance of the S&P 500 to the MSCI Emerging Market (EM) Index, the benchmark emerging market index and the JSE All Share Index, converted to US dollars since 2000. As the chart shows, the very good relative performance of the S&P 500 is a very recent development. We consider whether these recent trends in relative performance can be sustained.

It should be noted that the JSE in US dollars has outperformed not only developed equity markets since 2000 but has also performed better than even the strongly performing MSCI EM Index that accords about an 8% weight to its SA component (the MSCI EM does not include JSE-listed companies with a primary listing elsewhere).

Relative performance: The S&P 500 vs the MSCI EM vs the JSE (in US dollars, 1 January 2013 = 1)

Source: I-Net Bridge and Investec Wealth & Investment

For the year to the end of June, the S&P 500 was up about 12.6% while the MSCI EM Index had lost 10.9% of its 1 January value and the JSE in US dollars was down about 14.2% (see below). The JSE in US dollars usually behaves very much like your average EM market, for good fundamental economic reasons as we will demonstrate. It has suffered an extra degree of rand weakness against the US dollar, compared to other EM currencies, and so the JSE in US dollars has lagged behind its EM peers.

The S&P 500 vs MSCI EM vs JSE (January 2013 = 100), daily data, US dollars

Source: I-Net Bridge and Investec Wealth & Investment

We can provide a good economic rather than sentiment-driven explanation for this recent outperformance by the S&P 500. We show below how S&P 500 earnings and dividends per share have moved higher since 2011 – while EM and JSE earnings have declined from their recent peaks.

We also show that the growth in EM earnings and JSE earnings in US dollars have been significantly negative – but appear to be coming less negative, while S&P dividends per share have remained positive, though may be trending lower. We provide a time series forecast of both series to mid 2014. Bottom up estimates of S&P 500 company earnings as well as an extrapolation of recent aggregate trends indicate that S&P earnings and dividends will rise further over the next 12 months from their current record levels. The time series forecasts of EM and JSE earnings also point higher, but only well into 2014.

Index earnings and dividends per share in US dollars (2000 = 100)

Source: I-Net Bridge and Investec Wealth & Investment

The earnings and dividend cycles (2010-2014)

Source: I-Net Bridge and Investec Wealth & Investment

Not only have the S&P 500-listed companies performed better than their EM rivals, but we would also suggest that the S&P 500-listed companies have delivered better than expected bottom lines while EM equities and the JSE have delivered disappointing earnings. We will use our valuation models to make this point.


We use S&P 500 dividends rather than earnings as our measure of the economic performance of the S&P 500 because of the complete collapse of earnings in 2008-09. This extraordinary decline in earnings largely reflected the impact of the Global Financial Crisis on the earnings of financial institutions that had to write off so much of their failed lending books. The decline in S&P 500 dividends was less severe and can be regarded as more reflective of the underlying economic conditions.


Our valuation models can be described as earnings or dividend discount models. We run a linear regression equation to explain the level of the respective indexes. We use the level of reported earnings or dividends and long term interest rates as explanations. The models reveal a highly significant positive and consistent relationship over time between the index and earnings or dividends and a negative relationship with interest rates, just as basic valuation theory would predict. These models can be regarded as price to earnings (PE) or dividend ratio predictors of the market levels, with these multiples adjusted for by the prevailing level of long term interest rates. These interest rates represent the rate at which earnings are presumed to be discounted to establish the present value of reported earnings. The long term interest rate acts in the model as a proxy for the required returns of equity investors, or the opportunity cost of capital.


The dividend or earnings discount models do a very good statistical job predicting the value of the different indexes, as we show below. When however market values, as predicted by the model, exceed current market values (i.e. the model suggests an overvalued index), we can describe the level of the market as being demandingly valued and vice versa as undemandingly valued, when the current level of a market is well below its predicted value. These predictions are based on past performance.  


When a market is demandingly valued, that is when current market values are well above predicted or “fair value” according to the model, it is so because earnings are expected to grow strongly and vice versa. Subsequent events will either confirm or refute these optimistic predictions. If earnings do grow as strongly as expected, the index will be supported. If earnings disappoint, the index is very likely to fall away to fall in line with lower earnings. Similarly, when the index seems undemandingly valued – that is, it stands well below its value as predicted by the model – then this may well be confirmed by subsequently poor reported earnings. Then, if earnings subsequently turn out stronger than expectations, share prices and the index will gather strength. The degree to which the predicted values fall above or below predicted values – indicating optimism or pessimism about the economic and earnings outlook – may also be regarded as a measure of risk aversion or risk tolerance.


The observer may then wish to take issue with the collective consensus views that are revealed by market prices. The market might be thought to be too optimistic about the outlook for earnings – too risk tolerant in other words. This would encourage the sceptical active investor to reduce exposure to equities. Or, if the market is judged too pessimistic, or too risk averse by an active portfolio manager, this would encourage a greater exposure to risky equities in the view that economic events and growth in earnings, will turn out stronger than the market expects.


The predictive power of this approach can be back tested by using the models. This will show whether the signals provided by the model to buy or sell more equities would have been justified by subsequent market moves.


Such a model of the S&P 500 run in October 2010 – using data going back to 1980 – would have suggested a deeply undervalued, risk averse market at that time (understandably so with the memory of the global crisis still very fresh in the memory). The degree of undervaluation was of the order of 50%. In other words, the S&P 500 was 50% weaker than would have been predicted, on the basis of the relationship till then between earnings, interest rates and the market. The same approach would have revealed an especially very overvalued or risk tolerant market in early 2000 – just before the Dot.com bubble burst.


Using the same valuation method for the JSE, with all variables measured in US dollars, and using the difference between RSA and US long term rates as the interest rate influence on valuations, the JSE in October 2010 appeared as significantly, or some 28%, overvalued. Subsequent strength in the S&P 500 and weakness in the JSE, when measured in US dollars, provide good support for the validity of the dividend discount model.


The JSE vs the S&P 500, US dollar values (2011- 2013)


Source: I-Net Bridge and Investec Wealth & Investment

We do not have index levels and index earnings data for emerging markets that go back to 1980. However a model of the MSCI EM, using monthly data estimated for the period 1997 to 2010, provides very good statistical fits and estimates. This indicates that emerging markets were fairly valued (not over or undervalued) in late 2010 as per the predictions of the earnings discount model.

For discount rates in this model we have used the spread on EM bonds. It would seem that investors in EM equities in late 2010 were anticipating further increases in earnings from the average EM company. That this performance did not materialize was surely disappointing to investors, leading to a decline in the EM equity markets. By contrast, the subsequent strength of S&P 500 earnings, given its undemanding valuations of that time, early in 2011, was surprisingly good and able to lift the S&P 500 higher.

Updating the model and drawing conclusions about relative performance of developed and emerging markets

We can apply the same approach to the equity markets today. According to the dividend discount model, the S&P 500 today, supported by strong dividend flows, is still significantly undervalued for reported dividends adjusted for long term interest rates, judged by past performance. The model suggests fair value for the S&P 500 as almost 2500 compared to the 1630 levels prevailing recently.

The market and predicted value of the S&P 500, using the dividend discount model

Source: I-Net Bridge and Investec Wealth & Investment

The JSE measured in US dollars in June 2013 remains overvalued by about 22%, according to the model. Applying the model of the JSE measured in rands and using long term interest rates as the discount factor however, suggests that the JSE is not much more than fairly valued. The earnings discount model applied to the EM Index also suggests that this market is in fair value territory.

Thus one can conclude, with the aid of the earnings or dividend discount models, that the markets today are in a similar state to that of early 2011. The S&P 500 valuations appear still undemanding, while the emerging markets are in something like an equilibrium “fair value” state. On this basis, the S&P 500 and developed markets in general would seem much more defensive than the emerging markets and the JSE: the emerging markets remain more dependent on a good recovery in earnings than the S&P 500. Yet the outlook for earnings growth seems more promising in the developed than the emerging world – with the latter’s greater dependence on resource producing companies.

The state of the global economy will depend to an important degree on the future state of the US and Chinese economies. The developed markets will take their cue mostly from the US and the emerging markets mostly from China. One could say the same about commodity prices and the economies more dependent on them. Yet strength in the US, still a very large part of the global economy, will provide impetus to growth everywhere else including in Europe. The most direct beneficiaries of faster US growth will be the companies listed on the S&P 500. In a way it might also be said that China depends more on the US than the other way round.

Lower commodity prices reflect more subdued growth in China and expectations of growth there. However lower commodity prices, while harmful to the commodity producing economies, Australia, Brazil and SA among others, are very helpful to consumers everywhere and especially in the developed economies that account for much of consumer demand. This divergence would apply even more were the oil price also to give way, more than it has to date, to slower growth in China.

The conclusion one is inclined to come to is that, in the absence of a resurgence of growth in China and the other BRICs, and given the positioning of the different markets, the best value in equity markets over the next 12 months may well still be found in the developed rather than the emerging market space.

The realisation of these higher values will be threatened by abruptly higher movements in long term interest rates, of the kind that roiled all markets after the last meeting of the Fed. Faster economic growth in the US will lead to higher interest rates in due course. But faster growth means faster growth in earnings. This may be more than sufficient to overcome higher interest and discount rates in the market valuations attached to the companies delivering these higher earnings and dividends.

Interest rates: Higher interest rates in the US – good news for some

 What is good news for the US economy may or may not be good news for US equity markets. Good news means higher interest rates (or discount rates) with which to value the top and bottom lines of US companies – both of which can be expected to come with faster growth.

Higher discount rates (or required returns) may sometimes win the tug of war with improved earnings and send share prices lower rather than higher. But for emerging market economies and companies, the good news about the US means higher discount rates without the benefit of an improved earnings outlook, at least in the short term, until stronger growth in the US feeds through to the global economy.

The US economy may well be picking up momentum, as Bernanke indicated on 19 June, when he first spoke of tapering off quantitative easing (QE). The emerging market economies by contrast appear to be losing momentum as does the SA economy – this was fully apparent in the statement put out by the Monetary Policy Committee of the SA Reserve Bank last Thursday. Higher discount rates (that have their origin in an improving US economic outlook), when applied to a less optimistic outlook for emerging market (EM) growth and earnings, are unambiguously negative for EM equity and bond prices, EM currencies and all of the interest rate sensitive sectors everywhere.

So much is obvious from recent market moves that saw long term interest rates in the US initially move sharply higher in response to tapering talk, pushing sharply all higher yielding asset prices lower, including real estate and utilities as well as EM bonds and equities.

Last week this pressure eased, as long dated US Treasury Bond yields, both the standard fixed interest variety and (perhaps of greater significance) the inflation linked variety declined significantly, as we show below.

The relief for EM equities, bonds, real estate and currencies was palpable and very welcome. The best news for emerging markets will be a modestly improving economic outlook in the US – modest enough to keep long term interest rates on hold and, better still, to move them lower. Higher US equity valuations, in the absence of higher interest rates, will do no harm to EM equities. They may even help support them as they did last week. Brian Kantor

An encouraging week for investors in SA equities, bonds and the rand

By Brian Kantor

It was a good week for emerging markets (the MSCI EM up 4.4%) and the rand (which gained nearly 4% on a trade weighted basis) last week. It was an even better week for off shore investors in the SA component of the EM benchmark (MSCI SA) that had returned as much as 8% in US dollars by the weekend. On a trade weighted basis the rand is now about 18% down on its value of a year ago.

The response of the RSA bond market to the stronger rand was also consistently favourable. The yield gap between conventional RSA bonds and their inflation-linked alternatives narrowed to 6.1%, indicating less inflation expected, while the yield gap between RSA 10 year bond yields and the US 10 year Treasury bond also narrowed to below 4.9%, indicating a slower rate at which the rand is priced to weaken over the next 10 years. This breakeven exchange rate weakness may be regarded as a measure of the SA risk premium. It would take an extra 4.9% in rand income to justify an investment in rand denominated assets of equivalent risk, rather than US assets.

The rand and the rand bond market benefited last week from strength in emerging market equity and bond markets as US bond yields retreated from their fear of the end of QE spike last week. It should be appreciated that the bond market moves the week before in the US and elsewhere were of an extraordinary dimension –an apparent overreaction to a promised return to something like normal in the fixed interest space.

The partial recovery of the rand portends less inflation and the developments in the RSA fixed interest markets were consistent with this. Any further strength of this kind would convert premature fears of higher short term rates in SA into expectations of lower short term interest rates. The SA economy deserves lower borrowing costs and a stronger rand would make this possible. Better still for the rand would be less disruption of output on the mines than is currently expected (and priced into the rand).

Global interest rates: Ben Bernanke did not get what he wanted from the bond markets

By Brian Kantor

Fed chairman Ben Bernanke spoke of a surprisingly promising outlook for the US economy, of 3% to 3.5% growth in 2014 that, if it all materialises as predicted, would allow the Fed to taper off its securities purchase programme from September this year and to close down the purchases by late 2014 (currently of the order of $85bn a month).

The market listened and reacted in ways that were consistent with the prospect of faster growth in the US but they would not have pleased Bernanke. He was at pains to emphasise in his statements how conditional would be the direction of quantitative easing (QE), ie conditional on the actual improvement in the US economy (and the labour market in particular) to keep the market at ease. The severe bond market reactions were not welcome because higher interest rates (especially higher mortgage rates) may threaten the recovery itself.

Longer term interest rates moved sharply higher in reaction to Bernanke and the Fed. By the weekend the 10 year Treasury Bond yielded over 2.5%, compared to about 2% a week before. More economically significant was the move in inflation linked bonds (TIPS). These real yields moved even than did the yields on the vanilla Treasury bonds, from close to zero on 16 June to over half a per cent by the weekend. Higher real rates are consistent with an improving growth outlook, leading to increased demands for capital to invest in real assets. And so the gap between the vanilla yields and the inflation protected variety narrowed to less than 2%.

Bernanke indicated in his press conference that his target for inflation is 2% per annum – anything less in his view represents a deflationary danger for the economy. The market now expects inflation to be dangerously low – implying more, rather than less, monetary easing to come.
The negative reactions of the equity markets to the more promising outlook for the US economy were not as easily explained. The S&P 500 was down by just over 2% in the past week, having been very firm before the Fed statement. Stronger, more normal US growth of the kind the Fed is expecting drives earnings as well as interest rates higher – possibly enough to add rather than detract from the value of equities that remain (in our judgment) still undemandingly valued by the standards of history and the prospects for earnings.

These interest rate developments in the US had severe repercussions for emerging bond markets and emerging currencies, that until recently have been beneficiaries of a search for yield in a world of generally very low yields. Not-so-low yields in the US reversed these flows, leading to pressure on emerging market currencies and yields of all kinds. SA was not spared these withdrawals of cash from high yielding assets, though the rand and the rand bond market did less poorly than many other emerging market currencies and bond markets, subject as they have been, for example in Brazil and Turkey, to violent demonstrations on their streets.

The rand actually gained by a per cent or two against the basket of EM currencies and the Australian dollar in the week ending 21 June. The yields on both long dated conventional RSA bonds and the inflation-linked equivalents rose, though this yield gap widened slightly, offering more compensation for bearing SA inflation risk by the weekend.

The yield gap between RSA rand bond yields and US Treasury bond yields can be regarded as compensation for bearing the risk of the rand depreciating. This yield gap can also be described as break even rand depreciation. If the rand depreciates over time at a faster rate than implied by the difference in interest rates, it would be better to buy US bonds (and vice versa if the rand does better, that is depreciates on average by less than the difference in yields). This yield remained largely unchanged through the past week. While the rand has weakened against the US dollar it is not priced to weaken at a faster rate.

Expectations about the direction of short term interest rates in SA have been revised sharply higher to the disadvantage of all the interest rate sensitive stocks listed on the JSE, the retailers, property companies and banks etc. With a more sharply inclined yield curve the one year RSA rate expected in a year’s time was 5.13% on 30 April. It is now 7.6% (see below):

The state of the SA economy does not justify higher short term rates. The Reserve Bank is predicted to raise them notwithstanding. Our view is that the Reserve Bank will correctly resist raising rates until the SA economy has picked up momentum, rather than slowing down, as it appears to be doing.

The immediate future of the longer term interest rates in SA will take their cue largely from the direction of long term rates in the US. Better economic news emanating from emerging market economies (and China in particular), would also help the rand and the RSA bond market. There would appear to be some chance that the US bond market has over reacted to good news about the US economy – expectations that have still to be fully vindicated. Higher rates will also encourage the Fed to maintain, rather than slow down, the pace of its bond purchases. If so, the past week may well prove a temporary high water market for interest rates in the US and elsewhere.

A day in the markets that can become the stuff of legends

By Brian Kantor 

Between the SA bond market opening at 08h00 yesterday, long term interest rates went up and the rand went weaker in almost perfect unison, by about 2% or more as foreign investors sold RSA bonds as they were selling all other emerging market bonds. And then just before noon the heavy traffic reversed course – again in perfect unison. When the bond market closed in SA, the rand had regained nearly 1% of its opening value and the long bond prices were nearly 3% stronger. Of the emerging market bonds, the RSAs had served best by the end of the SA trading day with most of the peer group in negative territory, for example Turkish lira denominated long bond yields were the worst performer, up 36bps.

The Bloomberg screens below copied at 17h00 tell the story – in normalised percentage terms and in actual prices and yields:


The precipitating force adding to yields and global bond market volatility has been the further sharply higher move in US long dated Treasury Bond yields. The financial markets are struggling to cope with the initial steps in what may well be a return to something like normal yields on US Treasuries. How long this will take and where higher interest rates will come to rest are important matters of conjecture. With higher yields promised by the safest bonds, the search for riskier yield elsewhere loses some of its urgency: hence the move away not only from higher yielding emerging market bonds but also from higher yielding utilities and property companies. Another dampener for the higher yield market has been significantly higher long bond yields in Japan – despite QE – and a stronger yen.

But of particular interest is that higher yields on vanilla bonds in the US have been accompanied by higher yields on the inflation linked variety. The yields on long dated US TIPS (inflation protected bonds) have moved higher, fully in line with the inflation-exposed bonds. The TIPS are now offering a positive real rate of return – the real yields until recently were negative. Thus the difference in these yields – the extra yield on the vanilla bonds being compensation for bearing the risks that unexpectedly high inflation will erode the value of interest income – has not altered much at all. It is therefore expectations of stronger sustainable future economic growth rates and therefore increases in the real demand for capital, that are driving real returns higher.

Higher real returns on capital is surely good news about the US and the global economy because it implies improved growth prospects. Faster growth should augment operating profits, cash flow, earnings and dividends of globally focused companies. The improved bottom lines may well be expected to compensate for the higher costs of capital (or required returns) as interest rates rise.

However this was not the case yesterday. Global equity markets were in strong retreat. The JSE, in rands, lost over 3% of its opening value (though less in US dollars). What was also of interest was that the sharp turnaround in the value of the rand after midday had no easily observable impact on the JSE or the sectors that make it up – it was a deep red colour where ever you looked.

The global companies listed on the JSE, the SABMillers, Richemonts and BATs of this world, did not act as rand hedges either before or after noon. The interest rate sensitive sectors on the JSE – property, banks and retailers – also bled through the day even as the rand strengthened.

A comparison of the price performance of the different sectors of the SA financial markets this year is made below. The increase in long dated interest rates in SA, as reflected by the All Bond Index (ALBI) and its inflation linked equivalent (ILBI) has dragged down the Property Loan Stock Index from a near 20% gain in mid May to a mere 4% up on Monday. Bonds have suffered more than property while equities had done about as well as property by Monday’s close. Using month end data and the JSE at the close on 10 June, we show how the S&P 500 in rands has provided excellent returns this year, over 40% if dividends are included. The global plays on the JSE (the Industrial Hedges) have performed nearly as well while the resource companies, the commodity plays, and the interest rates sensitive SA plays have all lagged. These two groups of companies – those sensitive to interest rates or commodity prices – have both lost about 5% of their rand value since 1 January 2013. The weak rand has, perhaps surprisingly, not helped the commodity plays while, as would have been expected, it has damaged the prospects for the SA economy-dependent plays.

Conclusion

The outlook for the rand, the JSE and emerging markets will be determined by the usual mixture of global forces and SA political specifics (in SA’s case). The recent volatility in financial markets can be attributed to global forces. But the rand is off a much weaker base for SA reasons. The global tug of war between higher interest rates and better growth prospects appears to be under way. Our sense is that the growth team will win this tug of war over moderately higher interest rates in the US, to the advantage of the S&P 500.

The rand and other emerging market currencies, including the weak rand, may well benefit from strength in global equity markets – though not as easily from bond markets. The SA specifics wil lalso continue to influence the value of the rand. Any sense that the mining sector wil not be as severley disrupted by strike action than expected, could bring a degree of rand strength. Even a modest recovery in the rand and bond market will make it easier for the the Reserve Bank to keep its repo rate on hold. It should do so regardless of the exchange value of the rand that is beyond the influence of SA monetary policy – as should be apparent to all.

The Hard Number Index: The demand side of the economy has held up – but the economy is under pressure from the failures on the supply side

By Brian Kantor


Hard Number Index updated – economy still growing but at a slower pace

We have updated our SA economic activity indicator, the Hard Number Index (HNI) for May 2013 with the release of vehicle sales and notes in circulation data. The HNI indicates that economic activity in May was still growing at an improved rate. The forward momentum however (the speed of the economy) is slowing down and is predicted to slow down further over the next 12 months. The change in the HNI may be regarded as the second derivative of the economy with the HNI or the business cycle as its rate of change – positive or sometimes negative when the economy shrinks.

The HNI and the Reserve Bank Indicator are both well above the 100 level

Our index is an equally weighted combination of new unit vehicle sales and the notes in circulation issued by the Reserve Bank – adjusted for the CPI – that we call the Real Money Base (RMB). These two hard numbers provide a very up to date view of the state of the economy, being released within a week of any month end. We show a comparison of the Coinciding Indicator of the Business Cycle as calculated by the Reserve Bank. This indicator is based upon seven or more time series mostly using sample surveys rather than hard numbers that are released with variable time lags. The latest estimate made by the Reserve Bank is only for February 2013.

As the chart shows, our HNI has identified rather accurately recent turning points in the Reserve Bank indicator. The Reserve Bank recently rebased this indicator to December 2010 and we have done the same. Numbers above 100 in these diffusion indexes indicate that the economy is growing and numbers below that the economy is shrinking. Both the HNI and the Coinciding Business Cycle Indicator are recording numbers well above the 100 of December 2010, implying still strong growth momentum. Our indicator predicts that this forward speed has slowed and will slow further in the months to come.

Vehicle Sales remain a strong feature of the economy – real money base growth slowing

The most encouraging feature of the SA economy is the strength of new vehicles sold domestically. Export volumes have also gathered momentum, accounting for about half of domestic sales volumes. While the growth in unit vehicle sales has slowed down it has remained close to an 8% annual rate and is predicted, via a time series forecast, to maintain this rate. The supply of central bank cash, adjusted for higher consumer prices, peaked recently at about an 8% real rate and is currently growing at about a 4% rate – held back by more inflation and a slowdown in the growth in cash held by the public and banks. It is forecast to slow further.

Money supply (M3) and Bank Credit Growth have picked up

The bank credit and broader measures of the money supply have been updated to April 2013. As we show, the growth in M3 and in credit supplied to the private sector has gathered momentum despite consistent weakness in demands for mortgage finance. Bank credit could not be regarded as a drag on growth.

The drag on the economy is coming from the rand

The drag on growth in domestic spending is now coming from offshore. The limits to this growth are set by the willingness of foreign suppliers of capital in one form or another to fund our spending. This willingness is revealed in the foreign exchange value of the rand. This has deteriorated significantly in recent months, putting upward pressure on the prices consumers and firms have to pay for their goods and services, especially those with high import content. These higher prices might also be accompanied by higher interest rates.

Our view is that, given the weaker predicted state of the economy, the Reserve Bank will wisely resist increasing short term interest rates. Relief for the economy will however not come from lower interest rates. The source of recovery will have to come from increased exports, especially of metals and minerals. The rand is weaker because it is expected that the mining sector, which accounts for 60% of exports, will be further disrupted by strike action. Were the mines able to operate at a better than expected rate, the rand would benefit and the chances of lower interest rates, well justified by slower growth in domestic demand, would greatly improve.

Inflation and the rand: Why doing nothing is the best SA monetary policy can do

By Brian Kantor

An unfortunate history of exchange volatility

The SA economy is once more challenged by an exchange rate shock. As we show below, such exchange rate weakness – of the order of a 15% or more move lower in the trade weighted exchange rate, compared to a year before is hardly unknown. In fact the latest shock is the fourth since 2000. As we also show below, the rand had lost as much as 26% of its foreign trading value by May 2002. By early 2007 the rand was down by about 15% on its value a year before and then 20 months later had lost 19% of its value.

The rand on 31 May 2013 was about 14% weaker than 12 months ago on a trade weighted basis. It will also be appreciated that while the long term trend in the value of the rand since 2000 has been one of rand weakness, the direction is by no means one way. Weakness can be followed by strength of similar magnitude. These unpredictable shocks, in the form of large sustained movements in the value of the rand in both directions, can be of similar magnitude and can complicate business decision making and monetary policy. They are a most undesirable feature of the SA economic landscape.

The sources of exchange rate volatility have very little to do with monetary policy

These large exchange rate movements are a response to interruptions or disruptions in the flow of capital to and from South Africa. Increased demands for rands push the rand higher and less demand moves the price of the rand higher or lower when valued in other currencies. It is very much a market-determined and flexible – very flexible in both directions – rate of exchange. The SA Reserve Bank does not typically use its own stock of foreign exchange to intervene in the market for rands.

This market, a deep one at that, regularly transacts over US$15bn worth of rands every trading day, according to the Reserve Bank on the basis of information provided by the trading banks. Three quarters of the trade is conducted between third parties without a direct connection to SA trade or finance. They presumably trade and hedge the rand so actively as a proxy for currencies that are less liquid. As we show below there is no obvious relationship between the trade weighted value of the rand and turnover in the currency market.

The one highly predictable impact of an exchange rate shock- more or less inflation

The one highly predictable influence of an exchange rate shock is that more or less inflation will follow in the opposite direction. More inflation when the rand weakens – less when it strengthens. It is most important to recognise that for SA the exchange rate leads and the inflation rate follows. In conventional monetary theory it is faster domestic inflation (caused by easy monetary policy) that leads to a weaker exchange rate. The weaker exchange rate then should help to maintain the international competitiveness of exporters and firms that compete with more expensive imports priced in the weaker domestic currency. In the figure below we identify the timing of the shocks that have sent the rand weaker and show how the trend in the inflation rate has followed these shocks consistently.

In the figure below we show the results of a very simple model. The trend in inflation is very simply explained in a single regression equation by the annual movement in the trade weighted exchange rate, lagged by six months. The model does well in predicting the direction of inflation in SA and also its level. The explanatory power of the model is rather good – explaining over 60% of the inflation trend. As the chart also shows, there is somewhat more to inflation than the exchange value of the rand. The model significantly underestimated inflation in 2008-09 and has less significantly underestimated it recently.

Among other forces moving SA prices and inflation are trends in global prices, particularly in the prices of grains and other soft commodities in US dollars that influence the domestic price of food when translated at import price parity into rands. The global price of oil is also very important in this regard. Clearly independent of the value of the rand, global inflation or deflation (including oil price increases or decreases) will influence prices in SA and their rate of change. The pace of administered prices increases in SA (taxes by another name) will also have an influence on the CPI. So will the strength or otherwise of domestic spending, supported more or less by the growth in money supply and credit and interest rates, that is by monetary policy.

Monetary policy is largely impotent in the face of exchange rate shocks of this order of magnitude

It should be very obvious from the recent history of inflation in SA that there is little the Reserve Bank or monetary policy can do about inflation because it cannot influence the variable exchange value of the rand in any predictable way. The same monetary history tells us that raising or lowering interest rates have simply no predictable impact on the exchange rate. Monetary policy is largely impotent in the circumstances of exchange rate shocks of the order of magnitude suffered by SA. Inflation targeting, to which SA subscribed in the early 2000s with all the sincerity of the newly converted, had as its justification the conventional wisdom of monetary policy of that period. The presumption of inflation targeting was that a politically independent central bank would target inflation with its interest rate settings in a sound way and inflation and the exchange rate would behave itself in a predictable way.

The unpredictable nature of exchange rate shocks – global or domestic in origin

That presumption has proved to be a false one. The exchange rate has not behaved itself and so measured inflation has remained largely outside the influence of monetary policy. Monetary policy and interest rate settings can clearly influence domestic spending. But maintaining the balance of domestic demand and potential supply does not at all necessarily secure exchange rate stability as we observe.

The exchange rate can have an unhealthy life all of its own, responding as it does to global forces, as it did during the Global Financial Crisis of 2008-09. This crisis increased the global demands for safe havens and reduced the demand for riskier emerging market assets and their currencies, including the weaker rand, and led to more inflation in SA.

The other shocks to the rand we have identified are much more SA specific in their origins. We can identify such SA specific risks driving the rand by comparing the behaviour of the rand to other emerging market or commodity currencies over a period of rand weakness or strength. The forces driving the rand in 2001-02 and in 2006-7 were largely SA specific in their origins. The rand has weakened by significantly more than its peers over these periods of weakness.

The only time the Reserve Bank may be held responsible for rand weakness was in 2006-7. Then the bank adopted interest rate settings that were too severe, that threatened the growth prospects for the SA economy and frightened capital away. The 2001-2002 weakness was an unintended consequence of partial exchange control reform – that led to panic demands for foreign currency by local wealth owners and fund managers. The latest burst of rand weakness that began in August 2012 is associated clearly with labour relations on the mines and elsewhere that threaten mining output and exports that are so important to the trade balance of the rand. Foreign and local investors have been discouraged by the political responses to this crisis.

Nothing for the Reserve Bank to do but watch the economy ride out the storm

As clear as are the political origins of the latest exchange rate shock is that the Reserve Bank and its interest rate settings can do nothing now to meaningfully assist the rand. It is out of their hands. Raising interest rates would further weaken domestic spending, that cannot be regarded as excessive. Still slower growth in domestic spending following any imposition of higher interest rates would if anything further undermine the case for investing in SA and could lead to a still weaker rand. Indeed, were it not for rand weakness, interest rates would have been reduced to encourage domestic demand. But such action might well be regarded as less than responsible in the circumstances.

The best the Reserve Bank can do in these difficult circumstances is to do very little. The economy must be left to rise out the exchange rate shock and the temporary increase in inflation that is likely to follow. The weaker rand will encourage production for export and for the domestic market as prices and profit margins for exporters and those competing with imports have improved. Hopefully the mining sector will be allowed to benefit from these price and profit trends. Hopefully too, the politicians can help the industry. Higher prices, especially for goods or services with high import content, will discourage consumption. There is nothing the Reserve Bank can usefully do to slow these inflation and relative price effects down. Raising interest rates would damage the economy further. The best monetary policy can do in response to an exchange rate shock (that is not of its making) is to do nothing at all – but also to explain why doing nothing is the best policy.

How important is mining to the SA Economy. It depends on how you measure it.

A crisis of poor returns on capital invested and declining employment opportunities

SA mining is in crisis. And the travails of SA mining, more particularly those of gold and platinum mining are having a very negative impact on GDP and expected GDP growth and on the value of the rand. To survive as viable businesses able to cover their costs of capital the mines have to plan for lower costs of operations and that means to plan for lower levels of production and employment, that is plan the closing rather than the opening of mining shafts. Investors in the industry and in the South African economy are not at all sanguine about the prospects for the industry and this lack of confidence is well reflected in the market value of the mining companies and in the exchange value of the ZAR.

The market fears further disruption of mining output by uncooperative trade unions. Union leaders do not appear to share the same sense as have shareholders and potential investors have of an industry in crisis. The Unions are expected to further resist retrenchment of their members and to continue to demand what shareholders and also the government regard as hopelessly unrealistic demands for improved employment benefits.

The future of deep level mining in South Africa may well lie in much higher levels of automation. This is a course of action not suited to an economy with so many unemployed or employed on far inferior terms outside the mining sector.

The mining sector contributes much to exports and to the outlook for the rand and interest rates

Lower levels of mining production, particularly if they are the result of strike action, threaten the trade account of the balance of payments and justify a weaker rand. The weaker rand then implies more inflation that makes it harder for the Reserve Bank to offer relief to the economy in the form of lower interest rates, relief, absent a widening trade deficit, that would make every economic sense.

Growth in Domestic Expenditure (GDE) has held up significantly better than growth in domestic output (GDP) meaning stronger growth in imports than in exports. The failures of the mining sector to produce more and to take advantage of what has been until recently, highly favourable price trends ( as we will show below) are a large part of the explanation of current rand weakness and slow economic growth generally.

The share market doesn’t expect growth in output or even growth in earnings and dividends from the mining houses and their subsidiaries. It is rather demanding that the mining houses pay much closer attention to cost control and operational excellence. These low market expectations should act as a warning to managers, workers and the government responsible for mining policy. The lower profits and reduced growth expected is not in synch with demands for higher wages, electricity prices and government interference with mining rights and the taxation of mining profits.  The potential upside for shareholders is that if these low expectations can be countered by sober management and better relations with labour and government then these mining companies stand a stronger chance of recovering their status with investors. Merely sustaining the output of gold, platinum even at lower planned levels, would be surprisingly good news and likely to be well received in the share and currency markets.

How dependent then is the SA economy on the mining sector? It all depends on how the share is measured

The SA economy remains highly dependent on the export of minerals and metals. Directly exported minerals and metals account for as much as 60% of all export revenue. Hence the sensitivity of the foreign exchange value of the rand to mineral and metal prices and their production.

Mining’s share of the Gross Value Added (GVA) by all sectors of the SA economy in 2012 was no more than 5.5% when measured in constant 2005 prices. When both mining output and GVA, including mining output, is measured in current prices, mining’s share rises to 9.3% of GVA. As we show below, when measured in constant 2005 prices, the contribution of mining to GVA and GDP has been steadily declining over many years from a large 23% share in 1960 to the current less than 6% share , regardless of the direction of global metal and mineral prices and so mining revenues.

As we also show that when the share of mining is measured in current money of the day prices the share of mining in the economy takes on a very different complexion. The share of mining in the SA economy, so measured as a ratio in current money of the day prices, was less than 12% in 1960, compared to over 23% in constant price terms that year. In 1970 the share of mining in GVA was 8.8% if measured in current prices, or a much higher share, 20% of the economy,  if measured in constant 2005 prices. Thereafter the mining share measured in current prices rises significantly rises in response to the very significant increases in the gold price in the seventies. When the gold price peaked in 1980 the share of mining in GVA in current price terms was as much as 21%- but then only about 12% if recorded in constant 2005 prices. Thereafter, as the gold price fell away and the prices of mining output were subject to a long period of deflation and a further decline in the output of gold, the share of mining in current price terms fell further to a much less important 7% by the year 2000. Thereafter when measured in current prices Mining gained a marginally larger share of the economy to the 9% share measured in 2012. The increased output of and higher prices coal and iron ore were significant contributors to thei increase in economy share. The share of mining in the economy in constant price terms by strong contrast declines continuously after 1960 and appears completely unaffected by relative prices or industry trends as we show below.

The share of Mining in Gross Value Added using constant 2005 prices or current prices

Source; SA Reserve Bank Data Bank, Investec Wealth and Investment.

Real prices matter a great deal to producers

A key to the role of any sector of the economy, with an improving or deteriorating share of the economy, is surely relative price trends. When a sector enjoys what may be called pricing power, that is to say the sector can price increases ahead of the average rate of inflation , then one would expect improved profit margins to follow and extra output to be encouraged. In the figure below we show how the SA Mining Sector Price Index, that is the mining sector deflator, has compared over the years with all prices, including the prices of metals and minerals, as reflected by the Gross Value Added Deflator.

As may be seen between 1960 and 1970 Mining Sector selling prices lagged well behind the selling prices of all SA production or value Added.   In the seventies, helped especially by a rising gold price, prices realised by the SA mines, rose significantly faster than prices in general. A long period of metal and mineral price deflation then followed until approximately 1999 when commodity prices picked up strongly in absolute and relative terms. These favourable trends or terms of mining trade were then disrupted by the Global Financial Crisis of 2008-09

The Mining Sector Deflator compared to the Gross value Added Deflator (2005=100) Logarithmic Scale

Source; SA Reserve Bank Data Bank, Investec Wealth and Investment.

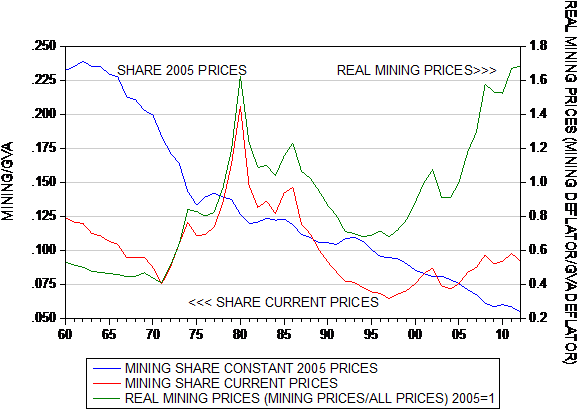
 If we divide the Mining Sector deflator by the GVA deflator we get the relative price of mining output. For producers in any sector the higher the relative price the better and the more encouragement offered to increase otput.[1] In the figure below we compare these relative prices with the share of Mining in GVA, measured in current prices. As may be seen the share of mining grows and declines very consistently with improvements in or a deterioration of the relative prices of mining output. Such responses make every economic sense. That the share of mining, when measured in constant price terms, declines consistently and independently of these relative prices makes very little intuitive sense. Relative prices appear to make no positive impact on the mining sector at all when the mining share is measured in constant prices. The share of mining in the economy, when measured in constant prices, simply declines continuously as may be seen.

The reason for this highly counterintuitive result is simply in the arithmetic of National Income Accounting conventions. If sector prices – for example mining sector prices – rise faster than prices in general then the share of that sector in the economy, when measured in constant prices, automatically declines and vice versa when sector prices rise more slowly than prices in general the share of that sector will rise automatically. [i]

The presumption of such a result is that it is the supply side of the economy, rather than demand forces that drive relative prices and so relative shares in national income methods of calculation. That is it is an increase in supply that results in a lower relative price and so a larger share of the economy. Rather, that as in the case of mining output, where prices are set globally and the mines are price takers, to presume that it is an increase in global demand that leads to higher prices and in turn to more profitable production and so increases in output and in the share of the economy realized by a sector.

Applying the standard convention to the share of Mining and also Exports in SA subject to similar price trends becomes seriously misleading. Measuring sectoral shares using current prices makes much more economic sense.

It should be noticed in the figure below that SA miners benefitted from an extraordinary increases in the prices for their output compared to prices in general in the seventies and after 2000. Relative prices have moved further to the advantage of the mining sector over the past twelve years as may also be seen. That Mining’s share of the economy did not rise anything like as significantly in the past decade and more reflects the wasted opportunity to benefit from the commodity super cycle. The mining boom in terms of volume of output produced regrettably largely passed South African production by. The costs of mining gold and platinum rise as rapidly as did prices. Uncertainties about government policies towards mining and the failure to invest in additional transport infrastructure to export more coal and iron ore also contributed significantly to the modest supply side responses to much more favourable relative price trends.

Mining share of GVA and Relative Mining Prices


Source; SA Reserve Bank Data Bank, Investec Wealth and Investment.

Another very good reason to question the use of constant prices to calculate sectoral shares of the economy  is that these shares can change meaningfully with changes in the base year used to measure constant prices. Using exactly the same price series, the same deflators, measured in constant 2005 prices or constant 2000 or constant 1970 prices can make a large difference to the share of a sector measured in constant prices as we show below. Using a deflator with 1970 prices =100 for both Mining and GVA, to one using much lower 2000 prices or 2005 prices as the base equal to 100 shifts the share of mining in constant prices in 2012 from 2.4% using 1970 prices to 4.8% using 2000 prices to 5.5% using 2005 prices. [ii]

Share of Mining In the SA economy using different base years


Source; SA Reserve Bank Data Bank, Investec Wealth and Investment.


That changing the base year can have such a meaningful effect on the sector share makes the use of constant prices as the basis for calculating the share of different sectors in the economy highly unsatisfactory. While the trends in the sector share, measured in constant prices using different base years, remains exactly the same the numerical values can turn out to be very different. Every change in the base year results in once and all constant shift in the trend giving a different impression of the importance of the sector to the economy. This is why in our judgment the most consistent measure of mining’s contribution is the ratio of mining output to Gross Value Added ( GVA)when both mining output and that of all sectors including mining GVA, is measured in money of the day prices. By this calculation the share of mining in the SA economy peaked in 1980 at over 20% and currently contributes about 9% of all value added as we show above.

The contribution of manufacturing to the SA economy is exaggerated using constant price calculations


The same approach to measuring the share of Manufacturing in  SA production can  be taken. In the figure below we show Manufacturing’s share in GVA as well as the relative price of manufacturing Output. As may be seen the share of Manufacturing measured in current prices was approximately 24% in the eighties. It has since declined markedly to a 12.4% share in 2012. This declining share has been accompanied consistently by an almost continuous decline in relative prices. This downward price pressure has clearly accelerated in recent years. Manufacturing in SA has become increasingly exposed to competition, especially from abroad. Consumers and retailers and their employees have benefited from the competition.

Manufacturing Sector; Share of Output and Relative Prices

Source;  SA Reserve Bank Data Bank, Investec Wealth and Investment.

Conclusion

Economic statistics should accurately reflect economic realities and hopefully lead to appropriate economic policy and policy changes. Measuring sector shares in SA in constant price terms as is the National Income Accounting Convention is very misleading about the role of mining in South Africa and therefore also about the role of other sectors, including Manufacturing as we have argued. A irony is that if shares in the economy were measured in current rather than constant price terms this past quarter the disappointing and currency moving Q1 GDP numbers would have looked rather different. Manufacturing, with a lower share of the economy when measured in current prices, 12.3% share in current prices in 2012 compared to 17.2% in constant prices, with a close to 8% decline in output on a seasonally adjusted and annualized basis, would have been less of a drag on economic growth. And mining output that increased in Q1 given a larger share of GVA (5.6% in constant prices, 9.3% in current prices) would have added more to the growth rate.


[1] The case of Gold Mining in South Africa is somewhat different to the norm. In the seventies and eighties the higher gold price offered a choice to the mines. They could choose to mine shafts with lower grade, that is ore with lower gold content and in this way extend the life of the mines by extracting more gold bearing ore so leaving less gold behind. They typically elected, where possible, to extract more gold bearing ore from underground with lower average gold content. As a result the output of gold fell from 1000 metric tons in 1970 to 670 tons in 1985 while the tones of ore extracted and milled by the mines grew by about 30% from 75m tons in 1970 to 105m tons over this period 1970 – 1985. Capital expenditure by the gold mines was R106m in 1970 and R1911m in 1985. Working profit per ton of ore milled was a marginal R3.9 in 1970 and a hugely profitable R70.46 in 1985.  416,846 workers were employed by the gold mines in 1970 and 513,832 in 1985. If productivity was measured as output of gold per worker employed then it declined sharply over this period, from 2.3 kg of gold per worker in 1970 to 1.3kg in 1985. If productivity was however more realistically measured as tones of ore extracted per worker, then it would have improved from 178 tonnes of ore milled d per worker in 1970 to 203.5 tonnes in 1985. These tradeoffs of lower grade for a longer mining life seem no longer available to the gold mining industry. The better grades of ore appear as largely exhausted and the industry is forced to mine lower grade ore at ever deeper more costly levels. The volume of ore extracted has declined consistently over the past ten years while the annual output of gold from SA mines is now below 200 tonnes. (See Table Below)  Source; Annual Reports of Chamber of Mines of South Africa.


[i] The mathematical proof of this and other propositions made here are to be found in a paper written in 1987 with Iraj Abedian, Relative Price Changes and their Effects on Sectoral Contributions to National Income , that can be found in my blog www.zaeconomist.com

[ii] Reducing or increasing the absolute value attached to the price series reduces or increases the sectoral share by a constant value. The 1970 deflator rises from a very low absolute base of 100 in 1970 to a level of close to 50000 in 2012- a 500 times increase in average prices over the 42 years. The deflator for 1970 using 2005 prices as the basis would have an absolute value of 0.869 compared to the value of 100 if 1970 was chosen as the base year. Clearly such absolute numbers with excatly the same underlying trend should not have a real effect.


Equity markets and retirement: Back to the future

By Brian Kantor

It is retirement plans for the future that should concern us, not those of the past that have done so well in South Africa.

The weekend newspapers were full of exhortations for South Africans to save more than they appear inclined to do for a comfortable retirement. Personal Finance, in a caption (Weekend Argus 18 May 2013) reports: “You need to save more than you planned to do if you want to have a financially secure retirement, because of interest rates and investment market expectations.”

Given the decline in long term interest rates (and so expected market returns), it will take a larger capital sum to purchase a highly predictable flow of monthly annuity income from a life insurance company. Or, in other words, for any given life expectancy, a million rand of accumulated savings will now buy you significantly less monthly income from an annuity supplier than it would have 10 years ago, when long term interest rates and so expected returns were much higher than they now are.

The article in Personal Finance is accompanied by a figure describing the monthly “inflation-related” pension that could be purchased “by a 65 year old man with provision for spouses annuity and a 10 year guarantee” with R1m. The figure shows the contracted monthly pension as having declined from over R3 700 per month in December 2007 to about R3 000 per month today. A vanilla annuity without any inflation protection would provide about a fixed R60 000- R70 000 per annum for the same retiree.

Interest rates on an RSA bond with 10 years to maturity have declined markedly since 2002 from over 12% for a generic 10 year bond, to their current levels of about 6.3% while inflation linked real yields offered by the RSA government have declined even further, from 4.93% in early January 2002 to their current levels of about 0.6% (see below).

The expected return on a bond is its yield. The expected return on an (on average) risky equity is the bond yield plus an equity risk premium of an extra four or five per cent per annum. If realised returns approximate expected returns – a very large presumption – the lower the market interest rate and the lower the expected returns from bonds or equities, the more you will have to save to secure a given monthly income.

It is these largely certain income streams, a certain nominal 6.3% per annum or so from a 10 year RSA, or a real 0.6% (that is 0.6% plus actual inflation from an inflation-linked 10 year RSA), that form the basis on which a guaranteed annuity of either the inflation exposed or inflation protected variety will be offered by a life insurance company (the R36 000 or R70 000 annuity per annum referred to).

Realised and expected returns may however turn out to be very different. In the US for example, on 31 January 2002 very long dated US Treasury Bonds offered a yield of about 5.43%. Total annual returns from these long dated bonds, calculated each month end between January 2002 and April 2013, averaged approximately 8.75%. Total returns are the sum of interest yield, interest/capital values plus the annual change in the market value of the bond.

As long term interest rates in the US trended significantly lower over the period, long bond prices went proportionately higher, so providing unexpectedly good returns from US bond portfolios – on average 3.3% per annum above the expected returns of 5.43% offered by a 30 year US Treasury Bond on 31 January 2002. By contrast the average US equity investor realised well below expected returns. Equity returns would have been expected to realise about 9% a year in January 2002. Actual returns on the S&P 500, including dividends and capital gains and losses, averaged a mere 2.8% per annum. over the 11 year period. US inflation averaged 2.44% over the period, well ahead of short term interest rates that were an average 2%. Unexpectedly low inflation a brought down long term interest rates and pushed up bond prices to the advantage of bond holders. They did very little for equity investors who would have expected to have earned a premium return over bonds given their greater volatility.

Contributors to a reasonably well managed defined contribution SA pension fund since 2002, that would sensibly have included a good weighting in equities, have realised excellent real returns on their pension funds, than might have been reasonably expected early in 2002. The returns realised in the RSA bond and equity markets over the past 10 years have been well ahead of inflation.

And the actual inflation expected by bond and equity investors and implicit in long dated bond yields in 2002 proved to be greatly overestimated. The fact that interest rates fell over the period, so increasing the market value of any bonds held by a pension fund, added meaningfully to these bond market returns. Very long term interest rates in SA in January 2002 were 14.16%. They have more than halved since then. Actual returns on these bonds since then have averaged over 12% per annum. The return on the All Bond Index (with an average term to maturity of six years) was an average 10.13% per annum. The JSE, represented by the All Share Index, returned an average 15.5% a year while short term interest rates averaged about 8.6%. These returns were especially impressive when compared to inflation that averaged an unexpectedly low 5.9%. A balanced SA pension plan over these 11 years and four months was thus adding real purchasing power to savings at a most impressive rate – a most helpful outcome to those contributors to pension funds intending to retire today.

High real returns from the RSA bond market, combined presumably with excellent real returns from the share market, in which even a conservatively managed pension fund would have benefitted, plus good real returns from the money market, meant that the capital value of any SA pension fund should have grown rapidly enough since 2002 (after management fees) to overcome the reality of lower expected returns in 2013.

Some simulation exercises can help make the point about just how well the current cohort of those facing retirement today have been served by the exceptionally good returns provided by the SA capital markets since 2002.

For example, consider an intended retiree of 65 years today, who had a defined contribution balance of R5m in 2002 and earned a salary then of R500 000. Let us say that his salary grew at 8% a year over the period and he continued to contribute 10% of his growing salary to his pension plan. If the pension plan had a modest 50% weight in equities, 40% in bonds and 10% in cash based on realised returns since 2002, his nest egg would have grown to over R22m by April 2013. Had he not added to his savings, his wealth would have mounted to about R20m. His salary by 2013 would have grown to over R1.1m and his R22m would have bought him an inflation protected retirement income of about R792 000 a year. If he were prepared to take on inflation risk he might be able to secure an annual constant nominal income of about R1.5m for as long as he lived. His post retirement income would thus seem to bear a highly satisfactory relationship to his pre retirement income. It would not make a great deal of difference to these outcomes if part of his 2002 nest egg of R5m was in the form of equity in his own home. The return on homes in the form of implicit rental yield plus capital gains (especially until 2008) would have compared well with alternative investments.

What about the future?

It is therefore not so much the savers of the past that we should be worrying about, but the savers of the future who now have to face lower expected real returns in the market place. Their ability to build up an adequate store of purchasing power for old age is being compromised by low expected real returns. These low expected returns may well turn out to be low realised real returns, in which case a higher rate of real savings is urgently called for by all those intending to retire in 10 or more years.

The danger to investors in long dated fixed interest securities is unexpectedly higher, not unexpectedly lower interest rates. It is not lower nominal interest rates but higher rates that make it more difficult to build savings for the future, as we have shown. Lower inflation can compensate fully for lower nominal interest rates when a fixed annuity is purchased.

Lower expected real returns, all other things equal, demand a higher rate of real savings to sustain a desired rate of post retirement real purchasing power. A higher rate of real saving can be expressed as a larger percentage of nominal income contracted to a pension or retirement savings scheme. But the danger to current savers is that these real and nominal interest rates will rise over time, reducing the value of any bond portfolio. This is the opposite of the benign winds of lower interest rates that have blown over capital markets over the past 20 years.

It should therefore be appreciated that the current level of real interest rates expressed explicitly as the real return on long dated inflation linkers issued by governments is exceptionally low. Real interest rates close to zero are well below long term averages that have been of the order of two or three per cent. In normal times real interest rates can surely be expected to regress back to long term averages. If they do, does it make sense for those retiring today to commit their capital permanently to such low returns? Furthermore, those planning to retire in the next 10 or 20 years might well judge it appropriate to accept more risk in their retirement portfolios – that is the risk that real interest rates will rise as the economy grows and so the demand to invest more capital in real assets raises the competition for savings. Proportionately more equity (that promises higher returns in exchange for more risk) seems to us to be a sensible response to what may be a short lived world of very low interest rates.

Expectations of Platinum Mining in South Africa – Anchored in the False Bay

As printed in Business Day 14 May 2013 

by David Holland and Brian Kantor[1]

Behavioral studies have shown that humans exhibit a strong anchoring tendency.   When the world changes, they remain anchored to the one they know instead of adapting to the new order. Evidence for this behavior is ubiquitous when parsing through government and labour comments about the ability of mining companies to pay more or hire increased numbers of workers. This is undoubtedly a reason for delay and lack of resolution in discussions between government, organized labour and Anglo American Platinum about the company’s need to reduce costs and investment.

We would like to take a step back and assess how profitable platinum miners are, and calculate the expectations embedded in their market prices. Once we understand those expectations, we can focus on the best way forward for the business and its stakeholders.

The platinum industry has been one of great hope and now disillusionment. We aggregated the historical financial statements of the 5 largest South African platinum miners (Anglo American Platinum, Impala, Lonmin, Northam and Royal Bafokeng) and calculated the inflation-adjusted cash flow return on operating assets, CFROI, which is the real return on capital for the industry. From 1992 to 1997, platinum miners were generating an unattractive return on capital, which slumbered below the cost of capital. The years 1999 to 2002 provided the first wave of extraordinary fortune for platinum miners. The real return on capital exceeded 20%, making it one of the most profitable industries in the world at that time (the average CFROI for global industrial and service companies is 6%). The rush to mine platinum and build company strategies around this effort was on, e.g., Lonmin bet its future on platinum.

The 2nd wave of fortune occurred during the global commodities “super cycle” from 2006 to 2008. Again, platinum mining became one of the most profitable businesses in the world. The good times ended abruptly with the onset of the Great Recession in 2009, and platinum miners saw their real return on capital drop to 1% – well below the cost of capital, i.e., the return required to justify committing further capital to the industry.

Unfortunately, operating returns have not improved much and have remained below the cost of capital throughout the global slowdown due to increasing labour, electricity and excavation costs, and lower platinum prices.  By cost of capital, we mean the minimum return required of an investment in an industry with proper regard to the risks involved in its operations and financial constraints. The greater the risks, the greater the return required to sustain or expand the industry. Firms or sectors of the economy that prove unable to satisfy their cost of capital decline while firms that beat their cost of capital are strongly encouraged by shareholders and other capital providers to expand and to raise the finances necessary to do so.

The 2012 CFROI in the platinum sector of the SA economy was a miserable minus 0.6%, which is the lowest return on capital since 1992 when our calculations on realized returns in the sector begin. Suffice to say, platinum miners aren’t producing sufficient returns to satisfy shareholders or the market place to support their operations. This has resulted in unavoidable cost-cutting, lay-offs and deep cuts to capital expenditure plans. These are natural economic consequences when a business is destroying economic value by not meeting its cost of capital.

And what does the future hold?  We’ve taken analyst expectations for 2013 and 2014 and estimated the real return on capital.  It remains very poor at a value destructive level of 0% for 2013 and a depressed 3.4% until 2017.  There is no hint of a return to superior profitability in the share prices of platinum miners. The market has them valued to continue to realize a real return on capital of less than 6%, which is the average real return on capital for industrial and service firms throughout the world. As an aside, despite high gold prices, profitability for SA gold miners is no better. Their aggregate CFROI is expected to remain around a value destructive 3% for the next 5 years.

In a nutshell, South African platinum and gold miners are destroying value and are expected to continue to do so. They are in a dire economic state. To survive they have to reduce costs. Demands for wage increases that far exceed inflation are now totally unrealistic and cannot be fulfilled. These demands are anchored to a past that no longer exists. The tragedy is that for the workers who are bound to lose their jobs mining platinum, there are no forms of alternative employment that will provide them with anything like the same rewards.

All parties should focus on what is realistically possible and economically feasible. A wage freeze, reduced hours or some form of deferred pay are called for to minimize the pain. The workers and the unions already subject to retrenchment and very poor job prospects would surely be wise to focus on job retention rather than further gains in real employment benefits for those still fortunate enough to retain their jobs. Any improved employment benefits that may be extracted will go to even fewer surviving workers. There is however another way that makes much more economic sense for all stakeholders not least the government and SARS that shares fully in profits and also wages earned. Cooperation – yes, call it co-option if you like – is urgently called for.

In normal economic circumstances it is sensible for employees of a failing firm not to sacrifice current benefits to keep their employers going. Ordinarily, they can expect to find equally well-paid work with another firm in an industry willing and able to employ them. After all, skilled or even less skilled but experienced workers are a valuable scarce resource in a well functioning economy that sustains close to full employment conditions. Unfortunately, this does not describe the SA labour market with its relatively few insiders employed formally and the many others, particularly young potential workers so anxious to join them but unable to do so.

Moreover most workers prefer fixed predictable rewards to variable income. The risks of variable incomes are borne by shareholders and to a degree, managers with bonuses linked to the company’s operating performance. If a failing firm is unable to offer market related benefits to its employees or indeed its owners, then it deserves to fail and the scarce resources it was employing and in effect wasting could be transferred to other firms capable of employing resources more productively.

In the case of platinum and gold miners in South Africa, the prospect of alternative employment with anything like the same benefits is very bleak. Workers would be well advised to settle for less especially now and hope to make it up at a later stage should the prospects of the industry and its productivity improve. Deferred pay offers an inventive compromise where current pay sacrificed is exchanged for shares or even options on shares to be realized at some point in the future. It would then be in all parties’ best interest for productivity and return on capital to improve. If these cost savings were made or even expected to be realized, the shares the workers owned in the industry, exchanged for lower take home pay, would appreciate significantly. Sacrifices made now to hold on to jobs could be more than made up in the share market. And more valuable platinum and mining companies would be able to much more easily fund growth in output and employment rather than manage as best they can declining output and employment.

Unless the industry can come to deliver a cost of capital beating return, its value to all stakeholders will surely decline further and its prospects deteriorate. Perhaps even to the point where nationalizing the industry with full compensation might seem a realistic proposition. It may cost relatively little to take over a failed industry. Nationalization however will not solve the problem of poor labour relations and the decline in the productivity of both labour and capital in the industry. It would simply mean that taxpayers, rather than shareholders who will have lost so much, carry the can for the failures of management and unions that must share the blame. The government and its agencies have many alternative and much better uses for tax revenues than to subsidise the already well-paid workers in a difficult, capital-intensive industry that is likely to realize poor returns.

The unions might think correctly that management subject to the discipline of taxpayers rather than shareholders would be a softer touch. Government and its taxpayers should be very wary of signing a blank cheque. All parties need to focus on what is realistically possible and economically feasible. By taking stock of the poor economic performance of the platinum mining industry and its depressed expectations, all parties can negotiate from a shared set of financial and economic facts. These are difficult times and creative approaches are needed. All parties need to be anchored in the right bay signaled by today’s reality and expectations.


[1] David Holland is an independent consultant and senior advisor to Credit Suisse. Brian Kantor is Chief Strategist and Economist with Investec Wealth and Investment.


Listed JSE property continues to surprise. Can it continue do so?

Exceptional returns all over again.

Property stocks listed on the JSE have again confounded the market place. From the beginning of the year to 8 May 2013, the Property Loan Stock (PLS) Index returned nearly 20% compared to 5% from the All Bond Index and 4% from the JSE All Share Index.

Since 30 April 2012 the returns provided by the PLS Index in capital appreciation and dividends have been even more spectacular. The PLS Index returned over 47%, over a period when the All Share and All Bond Indexes also provided still very good total returns of 21% and 18% respectively. Between January 2000 and May 2013 The PLS Index provided average annual returns, calculated monthly, of 23.4%, compared to an average 15.5% for the All Share Index, 11.9% average from the All Bond Index and about 8.8% average returns from the money market. Annual inflation averaged about 5.8% over the period.

What has the market missed when valuing JSE listed property? Interest rates and / or property fundamentals?

The extra value attached to listed property could have come from unexpectedly good rental income and / or unexpected declines in the rates at which those rental flows are discounted. Listed property valuations have very clearly had the benefit of unexpected declines in interest rates. Less obvious may have been unexpectedly good or perhaps also unexpectedly consistent growth in rental incomes after costs. Expected dividends are not made explcit like interest rates and interest rate expectations. At best they can only be inferred from market movements themselves.

In the figure below we show how the dividends distributed by the companies represented in the PLS Index, weighted by company size, have grown over the years. Over the extended period the dividends paid have fully kept up with the Consumer Price Index (CPI). Having lagged behind the CPI between 2002 and 2004, the PLS Index’s dividends per share had caught up with inflation by 2006. Since then they have matched inflation almost perfectly. Such consistent growth in distributions, despite the global financial crisis of 2008 that had a particularly severe impact on listed property elsewhere, might well have taken investors by surprise and justified something of a rerating for the sector. However no such re-rating has occurred.

The benefits of lower interest rates for property valuations

The value of JSE listed property companies has been very clearly assisted by unexpected declines in SA interest rates. As interest rates come down, property companies benefit in two ways. Firstly, their bottom lines benefit from less interest expensed. Secondly, the discount or capitalisation rate attached to expected rental income goes down and values go up with lower interest rates.

As we show in the figure below, long term interest rates and the PLS dividend yield have declined in more or less lock step. We also show the difference between long RSA bond yields and the initial PLS dividend yield. This yield spread represents the rating of the PLS. A widening spread indicates less market approval (a de-rating) and a narrowing spread indicates a more favourable rating (a re-rating). This spread widened to the disadvantage of the property sector in 2002-03. It then narrowed significantly from a +5% spread to a -2% by 2007. Thereafter the spread widened as interest rates rose in 2008 and narrowed again in 2009. This risk spread has remained highly stable since then.

It may be concluded therefore that the sector has not improved its rating relative to long term bonds since 2009. The improved property returns since then can be attributed to interest rate movements rather than to any sense of improved property market fundamentals.

Given that PLS dividends have kept pace with inflation (and may be expected to maintain this pace), the PLS dividend yield could then be regarded as a real inflation protected yield. Thus a comparison can be made with the real, fully inflation protected yield offered by RSA inflation linkers. The yield on the R197, an inflation-linked 10 year bond, has fallen dramatically over the past 12 months. Yet the spread between the PLS dividend yield and the inflation-linked R197 has remained largely unchanged as may be seen in the figure below. This “real” spread, the extra rewards for holding listed property, has not declined in recent years. This provides further proof that higher PLS values have been driven by interest rates rather than improved sentiment. No re-rating of the PLS sector has taken place according to these metrics.

Making the case for the PLS sector at current levels and yields.

The listed property sector is highly sensitive to interest rate movements. We calculate that for every 1% move in the All Bond Index, the PLS Index can be expected to move in the order of 1.5%. We have shown that the major force acting on the PLS Index in recent years have been lower interest rates. As we have indicated, there is little sign in the market place that expectations of the property sector have become more demanding. It is lower interest rates rather than faster growth in expected rental income (and the dividends associated with better underlying economic performance) that have driven the PLS Index higher.

What then are the required returns that will drive property valuations and development activity in SA over the long run? Our sense is that that the normal risk premium for a well diversified, listed and well traded SA property portfolio should be of the order of extra 2-3% per annum over long term interest rates on RSA bonds.

If that is the case, the expected risk-adjusted return on listed property would now be of the order of 9-10% per annum, that is about 3% above the current 10 year RSA bond yield of 6.13%. The current PLS Index dividend yield is 5.2%. Expected inflation implicit in the RSA bond market is 5.56% – being the difference in the nominal yield on a generic RSA 10 year bond of 6.13% and the equivalently dated inflation-linked RSA197 that currently yields 0.57%.

Adding inflation equaling growth in PLS dividends of 5.57% to the initial PLS dividend yield of 5.2% gives us an expected return of 10.77% per annum, or a PLS risk premium of 4.64% per annum. This is a risk premium significantly higher than our estimate of a required risk premium of 2-3%. It suggests that if we are right about a normal risk premium there is still some upside for the PLS Index at current interest rates.

Subtracting the RSA inflation linked yield of 0.6% from the 5% PLS dividend yield gives us real risk premium of the same magnitude, of about 4% plus. Again this seems too generous a reward for the risks in well diversified real estate.

The fundamental case for investing in JSE listed property today is that the current risk premiums available in the market place are larger than necessary for attracting funds to the sector. Yet it should be appreciated that regardless of the long term case for investing in JSE listed real estate (that may or may not prove compelling), the short term movements in the PLS Index will be dominated by movements in interest rates. In the short, if not the long run, the property sector remains a play on the direction of interest rates, regardless of the investment fundamentals. Brian Kantor

Why a great variety of new cars on the road is good economic policy

A lead article in BD by Alexander Parker, (Friday 5 April) was introduced with the headline State-Aided car exports ‘almost 40% of trade gap’.

The article quoted Roger Pitot of the National Association of Automotive Components and Allied Manufacturers, that the motor industry’s trade deficit was R49bn “or more than 40% of the national trade deficit … by far the highest we’ve ever had”. Presumably this trade deficit is the difference between the imports of motor vehicles (fully built) and also of components of motor vehicles (to be assembled in SA) and the exports of motor vehicles and components from SA.

Fair enough – but then the article goes on to quote Gavin Maile from KPMG “… local production of vehicles for export also contributed to the trade deficit …” an observation given prominence in the headline.

(This last statement is a non sequitur. Any exports of motor vehicles from SA would reduce the trade deficit provided, which seems reasonable enough to assume, that the prices received for the the exported vehicles covered at least some of the labour, transport and rental cost etc incurred in SA assembling and/or shipping out the vehicles. This would be true even if all the components of the vehicles exported were imported. Indeed, if the fully built up vehicles were shipped to SA and then re-shipped to neighbouring countries, outside the customs union, provided there were extra rands to be earned in these operations, the SA trade deficit would decline.) Imports might go up in rand terms importing the vehicles and or their components, but if some of the imports were then re-exported exports measured in rands would go up by more than the rand cost of the imported vehicles or the components previously imported.

But these logical quibbles aside, the more important point is that there is no logical reason to expect or plan for a balance of imports and and exports in any one sector of the economy as perhaps the component producers are suggesting and would prefer. There will always be sectors of the economy that profitably export far more than they import: for example mining or farming and other sectors, such as the motor industry where the opposite applies.

We and the firms we own and work for strive to profitably produce a surplus of the services or goods that we specialise in to supply the world of consumers and users, both domestic and foreign. We then turn these sales into money for salaries and wages and rents and taxes and profits for owners who then exchange this income for all the other goods and services that are cheaper to buy in than produce ourselves. As Adam Smith explained many years ago, division of labour and the productivity gained through specilaisation is limited by the extent of the market. These benefits of trade are widened by opportunities to sell to and buy from foreign firms and households.

An economy protected against foreign competition will not only import less but also export less because it denies itself the advantages of specialisation in goods and services in which it has comparative advantages (in both the domestic and foreign markets). The notion that trading partners will willingly buy from SA firms without an equal opportunity for their firms to also sell to SA customers is clearly false. Trade is a two-way street where the traffic is best kept flowing freely in both directions.

It is possibly a moot point whether SA would have much of a domestic motor assembly, let alone a domestic motor manufacturing industry, were it not for a long history of protection offered to the domestic manufacturer and component producer. The effective protection against imports may have declined to a degree – hence the greater volume of imported vehicles. The one great advantage of the current system of incentivising exports by giving license to import, is an SA market with a great variety of vehicles (though how well prices paid on the local showroom floors compare with prices abroad is a subject of much debate).

This variety of new vehicles on offer in the domestic market – from luxury to utility – not only encourages demand for vehicles but also employment in the distribution and maintenance of these vehicles. One wonders how the numbers employed in distributing and servicing the vehicle stock compare with those employed in manufacturing vehicles and components. Less variety on offer would mean reduced demand for new vehicles and a smaller slower growing vehicle park to service and trade.

But aside from employment gains made in distributing and servicing an enhanced vehicle park, there is another very valuable benefit from having a great variety of new motor vehicles for customers to choose from. The quality of motoring experiences for many highly paid and highly skilled participants in our economy – the indispensable rain makers so to speak – ranks for them (in lifestyle) not far behind, in importance and relevance, to the quality of their homes, children’s education and medical services. Force them all to drive the equivalent of the East German Trabant or a limited selection of cars that might be produced cheaply in relatively large numbers in SA, would mean a less attractive life style for them and so effectively a still higher tax rate imposed on their incomes.

With all taxes or exactions on their standard of living, these key personnel with artificially diminished choices in vehicles or in any other goods and services they wished to spend their own incomes on, would have to be compensated with higher pre- tax incomes to help keep them in SA. Being able to exercise consumer sovereignty not only makes you free: it also makes your economy more competitive in the market for skills and so in all markets for goods and services that domestic suppliers enter.

Freedom to enjoy the full variety of goods and services on offer in the global village, especially educational, medical and motoring services (at competitive prices that only openness to imports can bring), helps hold down the cost of attracting essential skills without which no industry or economy can hope to be competitive. Adopting free trade helps supply a better quality of life, including importantly a better quality of motoring. This is sensible economic policy that pays off for all sectors of the economy, especially for those that have a comparative advantage in exporting their surplus production. Protecting the market against imported goods or services inevitably will bring lower levels of exports and a lower standard of living for all- rich and poor.

Brian Kantor

Platinum mining in SA: Anchored in the False Bay

By David Holland and Brian Kantor

Behavioural studies have shown that humans exhibit a strong anchoring tendency. When the world changes, they remain anchored to the one they know instead of adapting to the new order. Evidence for this behaviour is ubiquitous when parsing through government and labour comments about the ability of mining companies to pay more or hire increased numbers of workers. This is undoubtedly a reason for delay and lack of resolution in discussions between government, organised labour and Anglo American Platinum about the company’s need to reduce costs and investment.

We would like to take a step back and assess how profitable platinum miners are, and calculate the expectations embedded in their market prices. Once we understand those expectations, we can focus on the best way forward for the businesses and their stakeholders.

The platinum industry has been one of great hope and now disillusionment. We aggregated the historical financial statements of the five largest South African platinum miners (Anglo American Platinum, Impala, Lonmin, Northam and Royal Bafokeng) and calculated the inflation-adjusted cash flow return on operating assets, CFROI, which is the real return on capital for the industry. From 1992 to 1997, platinum miners were generating an unattractive return on capital, which slumbered below the cost of capital. The years 1999 to 2002 provided the first wave of extraordinary fortune for platinum miners. The real return on capital exceeded 20%, making it one of the most profitable industries in the world at that time (the average CFROI for global industrial and service companies is 6%). The rush to mine platinum and build company strategies around this effort was on, e.g., Lonmin bet its future on platinum.

The second wave of fortune occurred during the global commodities “super cycle” from 2006 to 2008. Again, platinum mining became one of the most profitable businesses in the world. The good times ended abruptly with the onset of the Great Recession in 2009, and platinum miners saw their real return on capital drop to 1% – well below the cost of capital, i.e., the return required to justify committing further capital to the industry.

Unfortunately, operating returns have not improved much and have remained below the cost of capital throughout the global slowdown due to increasing labour, electricity and excavation costs, and lower platinum prices. By cost of capital, we mean the minimum return required of an investment in an industry with proper regard to the risks involved in its operations and financial constraints. The greater the risks, the greater the return required to sustain or expand the industry. Firms or sectors of the economy that prove unable to satisfy their cost of capital decline while firms that beat their cost of capital are strongly encouraged by shareholders and other capital providers to expand and to raise the finances necessary to do so.

The 2012 CFROI in the platinum sector of the SA economy was a miserable minus 0.6%, which is the lowest return on capital since 1992 when our calculations on realised returns in the sector begin. Suffice to say, platinum miners aren’t producing sufficient returns to satisfy shareholders or the market place to support their operations. This has resulted in unavoidable cost-cutting, lay-offs and deep cuts to capital expenditure plans. These are natural economic consequences when a business is destroying economic value by not meeting its cost of capital.

And what does the future hold? We’ve taken analyst expectations for 2013 and 2014 and estimated the real return on capital. It remains very poor at a value destructive level of 0% for 2013 and a depressed 3.4% until 2017. There is no hint of a return to superior profitability in the share prices of platinum miners. The market has them valued to continue to realise a real return on capital of less than 6%, which is the average real return on capital for industrial and service firms throughout the world.

In a nutshell, South African platinum miners are destroying value and are expected to continue to do so. They are in a very dire economic state. To survive they have to reduce costs. Demands for wage increases that far exceed inflation are now totally unrealistic and cannot be fulfilled. These demands are anchored to a past that no longer exists. The tragedy is that for the workers who are bound to lose their jobs mining platinum, there are no forms of alternative employment that will provide them with anything like the same rewards.

All parties should focus on what is realistically possible and economically feasible. A wage freeze, reduced hours or some form of deferred pay are called for to minimise the pain. The workers and the unions already subject to retrenchment and very poor job prospects would surely be wise to focus on job retention rather than further gains in real employment benefits. Deferred pay offers the potential for an inventive compromise where pay is exchanged for share options. It would be in all parties’ best interest for productivity to improve and for the shares to appreciate.

Unless the industry can come to deliver a cost of capital beating return, its value to all stakeholders will surely decline further and its prospects deteriorate, perhaps even to the point where nationalising the industry with full compensation might seem a realistic proposition. It may cost relatively little to take over a failed industry. Nationalisation however will not solve the problem of poor labour relations and the decline in the productivity of both labour and capital in the industry. It would simply mean that taxpayers, rather than shareholders who will have lost so much, carry the can for the failures of management and unions that must share the blame. The government and its agencies have many alternative and much better uses for tax revenues than to subsidise the already well-paid workers in a difficult, capital-intensive industry that is likely to realise poor returns.

The unions might think (correctly) that management subject to the discipline of taxpayers rather than shareholders would be a softer touch. Government and its taxpayers should be very wary of signing a blank cheque. All parties need to focus on what is realistically possible and economically feasible. By taking stock of the poor economic performance of the platinum mining industry and its depressed expectations, all parties can negotiate from a shared set of financial and economic facts. These are difficult times and creative approaches are needed. All parties need to be anchored in the right bay, signaled by today’s reality and expectations.

David Holland is an independent consultant and senior advisor to Credit Suisse. Brian Kantor is Chief Strategist and Economist with Investec Wealth and Investment.

Vehicle sales: Combined impact

April proved to be a good month for SA motor plants and showrooms. 50 920 units were sold with all sales categories – from new cars sold to households to very expensive heavy vehicles sold to business (and exports too) – well up on March and on sales recorded a year before. The early Easter holidays had reduced trading days in March compared to a year before, increasing trading opportunities in April.

On a seasonally adjusted basis, unit sales were up by a solid 7 644 units in April compared to March and were nearly 20% up on April sales a year before. If we combine March and April sales, sales this year of 105 866 units were 6.7% higher than the equivalent two months in 2012. This growth in domestic sales will surely be very encouraging to the industry, especially to its manufacturing and assembly arm, accompanied as it was by very good export volumes of 22 907 units – equal to a solid 45% of domestic sales volumes.

When sales are smoothed and extrapolated using a time series forecast, sales appear to be on track for close to 700 000 units on an annual basis by this time next year. This would leave unit sales close to their record pace of late 2007.

As we show below, the industry marked time between 1990 and 2003. Sales then took off very strongly only to be much depressed in the aftermath of the global financial crisis.

This financial crisis was accompanied by a much weaker rand and significantly higher interest rates. Money market rates were over 12% in mid 2008, with overdraft and mortgage rates of the order of 15% p.a. They have come down steadily and significantly since then. As we show below, vehicle sales in SA appear highly sensitive to the level of interest rates and the associated finance costs. The money market is expecting interest rates at worst to remain at current levels for an extended period of time. Our own view is that the next move in SA interest rates will be down, not up, due to sub-par growth rates. These vehicle sales do however confirm that the economy is performing somewhat better on the demand side than the supply side.

The recent strength in the rand and the lower inflation rate this implies improves the chance of an interest rate cut. The sensitivity of vehicle sales to interest rates makes the argument for lower interest rates a still stronger one. The motor manufacturers are the the largest contributors to manufacturing activity generally. They and the economy deserve all the predictable help they can get form lower interest rates. Brian Kantor

The cash conundrum

There is far more cash out there than can be explained by National Income Estimates of Expenditure and Output. This is as true of the US as it is of SA.

A modern economy laden with old fashioned cash

A peculiar feature of the modern economy is just how much cash lies around. The demand for cash appears largely unaffected by the growing use of highly convenient alternatives to cash to pay a bill, or check out of a hotel restaurant or shop. The value of transactions processed by the banks has grown very significantly with the use of credit and debit cards. A still more important development is the use of an online transaction that transfers ownership of a bank deposit from one party to another with a few clicks on a computer.

The extraordinary demand for dollars circulating outside the US banking system has attracted renewed interest following a revised estimate of the greenbacks held outside the US. (See James Surowieki, “The Underground Recovery” in the New Yorker, 25 April and referred to by John Mauldin in his free weekly investment and economic newsletter, “Thoughts from the Frontline”, 27 April, John Mauldin. The revised estimates of off shore holdings came from Edgar Feige of the University of Wisconsin, a pioneer in the analysis of the demand for cash.)

After allowing for the 27% held offshore, this leaves about US$750bn of cash in US wallets, purses, under mattresses and in safety vaults. This is equivalent to over $2000 cash stored by every person in the US. The average American family that is hard pressed for cash at the end of every month will be surprised to know how cash flush they are presumed to be. But as with many other metrics, such averages tell us very little about the financial condition of the average family. The distribution of these extraordinary cash holdings is no doubt highly skewed to the right, with relatively few holders holding the bulk of the cash for their own good reasons.

The demand for cash and other transactions in SA

In SA a similarly extraordinary growth in the demand for cash outside the banking system has been recorded. The rapid growth in demands for cash has taken place despite the impressive advances made in the availability and use of alternatives to cash in SA, as in the US and elsewhere, with the adoption by banks of new technologies. The notes in circulation outside the banking system grew from nearly R23bn at the end of 1999 to over R81b by the end of 2012. That is at an average compound growth rate of 11.3% p.a. Adjusted for inflation the average compound rate of growth was 4.4% p.a. (See below)


According to the 2011 census there are some 15 milion households in SA. Dividing R8.1bn of cash in circulation by these 15 million households would mean that the average household in SA held on average as much as R5 400 in cash at the end of 2012. A small, fairly constant proportion of this cash will be held in neighbouring countries, especially Zimbabwe, but these demands are unlikely to account for more than 4% of the rand notes and coin currently in circulation.

In the figures below we show the strong growth in the value of electronic transactions effected by the SA Banks. Not surprisingly, given their convenience, the use of electronic fund transfers (EFTs) has grown significantly while the use of cheques has fallen away. The use of credit cards, while still relatively small, has more or less kept pace with the other forms of exchange since 2002, as we show below.

The value of purely electronic transactions facilitated by the banks grew from R155.2bn in January 2003 to R603.5bn in December 2012, that is at an average compound growth rate of approximately 13.6% p.a. This growth, while impressive, is only about 2% p.a faster than the growth in cash, despite the switch from cheques to EFTs. The average EFT processed by the banks is now about R8 583 per transaction and the average credit card transaction is of the order of R545. These average sized transactions are lower than they were in 2003 when adjusted for inflation.

The average low income SA household is too poor to hold this much cash at the expense of the inadequate food, clothes, energy or educational services they consume. And so we should conclude that the heavy lifting of cash in SA is probably not being done by the road side hawker or marginal retailer, but by more significant business enterprises and their owners.

How can we explain the demand for cash? Using cash escapes surveillance.

The question then is what is all this cash on hand being used for? Cash very obviously serves the interests of those who wish to hide their income from the tax authorities or the officials responsible for means testing welfare benefits. Using cash helps escape surveillance by government and the financial system generally. Honestly declaring extra income earned that takes welfare recipients beyond the income thresholds or tax payers into higher tax brackets can make for what are effectively very high rates of taxation of income at the margin. An extra $100 or rands of extra income earned and declared may well mean more than a hundred of sacrificed benefits or as much in taxes levied.

The currency approach to measuring informal activity

Clearly there is a lot more cash out there in use in SA and the US and in many other economies than can be explained by officially estimated incomes or expenditure, especially given the growth in the use of the alternatives to cash. The question then is just how much income and economic activity goes unrecorded when cash is exchanged for labour and goods and services? Just how much income or expenditure is going unrecorded because the transactions and the value they add are made in cash and are not reported in any reliable consistent way?

An estimate of how much activity is not recorded can be found by observation of the demand for cash itself. The essence of the approach is to attempt to explain and predict the demand for cash using incomes, prices and improvements in payments technology, measured as the value of electronic transactions processed by the banks, as explanations of the demand for cash. The observed higher demands for cash, the demands for cash that cannot be explained in this economically sensible way, then becomes a proxy for estimating the unrecorded levels of economic activity.

How much economic activity is not recorded?

The New Yorker article suggested that as much as $2 trillion worth of economic activity in the US may be going unrecorded. Given that the US GDP is officially estimated at just over $16 trillion, this would make unrecorded activity or the informal economy in the US equivalent to about 12% of the official US economy. Such an estimate is on the low side of estimates made for a number of developed economies, using a variety of methods to supplement national income estimates, including the currency demand models.

Many years ago I attempted to replicate the studies of Feige and others using SA data. In those days the SA economy and its labour market was severely infected by apartheid. In particular, the pass laws and other racially inspired laws and regulations prevented employers providing work and employees from offering their labour. These controls would have encouraged “illegal” activity and employment and the use of cash to avoid detection. My ball park estimates of unrecorded activity were equivalent to over 15% of the official economy. Or, in other words, the SA economy was then perhaps 15% larger than indicated by estimated GDP.

This approach did not find favour. The official estimates of unrecorded activity in SA to this day, officially assumed to be very largely informal retail activity, are estimated to be only about five per cent of recorded activity. This estimate is extraordinarily, perhaps unbelievably low, by international comparisons.

The incentives to use cash in the US and South Africa

For the US the major incentive to use cash may well be, as the New Yorker suggests, to avoid losing welfare benefits. In South Africa a further more important reason for using cash may be to escape not only tax or avoid the loss of welfare benefits but also and more importantly to escape the burdens of a highly regulated labour market. The incentive to use cash, rather than banks, to side step the regulations of the labour market and also by so doing to escape the supervision of the Receiver of Revenue, is surely a powerful motive for using cash.

More unrecorded activity means more unrecorded employment. If so this does not weaken the argument for a less regulated economy

If we are underestimating income and expenditure we are also underestimating actual employment. The only employment numbers we can be reasonably be sure of are the jobs offered by the formal sector. Unrecorded economic activity and unrecorded employment are therefore also matters of conjecture.

If SA has less of an employment problem than the official estimates indicate, given the unrecorded economic activity and associated employment, it still has as much of a poverty problem. The solution to SA poverty is faster growth, especially in faster growth of formal employment. But such growth in employment will not be realized or recorded unless the incentives for all businesses, especially small businesses, to operate formally are much improved.

Conclusion: Greater economic freedom for South Africa will add to incomes and employment and reduce the demands for cash and increase rather than reduce tax collected.

Encouraging formal employment and less evasion of taxation requires freer labour markets, less complicated income taxation, lower business income tax rates and much more sympathetic regulation of small businesses and their owners. Such steps might well raise more rather than reduce tax revenues as small businesses elect to operate above rather than below the radar screen. If they did so one of their attendant benefits would be access to a much more convenient payments system.

Progress in this regard may well be recognised by slower growth in the demand for and supply of cash. Unfortunately SA, with new licensing demands on all businesses that would seem to be in the interest only of the officials attempting to enforce new licensing laws, seems to be moving in the other direction. Brian Kantor