Point of View: The rationale behind wage demands

Explaining the actions of trade unions in SA. Why it is not irrational to go on strike for higher wages even when employment declines. What are the policy implications?

The season of outrageous demands for wage increases is upon us. And, more important, it is the season of wage agreements that appear to take little account of the hundreds of thousands of workers outside the mine and factory gates who would willingly accept employment for current benefits.

Even more unsettling will be the loss of jobs, as managers replace unskilled workers with machines and more skilled and experienced workers productive enough to justify their higher costs of hire. The losers will be the newly unemployed with little opportunity for alternative employment on anything like the same conditions.

How then can one make sense of this seemingly irrational behaviour by the unions making the demands? How they can not be aware, it will be asked, since their members will continue to be retrenched in large numbers. Why then do the unions do what they do? They are surely as well aware as any that higher real wages can lead to job losses in the sectors of the economy where they exercise the power to strike?

The answer must be that they are well aware of the economic circumstances and the trade off between wage gains and job losses, which they make for their own good reasons. We would suggest that, in fact, unions are not in the business of maximising employment or employment opportunities. Rather, unions are in the business of maximising the total wages paid to their members. The objective they quite rationally and self-interestedly attempt to achieve is the highest possible wage bill, not the number of wage earners or members of the union. It is the total wage bill agreed to by employers that forms the basis for collecting dues from members. Therefore (percentage) increases in employment benefits can more than compensate for fewer workers employed. And better paid members may be more willing and able to pay their dues.

It is theoretically and practically possible for the wage bill paid by firms to rise in both nominal and real terms even as employment drops away. This is precisely what has happened in the mining and other sectors of the SA economy. While employment has declined in recent years, total compensation paid to employees of all kinds has continued to increase, and so presumably have the dues paid to their unions (collected conveniently by the employers themselves).

To put these outcomes in terms familiar to the financial sector, the asset base of the unions and staff associations from which they collect their fee income, the wage bill, has continued to rise as the unemployment rate continues to remain damagingly high to the economy, but not necessarily to the unions. There is nothing ignorant or irrational in all this, just predictable self-interest at work. Such an explanation fits the facts of the economy and its labour market well.

The statistics help make the point. The SA economy may well have become less labour intensive – fewer worker hours employed per unit of GDP – but the share of total remuneration in GDP or total value added has changed very little. The wage bill (not numbers employed) has risen more or less in line with output as we show below. The share of owners and funders and rentiers in SA output peaked in 2008 (before the global financial crisis) and has been in decline since, as the share of employees, has been rising. That is despite or maybe because of slow growth that reduces the rewards for savings and the demands for labour – but not necessarily the rewards of those, the majority who hold on to their jobs.

A similar picture emerges for the mining sector. In the figures below we compare mining output in money of the day (R millions) with total compensation paid by the industry to its employees. The share of mining output accrued by employees has been rising in recent years. In other words, the unions appear to be successful if their objective is (as we infer) to increase the wage bill paid by the industry rather than the numbers employed.

While mining employment was at 2008 levels in 2013, average employment benefits per worker employed have risen consistently, at an over 11% average annual rate in money of the day terms , and equivalent to an average increase of 4.5% in real terms, using the GDP deflator to convert nominal into real growth of employment benefits or rather costs to owners. The average employee in the mining sector came with an average cost to employers of over R220 000 per employee in 2013. Not bad work if (big if) you can get it.

The data on compensation of employees supplied by Stats SA only goes back to 2005. It is however possible to view mining output and employment over a much longer period. In the figure below we graph mining output in volumes (tonnes of coal and iron ore, kilograms of gold and platinum produced) and numbers employed in mining going back to 1990. The mining work force declined dramatically in the 1990s from nearly 800 000 employees to about 400 000 by 2002, where after the number rose to over 500 000 in 2008. Volumes of mining output, having declined in the 1990s as metal prices came under pressure, increased significantly in the mid-naughties, only to fall away again after 2008. The producers of iron ore and coal produced significantly more during the commodity price super cycle that accompanied the Chinese thirst for raw materials. The big losses of output were suffered by the gold mines, as they ran out of profitable grade to extract.

But a focus on mining volumes rather than mining revenues (volumes times price) misses the driving forces in the industry. The SA mining industry had the advantage of rising prices, especially after 2000 and became significantly more profitable, profitable enough to hire more labour as well as offer significantly higher rewards to their employees between 2000 and 2008, after the savage job losses incurred in the 1990s.

A better sense of the environment for SA mines, for their owners, managers and workers can be gained from the figure below. Here we reduce mining revenues to their real equivalents by deflating current revenues by prices in general, represented by the GDP deflator, rather than by the index of the prices of the metals and minerals themselves, which rose much faster than prices in general to the advantage of the mines. Real mining revenues measured this way show a strong growth pattern until 2008 and explain the employment and wage trends much better than mining volumes that have remained almost constant over many years.

Notwithstanding a better appreciation of the SA mining environment it can still be asked about employment of workers in SA that is so desperately needed. A better understanding of the self-interested behaviour of the unions (in the quantum of dues collected) and the shareholders in mines attempting to improve returns on their capital, which have led to fewer better paid and skilled workers, should lead us to expect more of the same in the years to come. This would be a trade off of better jobs in the industry for fewer employment opportunities and more capital (robots) per unit of output.

What then can be usefully done to encourage employment in SA, especially of unskilled workers, of whom there is an abundance? The first step would be not to look to the established unions or firms as sources of employment gains. The right way to look for employment gains is to find ways to inject competition in the labour market. Competition for customers and workers and competition for work will help convert the pursuit of self-interest to better serve the broad interests of society; that is in more employment.

More competition for the established interests in the mining and every other sector of the SA (unions and firms) from labour intensive firms needs to be encouraged in every way possible. This means in practice rules and regulations that allow willing hirers and suppliers of labour to more easily agree to terms (they may well be low wage terms) without artificial barriers. These barriers to more competition in the labour market come particularly in the form of closed shop agreements that apply to all firms and workers wherever located or regulated. Less regulation and more competition is the solution to the employment problem. Higher employment benefits for the fortunate few with artificially enhanced bargaining powers will not reduce the unemployment rate any more than it has to date.

Presumably these risks of default decline as growth prospects improve. And improved growth prospects (lower risk) are well associated with higher share prices. In the figure below we show the relationship between the value of the MSCI Emerging Market Index benchmark and the JSE ALSI and the CDS risk spread over recent years. We show how the CDS spread for RSA five year US dollar-denominated debt and the JSE in US dollars have moved in consistently opposite directions.

These relationships would suggest that the threat to the JSE and the rand will not be higher rates in the US and Europe, provided they are accompanied by improved global growth prospects. The threat however to the rand, the RSA bond market and the SA economy plays might still come from SA specific factors. These include strikes, load shedding and higher short rates imposed by the Reserve Bank that prevent the SA economy from participating in a faster growing global economy. The objective of the SA economic policy makers is to avoid such pitfalls.

The SA economy in May 2015: Slow but steady forward momentum, for now

The course of the SA economy at the end of May 2015 appears largely unchanged since February. This is judged by the pace of new vehicle sales and demands for cash (adjusted for inflation) in May.

These two hard numbers, which are not dependent on surveys based on selected samples – released very soon after the economic events themselves – serve to make up our Hard Number Indicator (HNI) of the immediate state of the SA economy.

The HNI may be compared to the Reserve Bank’s Coinciding business cycle indicator, updated only to February 2015. Current readings well above 100 (2010=100) indicate that the economy has moved ahead at a more or less constant modest forward speed, and is forecast to continue to maintain this pace over the next 12 months. This impression is supported by comparison with the very similar readings taken a month before. The recent inflexion of the HNI is also supported by the Reserve Bank Indicator that has continued to point higher, at least until February 2015 the latest observation.

Unit vehicle sales, after a strong start to the year, however fell back in May 2015, especially when viewed on a seasonally adjusted basis. The trend in new vehicle sales on the local market is now pointing lower towards a pace of 45 000 units per month or an annual market of about 540 000 units in 12 months’ time.

The consolation for the automobile manufacturers and their suppliers in South Africa, the largest component of domestic manufacturing activity, facing a likely decline in sales volumes, is that exports in May rose very strongly to 33 411 units, enough to maintain very high volumes of overall activity in this important sector of the economy. Hopefully the unions will also recognise the long term benefits to them of sustained production and the export contracts that will flow from the SA plants being regarded as reliable partners in global manufacture.

A lower underlying trend in the headline inflation rate has helped support the growth in the demand for and supply of cash. But this favourable trend appears likely to be reversed in the months ahead, according to our time series based forecast. The prediction of higher inflation to come in the months ahead would be well supported by other forecasts, including those made with the Reserve Bank forecasting model. This model predicts that headline inflation, off its low base of early 2015, will breach the 6% upper band of its inflation targets in early 2016 but fall back within it later in the year.

There might be some relief that the SA economy has not slowed down faster in 2015 and has been able to sustain a modest rate of growth, equivalent to GDP growth of about 2% a year. The biggest threat to sustaining a mere 2% a year growth in output would be higher inflation itself- particularly the sort of inflation that has been inflicting the SA economy in the form of higher taxes and higher electricity prices (taxes by another name), as well as poorer harvests that push maize and food prices in SA higher. Higher prices forced by the supply side of the economy, extract from the purchasing power of households and depress the real incomes of households and the volume of spending they wish to undertake, which constitutes such a large component of total spending (over 60% of the total of spending). Without a recovery in household spending growth the economy will not grow faster than it is now doing. Businesses will only wish to add significantly more to their capacity in response to stronger demands from their ultimate customers, the household spender.

A weaker rand imposes the same risk of higher prices to come and would act as a further drain on household spending power and propensities. In the 12 months to date the rand has held its trade weighted value rather well (despite the stronger dollar) and could not be regarded as contributing to higher inflation to come. Without higher excise tax rates, on what is now a lower rand price for oil compared to a year ago, the inflation rate would have been significantly lower and so would have eliminated, at least for now, any argument for higher interest rates, given the state of demand.

The further and imminent danger to the growth prospects of the economy is the pronounced intention of the Reserve Bank to raise interest rates, apparently regardless of the state of the economy or the unpredictability of the impact of higher short rates on the exchange value of the rand and inflation. The hope for the SA economy and for a firmer rand must be an improved outlook for the global economy and especially emerging market economies that encourage flows of funds to emerging market equities and bonds that will support emerging market currencies. A stronger, not weaker, rand might then accompany a gradual normalization of global growth and global interest rates.

Until then emerging market central banks, including the SA Reserve Bank, would be wise to do nothing to harm their own growth prospects with tighter monetary policies in response to a gradual normalisation of interest rates in the developed world. The tool to help their economies adjust to possible volatility in global capital markets should be exchange rate flexibility, not higher interest rates.

Will the Reserve Bank prove data or path dependent?

The members of the Federal Open Markets Committee (FOMC), while contemplating an increase in their key Fed Funds rate from an abnormal zero per cent to a slightly less abnormal 0.25%, are at pains to emphasise that such decisions remain “data dependent”.

Most recently chair Janet Yellen indicated that if the data on the US economy confirm their forecasts of an economic recovery well under way, then interest rates in the US will rise this year – this after spending all the while since 2009 at about zero. One would hope that their counterparts on the Monetary Policy Committee (MPC) of the SA Reserve Bank remain equally data dependent.

The danger is that the MPC has become path dependent – it has signaled its firm intention to raise rates this year regardless of the state of the SA economy, the state of which (if anything) has deteriorated in recent months as household spending on goods and services has slowed down. The MPC might believe that not raising rates (independent of data) would be interpreted as being soft on inflation – a most unfortunate state of path dependence if that becomes the case. Travelling down this path to still higher short term rates would be a grave error of judgment, even if the market place regards such interest rate developments as inevitable. The MPC needs to step off this path it has mapped out for itself.

It has to be pointed out that any further increases in its repo rate have been postponed ever since June 2014, presumably because of the weak economic data. The SA inflation to date has had nothing to do with excess demand that would usually call for restraint in the form of higher borrowing costs. Spending by firms, households and recently by the government itself (practising a degree of austerity) have grown even more slowly than even energy-repressed supply. Higher observed prices have almost everything to do with higher taxes on expenditure – on petrol and diesel and on electricity charged by Eskom and municipalities – with the prospect of further increases to come. Absent of these tax events the inflation rate would have been about the three per cent rate it reached in February 2015 – between August 2014 and February 2015 the CPI itself hardly rose at all – indicating a very subdued underlying trend in inflation before higher taxes kicked in. The firm rand in a world of deflation was a very helpful contributor to these trends. Despite the strong US dollar and because of the weak euro, with the largest weight in our foreign trade, the trade weighted rand is little changed from its exchange value 12 months ago. See below, where strength is indicated by higher numbers:

These more favourable exchange rate and demand side influences on prices in general have been well reflected Producer Price Inflation, prices charged at the factory and mine gates, that was 3% in April 2015. The mines and factories are not exercising much pricing power- the markets they serve are not proving very accommodating to higher prices they are being charged for their inputs- for tax and trade union reasons. The notion that real interest rates in SA- measured conventionally and unhelpfully as the difference between overdraft rates and CPI inflation is not a burden on producers – is belied by the fact that producers are not achieving anything like average consumer price increases in the prices they are able to charge their customers. Costs may rise, including the costs of hiring labour, but profit margins may well have to give way to economic realities, as will employment opportunities- even as may be observed – in the public sector.

The Reserve Bank would have to argue that inflation in SA would have been higher and would be higher if it did not raise its rates. Their argument is that expected inflation drives prices and inflation. The evidence for such a feedback loop from inflation expected to inflation is very unconvincing. Indeed the rate of inflation expected by the bond market has remained remarkably stable around the 6% p.a rate, the upper end of the inflation target range, indicating very little change in observed inflation could have come from that constant quarter. If anything actual inflation leads inflation expected. Inflation comes down and less is expected – inflation goes up and more inflation is priced into long term interest rates- not the other way round. See below where we show inflation compensation- the difference yields on 10 year RSA’s and their inflation linked equivalentsyields over the past 12 months. Inflation compensation moved lower with less inflation and has since moved higher as it became apparent that he receiver of revenue would tax much of the gains from lower oil prices.

The Reserve Bank must argue that without its actions and narrative, inflation expected would now be higher and inflation even higher. It is impossible to refute such a counterfactual. To know what would have happened had interest rates not been raised last year and had the Reserve Bank not suggested that further rate increases were to be expected, remains an unknown. But we would argue that there is something very wrong with a narrative that suggests interest rates must rise regardless of the state of the economy, especially if it cannot be known with any degree of confidence, that higher interest rates can reliably influence the rate of inflation itself.

The link between higher interest rates and the exchange value of the rand and therefore on inflation to come, is particularly difficult to establish, given all the other influences on the rand. Especially the impact on emerging market currencies generally of a highly variable and unpredictable global taste for risk and so the flows into emerging market equities and bonds and their currencies. However it can be predicted, with a much higher degree of confidence, that higher rates will depress domestic demand and GDP growth rates. As the rating agencies constantly remind us, the biggest risk to SA and its credit rating is slow growth. Sacrificing growth for whatever reason is a risky strategy, especially if its impact on inflation is unpredictable. In fact stronger growth can lead to less inflation if growth attracts foreign capital and supports the rand. And vice versa when the prospect of slower growth drives capital away from SA and weakens the rand

The major uncertainty facing the markets in the near future will be the reaction to the Fed rate increase. The impact of this widely expected move on emerging market currencies will be very hard to predict with accuracy. In the past, rising US rates that accompanied faster US growth rates have usually had a favourable impact on emerging markets. This is because US growth implies faster global growth, from which emerging market economies and their financial markets and currencies stand to benefit. It makes little sense for the Reserve Bank to talk up local interest rates for fear that higher rates in the US will weaken the rand and cause inflation in SA to increase. Higher interest rates will do nothing to counter such a shock, should it occur.

The right policy response to any currency shock is to ignore it and allow exchange rate flexibility to help the economy recover from such a shock. Higher inflation that follows a supply side shock of the exchange rate or tax kind itself depresses domestic spending. Interest rate increases in such circumstances are not called for – despite higher inflation. This should be the Reserve Bank narrative, not its vain pursuit of inflation targets, regardless of the causes or consequences of inflation. Policy actions above all should be data dependent and not predetermined.

Point of View: A question of (investment) trusts

Understanding investment trusts and how they can add value for shareholders regardless of any apparent discount to NAV.

Remgro, through its various iterations, has proved to be one of the JSE’s great success stories. It has consistently provided its shareholders with market beating returns. Still family controlled, it has evolved from a tobacco company into a diversified conglomerate, an investment trust, controlling subsidiary companies in finance, industry and at times mining, some stock exchange listed, others unlisted. Restructuring and unbundling, including that of its interests in Richemont, have accompanied this path of impressive value creation for patient shareholders.

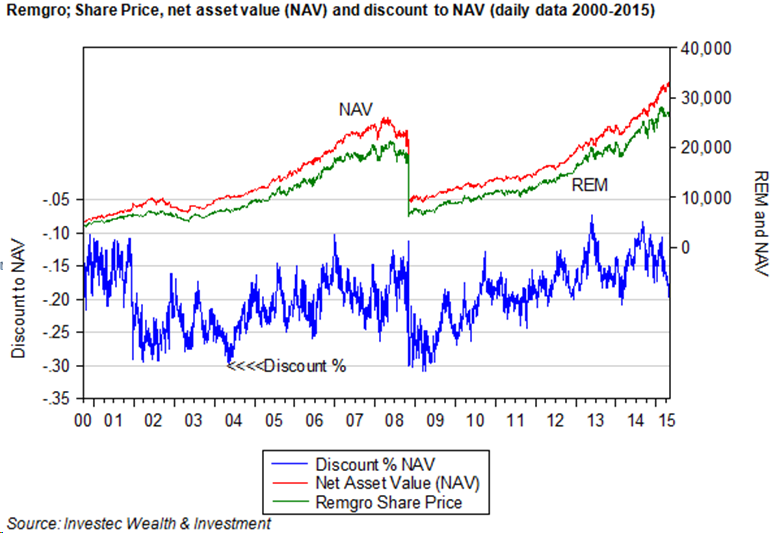
The most important recent unbundling exercise undertaken by Remgro was in 2008 when its shares in British American Tobacco (BTI), acquired earlier in exchange for its SA tobacco operations, were partly unbundled to its shareholders, accompanied by a secondary listing for BTI on the JSE. A further part of the Remgro shareholding in BTI was exchanged for shares in another JSE-listed counter and investment trust, Reinet, also under the same family control, with the intention to utilise its holding of BTI shares as currency for another diversified portfolio, with a focus on offshore opportunities. Since the BTI unbundling of 2008, Remgro has provided its shareholders with an average annual return (dividends plus capital appreciation, calculated each month) of 23%. This is well ahead of the returns provided by the JSE All Share Index, which averaged 17% p.a over the same period. Yet all the while these excellent and market beating returns were being generated, the Remgro shares are calculated to have traded at less than the value of its sum of parts, that is to say, it consistently traded at a discount to its net asset value (NAV).

The implication of this discount to NAV is that at any point in time the Remgro management could have added immediate value for its shareholders by realising its higher NAV through disposal or unbundling of its holdings. In other words, the company at any point in time would have been worth more to its shareholders broken up than maintained as a continuing operation.


pic1

How then is it possible to reconcile the fact that a share that consistently outperforms the market should be so consistently undervalued by the market? It should be appreciated that any business, including a listed holding company such as Remgro, is much more than the estimated value of its parts at any moment in time. That is to say a company is more than the value of what may be called its existing business, unless it is in the process of being unwound or liquidated. It is an ongoing enterprise with a presumably long life to come. Future business activity and decisions taken will be expected to add to the value of its current activities. For a business that invests in other businesses, value can be expected to be added or lost by decisions to invest more or less in other businesses, as well as more or less in the subsidiary companies in which the trust has an established controlling interest. The more value added to be expected from upcoming investment decisions, the higher will be the value of the holding company for any given base of listed and unlisted assets (marked to market) and the net debt that make up the calculated NAV.

Supporting this assertion is the observation that not all investment trusts sell at a discount to NAV. Some, for example the shares in Berkshire Hathaway run by the famed Warren Buffet, consistently trade at a value that exceeds its sum of parts. Brait and Rockcastle, listed on the JSE, which invest in other listed and unlisted businesses, are currently valued at a significant premium to their sum of parts. Brait currently is worth at least 45% more than its own estimate of NAV while Rockcastle, a property owning holding company offers a premium over NAV of about 70%. PSG, another investment holding company, has mostly traded at a consistently small discount to NAV but is now valued almost exactly in line with its estimated NAV.

It would appear that the market expects relatively more value add to come from the investment decisions to be made by a Brait or Rockcastle or PSG, than it does from Remgro. The current value of the shares of these holding companies has risen absolutely and relatively to NAV to reflect the market’s expectation of the high internal rate of returns expected to be realised in the future as their investment programmes are unveiled. Higher (lower) expected internal rates of return are converted through share price moves into normal risk adjusted returns. The expected outperforming businesses become relatively more expensive in the share market – perhaps thereby commanding a premium over NAV – while the expected underperformers trade at a lower share price to provide the expected normal returns, so revealing a discount to NAV.

The NAV of a holding company however is merely an estimate, subject perhaps to significant measurement errors, especially when a significant proportion of the NAV is made up of unlisted assets. Any persistent discount to NAV of the Remgro kind may reflect in part an overestimate of the value of its unlisted subsidiaries included in NAV. The NAV of a holding company is defined as the sum of the market value of its listed assets, which are known with certainty, plus the estimated market value of its unlisted assets, the values of which can only be inferred with much less certainty. The more unlisted relative to listed assets held by the holding company, the less confidence can be attached to any estimates of NAV.

The share market value of the holding company will surely be influenced by the same variables, the market value of listed assets and the estimates of the value of unlisted assets minus net debt. But there will be other additional forces influencing the market value of the holding company that will not typically be included in the calculation of NAV. As mentioned, the highly uncertain value of its future business activities will influence its current share price. These growth plans may well involve raising additional debt or equity, so adding to or reducing the value of the holding company shares, both absolutely and relative to the current explicit NAV that includes only current net debt. Other forces that could add to or reduce the value of the holding company and so influence the discount or premium, not included in NAV, are any fees paid by subsidiary companies to the head office, in excess of the costs of delivering such services to them. They would detract from the value of the holding company when the subsidiary companies are being subsidised by head office. When fees are paid by the holding company to an independent and controlling management company, this would detract from its value from shareholders, as would any guarantees provided by the holding company to the creditors of a subsidiary company. The market value of the subsidiaries would rise, given such arrangements and that of the holding company fall, so adding to any revealed discount to NAV.

It should be appreciated that in the calculation of NAV, the value of the listed assets will move continuously with their market values, as will the share price of the holding company likely to rise or fall in the same direction as that of the listed subsidiaries when they count for a large share of all assets. But not all the components of NAV will vary continuously. The net debt will be fixed for a period of time, as might the directors’ valuations of the unlisted subsidiaries. Thus the calculated NAV will tend to lag behind the market as it moves generally higher or lower and the discount or premium to NAV will then decline or fall automatically in line with market related moves that have little to do with company specifics or the actions of management. In other words, the market moves and the discount or premium automatically follows.

If this updated discount or premium can be shown to revert over time to some predictable average (which may not be the case) then it may be useful to time entry into or out of the shares of the holding company. But the direction of causation is surely from the value attached to the holding company to the discount or premium – rather than the other way round. The task for management is to influence the value of the holding company not the discount or premium.

Yet any improved prospect of a partial liquidation of holding company assets, say through an unbundling, will add to the market value of the holding company and reduce the discount. After an unbundling the market value of the holding company will decline simultaneously and then, depending on the future prospects and expectations of holding company actions, including future unbundling decisions, a discount or premium to NAV may emerge. The performance of Remgro prior to and after the BTI unbundling conformed very well to this pattern. An improvement in the value of the holding company shares and a reduction in the discount to NAV on announcement of an unbundling – a sharp reduction in the value of the holding company after the unbundling and the resumption of a large discount when the reduced Remgro emerged. See figure 1 above.

The purpose of any closed end investment trust should be the same as that of any business and that is to add value for its shareholders by generating returns in excess of its risk adjusted cost of capital. That is to say, by providing returns that exceed required returns, for similarly risky assets. Risks are reduced for shareholders through diversification as the investment trust may do. But shareholders can hold a well diversified portfolio of listed assets without assistance from the managers of an investment trust. The special benefits an investment trust can therefore hope to offer its shareholders is through identifying and nurturing smaller companies, listed and unlisted, that through the involvement of the holding company become much more valuable companies. When the nurturing process is judged to be over and the listed subsidiary is fully capable of standing on its own feet, a revealed willingness to unbundle or dispose of such interest would add value to any successful holding company.

This means the holding company or trust will actively manage a somewhat concentrated portfolio, much more concentrated than that of the average unit trust. Such opportunities to concentrate the portfolio and stay active and involved with the management of subsidiary companies may only become available with the permanent capital provided to a closed end investment trust. The successful holding company may best be regarded and behave as a listed private equity fund. True value adding active investment programmes require patience and the ability to stay invested in and involved in a subsidiary company for the long run. Unit trusts or exchange traded funds do not lend themselves to active investment or a long run buy and hold and actively managed strategy of the kind recommended by Warren Buffett. A focus on discounts to estimates of NAV, to make the case for the liquidation of the company for a short term gain, rather than a focus on the hopefully rising value of the shares in the holding company over the long term, may well confuse the investment and business case for the holding company, as it would for any private equity fund. The success of Remgro over the long run helps make the case for investment trusts as an investment vehicle. So too for Brait and PSG, which are perhaps best understood as listed private equity and highly suited to be part of a portfolio for the long run.


Appendix


A little light algebra and calculus can help clarify the issues and identify the forces driving a discount or premium to NAV


Let us therefore define the discount as follows, treating the discount as a positive number and percentage. Any premium should MV>NAV would show up as a negative number.


Disc % = (NAV-MV)/NAV ………………………………………..           1

Where NAV is Net Asset Value (sum of parts), MV is market value of listed holding company

NAV = ML+MU-NDt …………………………………………….       (2)


Where NAV is defined as the sum of the maket value of the listed assets held by the holding company. MU is the assumed market value of the unlisted assets(shares in subsidiary companies) held by the holding company and NDt is the net debt held on the books of the holding company – that is debt less cash.

Note to valuation of unlisted subsidiaries MU;

MU may be based on an estimate of the directors or as inferred by an analyst using some valuation method- perhaps by multiplying forecast earnings by a multiple taken from some like listed company with a similar risk profile to the unlisted subsidiary. Clearly this estimate is subject to much more uncertainty than the ML that will be known with complete certainty at any point in time. Thus the greater the proportion of MU on the balance sheet the less confidence can be placed on any estimate of NAV.

The market value of the holding company may be regarded as


MV=ML+MU-NDt+HO+NPV………………………………………………..(3)

That is to say all the forces acting on NAV, plus the assumed value of head office fees and subsidies (HO)activity and of likely much greater importance the assessment markets of the net present value of additional investment and capital raising activity NPV. NPV or HO may be adding to or subtracting from the market value of the holding company MV.

A further force influencing the market value of the holding company would be any liability for capital gains taxes on any realisation of assets. Unbundling would no presumably attract any capital gains for the holding company. These tax considerations are not taken up here

IF we substitute equations 2 and 3 into equation one the forces common to 2 and 3 ML,MU,NDt cancel out and we can conveniently write the Discount as the ratio


Disc= – (H0+NPV)/(ML+MU-NDt ) ………………………………………..(4)


Clearly any change that reduces the numerator (top line) or increases the denominator (bottom line) of this ratio will reduce the discount. Thus an increase in the value attached to the Head Office or the value of future business will reduce the discount. ( These forces are preceded by a negative sign in the ratio) A large increase in the value attached to investment activity will also reduce the discount and might even turn the ratio into a negative value, that is a premium. Clearly should the market value of listed or unlisted assets rise or Net Debt decline (become less negative) the denominator would attain a larger absolute number, so reducing the discount. The implication of this ratio seems very obvious. If the management of a holding company wishes to add value for shareholders in ways that will reduce any discount to NAV or realise a premium then they would need to convince the market of their ability to find and execute more value adding positive NPV projects. Turning unlisted assets into more valuable listed assets would clearly serve this purpose


Some calculus might also help to illuminate the forces at work. Differentiating the expression would indicate clearly that the discount declines for increases in H0 or NPV


That is dDisc/dNPV or dDisc/dHO= -1/(ML+MU-NDt)

This result indicates that the larger the absolute size of the holding company the more difficult it will become to move the discount through changes in the business model


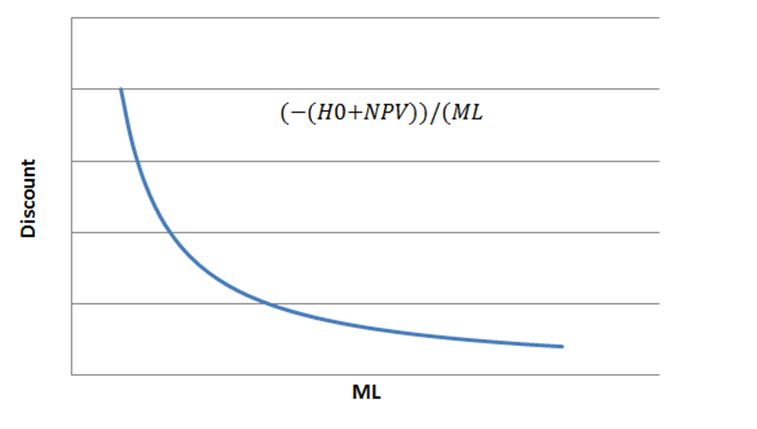
Differentiating for small changes in the variables in the denominator is a more complicated procedure but would yield the following result for dML or dMU or dDNt


For example dDisc/DML= -(H0+NPV)/(ML+MU-NDt)^2


Again it may be shown that the impact of any change in ML,MU or NDt will be influenced by the existing scale of the listed assets held ML. The larger the absolute size of ML the less sensitive the discount will be to any increase in ML. The same sensitivities would apply to changes in MU or NDT. This reaction function is illustrated below


pic12png

The future will be determined by interest rates and risk spreads

The long term interest rate front has seen some real action this month. The attack on the prevailing very low yields was led by the German Bunds. It would appear that the modestly positive GDP growth recorded in Europe in the first quarter of 2015 – hence an expected increase in demands for capital to invest – was the trigger for this move.

Europe’s GDP expanded by 0.4% from the previous quarter, or 1.6% at an annualised rate. Further encouragement was to be found in the extension of better growth rates from Germany (where the quarterly growth rate receded slightly) to Italy and France.

US Treasury Bond and RSA bond yields predictably followed the Bunds higher. We illustrate this in the chart below, where the log scale better tells the story of rising yields in proportionate terms. The 10 year Bund yield increased from very close to zero (0.14%) at the April month end to a level of 0.72% on 13 May. Over the same two week period, the yield on the 10 year US Treasury Bond rose from 2.06% at April month end to 2.27% by the close on the 13 May. The 10 year RSA yield increased from 7.85% to 7.994%, slightly lower than the 8.051% registered at the close of trade the day before.

Accordingly, the spread between US and German yields, which had widened significantly earlier in the year, has narrowed sharply, to the advantage of the euro. The greater confidence in European recovery prospects helped send euro yields higher. The somewhat mixed picture about the robustness of the US economy, accompanied as it has been by weaker than expected spending at retail level, thus implying reluctance by the Fed to raise its short rates soon, helped restrain the increase in US yields. This narrowed the spread or interest rate carry and reduced the demand for US dollars.

The evidence suggests that the wider the spread in favour of US bonds, the stronger will be the dollar. The opposite has tended to be true of the rand and other emerging market currencies. The wider the spread in favour of the RSAs, the weaker has been the rand. This interest rate spread can be regarded as the risk premium carried by SA borrowers to compensate for the expected depreciation of the rand, as well as (presumably) sovereign risks. The RSA-USA 10 year yield spread, now 5.72%, is marginally lower than it was on 30 April 2015. It has moved within a rather narrow range since 2013, recording an average daily spread of 5.34%, with a maximum of 6.17% and a minimum of 4.31%.

It can be confidently expected that RSA rates will continue to follow equivalent US rates higher or lower; and that US rates will take their lead from euro rates. However, such co-movement of long term interest rates can be modified by changes in these interest rate spreads. The spread between RSA and US rates, that is SA risk, will be influenced by simultaneous changes in the outlook for the SA economy. The better/worse are SA growth rates (for example), the more capital will flow towards or away from SA, so narrowing or widening the spread and strengthening or weakening the rand.

But the spread will depend more consistently on a day to day basis on the outlook for emerging markets generally. Capital flows into and out of these economies and capital markets will respond to the expectations of emerging market growth and its implications for earnings of companies listed on their stock markets. The JSE All Share Index, when measured in US dollars, follows the emerging market benchmark indices very closely. This is because when capital flows into or out of these markets generally, the JSE consistently attracts or gives up a small, but predictable, share of such capital flows in the same direction. For any given level of global interest rates, the more confidence there is in emerging market growth, the narrower the risk or interest rate spread against the rand is likely to be, hence the stronger the rand is likely to be and the higher will be the US dollar value of emerging markets and JSE equities and bonds.

In the chart below we show how the MSCI Emerging Market Index and the JSE All Share Index (in US dollars) behave very similarly. It also shows how the two indices have underperformed the S&P 500 over recent years as the spread between SA and US interest rates have widened. We show these same trends in 2015.

These developments raise the issue of whether rising interest rates themselves (adjusted for changes in risk spreads) represent a threat to or an opportunity for investors in emerging equity and bond markets. Past performance suggests that rising rates in the US are much more likely to be associated with relative and absolute strength in emerging markets rather than weakness. The explanation for this seems clear enough. Rising rates in the US and Europe will accompany stronger growth and an improved growth outlook. Such growth in the developed world is helpful to the growth prospects in emerging economies, for which the developed economies are important sources of demand for their exports. A rising tide in the developed world will lift all boats – including those moored in the emerging economies.

The following figure strongly suggests as much. It shows how rapidly rising interest rates in the US between 2003 and 2007 were been associated with declining risk spreads for the emerging bond markets. The lower interest rates after the financial crisis in 2008 were in turn associated with greater emerging market bond risks. These risk spreads are represented by the average of the five year credit default swap spreads over US Treasury yields for Turkey, SA, Mexico and Brazil.

Presumably these risks of default decline as growth prospects improve. And improved growth prospects (lower risk) are well associated with higher share prices. In the figure below we show the relationship between the value of the MSCI Emerging Market Index benchmark and the JSE ALSI and the CDS risk spread over recent years. We show how the CDS spread for RSA five year US dollar-denominated debt and the JSE in US dollars have moved in consistently opposite directions.

These relationships would suggest that the threat to the JSE and the rand will not be higher rates in the US and Europe, provided they are accompanied by improved global growth prospects. The threat however to the rand, the RSA bond market and the SA economy plays might still come from SA specific factors. These include strikes, load shedding and higher short rates imposed by the Reserve Bank that prevent the SA economy from participating in a faster growing global economy. The objective of the SA economic policy makers is to avoid such pitfalls.

UIF and unintended consequences

A large post Budget surprise (though no relief for the workers in the form of UIF contributions) and other unintended consequences of it.

National Treasury was faced with a problem ahead of this year’s Budget: the Road Accident Fund was running a huge deficit while the Unemployment Insurance Fund (UIF) was running as large a surplus. And so the 2015 Budget proposed to take more than R10bn from the economy through higher taxes on petrol, diesel and paraffin while giving back to employees and employers in the form of significantly lower contributions to the UIF.

But now, most unusually, the Budget was anything but the final word on the matter as it almost always is on tax matters of this large order of magnitude. The government, in its wisdom, now intends to dispose of its taxing power otherwise. Contributions to the UIF will continue as before adding an extra R15b to government revenues.

To quote the Minister of Finance Nene, as reported in the daily media, the step was taken for fear of “unintended consequences” and to allow for further consultations. What these unintended consequences may be is not indicated and clearly escaped the Treasury when it drafted its Budget, a process that presumably takes much official effort and time and many a consultation. Another of the unintended consequences of the decision to reverse course will be to undermine the value of the Budget proposals themselves – until now regarded by businesses and households affected as a done deal rather than the opening of negotiations.

Incidentally the most important item on the expenditure side of the 2015 Budget was also left unresolved by the time the Budget was presented in February – the sum of tax payers’ contributions to the employment benefits of public sector employees (of which wages and salaries, after taxes and social security and pension contributions are only the largest but seemingly most visible part to those receiving and paying for the benefits). We can only hope that the decision to take more in the UIF contributions from the lower income average SA household with members in formal employment in the private sector is unrelated to unintended further generosity to public sector employees. These public sector employment benefits already compare more than favourably to those employed in the private sector. This is especially so when the very low risks of unemployment and defined benefit pensions related to final salaries, almost only provided by the public sector, but also guaranteed by the hard pressed taxpayers, are factored into the calculation of comparative employment benefits. Little wonder then that working for the government is much the desired objective of the majority of entrants to the labour market out of the schools and universities.

But a proper think on the role of social security contributions or the so called payroll taxes in SA is called for. They play a very small role in the overall tax structure compared to tax structures in the developed world. By comparison, SA relies much more heavily on income taxes collected from companies (or rather their shareholders), than employees in the developed world. Social Security, or what may be called National Insurance Contributions, can easily amount to 15% or more of the salary bill. This helps pay for the significant benefits received from their governments by the average household in medical benefits and pensions etc.

The scope in SA for raising additional income tax from companies or individuals is clearly limited. Higher income or expenditure tax rates may well lead to lower revenues collected, which is counterproductive both from the perspective of SARS as well as highly damaging to growth in employment, output and pre tax incomes. It is also not good tax policy to tax some expenditures, for example on energy (including electricity), at much higher rates than expenditure in general. It distorts expenditure and production patterns in unhelpful ways. Taxes are ideally general and proportional, rather than specific and unequal, if economic growth is to be encouraged.

It would only be fair to the large ranks of the unemployed or the underemployed unable (because of regulation of the labour market) to gain access to formal employment, that the comparatively well paid insiders with decent jobs should pay more for what has become the privilege of formal employment. The important point about payroll taxes, such as the UIF contributions made by workers and their employers in SA, is that they largely represent a sacrifice of their wages or salaries or other employment benefits, for example contributions to medical insurance, even when the employer pays in the cash. The workers subject to a payroll tax would have very likely taken home more not only because their contributions would have been lower, but because their employers, in time, would have seen their savings as a reason for paying higher wages or providing other benefits that help retain actual and potential employees whose sought after skills may be in short supply. Payroll taxes are largely a tax on workers (not their employers – something they would be well advised to appreciate) and so they should demand that their sacrifices of take home pay are always put to good use.

The curse of scale in financial markets- and how GE is getting rid of it – to shareholder applause

There is a latter day curse victimizing financial institutions. That is to be recognized by the regulator as a “Systematically Important Financial Institution” (SIFI) In other words one regarded by the regulators as being “too-big-to-fail”. Hence the requirement by regulators of any SIFI of very strong balance sheets that ensure against failure. This translates into ample highly liquid assets on the asset side of the balance sheet that yield minimum income for the bank. Such safe assets will have to be accompanied by secure funding in the form very long dated liabilities that may be expensive to raise. It may be required that such debt be converted at very short notice- to be given by the regulator- into equity – should solvency come under serious threat. Such unfavourable terms for debt holders would add further to the cost of such funding . Furthermore short term liabilities that can be withdrawn at the whim of lenders, for example deposit liabilities,do not qualify as desirable secure forms of funding. Regulators then require of banks good cover in the form of capital and holdings of cash or near cash to be acceptable sources of bank funding. These requirements make short term deposits a much more expensive source of funding for banks.

The problem with such safe guards and fail-safes is that they must all come with reduced returns on the capital subscribed by shareholders in any SIFI. Less risk forced upon borrowers and lenders (higher costs of raising funds and lower rewards for allocating them) translates inevitably into less profitable financial businesses with diminished prospects for growth. These lesser prospects for shareholders immediately subtract from the long term value of any bank or financial business to its shareholders. Such is the curse on shareholders. It is also a curse on potential borrowers from a financial institution. It means less appetite by banks to lend even at higher charges and to much slower or negative growth in their loan portfolios.

South African banks are also having to face up to additional constraints on both sides of their balance sheets imposed by the international bank regulation convention known as Basle 3. This means significantly increased costs for banks raising funds and reduced returns on shareholder capital they risk. It must also mean both more expensive bank loans and fewer borrowers qualifying for them. It is not a formula designed to facilitate economic growth for which bank credit is an essential ingredient.

One way to break the spell over the SIFI is to reduce the scale of your financial activities – that is for a financial institution to become as systemically unimportant as possible- something shareholders will welcome and the regulators cannot easily stop, as General Electric (GE) is now in the process of doing. GE announced the disposal of USD26b of its real estate assets and property lending to the Blackstone Group and Wells Fargo last week, the first steps in winding down its Financial Division. GE’s intention is to dispose of USD200b of property and financial assets and associated liabilities under its control. GE Capital accounted for 57% of GE earnings in 2007- pre the Financial Crisis – and this contribution is planned to decline to 10% of earnings in 2018. GE has also announced that ; USD50b of the asset sale proceeds will be used to buy back shares equivalent to about 17% of its current market value while it intends to maintain its dividend –another means to return excess cash to shareholders.

The share market reacted very favourably to the news, adding nearly 14% GE’s share price and as much as USD37b dollars to its market value almost overnight. (See below) Perhaps also worth noting is that despite the recent jump, a GE share is worth but half of what it was in 2002.

Clearly exiting its SIFI status can be a market value adding move something the shareholders in SIFIs everywhere will not fail to notice. Reducing the size of GE and prospective earnings from the financial division, while releasing capital for prospectively superior returns, inside and outside GE has already added value for GE shareholders. Making the additional point, if it needs to be made, that it is not earnings per share or the growth in earnings per share that matters for shareholders, but return on capital, especially improved returns on reduced capital employed, that can add to the value of a share.

An unknown to the market is to what extent such downsizing to avoid an unwelcome, “too-big-to-fail” status, will give pause to the regulators. Or will the growth of alternatives to banks (in the form of more profitable shadow banks and other lightly regulated lenders) encourage them to further extend their regulatory reach at the further cost of shareholders and borrowers? An alternative, less regulation intensive and profit destroying approach would be to recognize the possibility of financial or business failure, of even the largest financial institutions. Such failure would have to be accompanied with severe penalties for shareholders and also debt holders of failing institutions. A credible threat of failure with its highly wealth destroying consequences for equity and debt holders will restrain risk taking in the first instance. But in the event of failure it will need well designed bankruptcy procedures, known in advance by bankers and central bankers, to limit the potential collateral damage to soundly managed competitors. The Global Financial Crisis was not only a response to excessive risk taking – encouraged it should be recognised by US government interventions in the market for mortgages. It was aggravated by the lack of clear procedures for winding down or supporting financial failures. Fixing this failure is a better approach than regulations that attempt to eliminates both the risks of failure but also and the returns and the benefits to customers that come with taking such risks. The rewards of success, because of the risk of failure is the essential raison d’etre for any business enterprise including financial businesses. Denying the trade off between risk and returns will eliminate both as well as all potential SIFIs that have so much to contribute to any successful economy .

All politics is local

The legendary former US Speaker of the House of Representatives, Tip O’Neill, coined this phrase to help concentrate the minds of his elected colleagues on the issues that really matter to their constituents. What matters most to most of us are those essential daily services supplied by local governments in South Africa that are all important to the quality of life and the value of the houses we own.

The delivery of water and electricity, the removal of waste and refuse, convenient access to local roads and public spaces as well as protection against fire, flood and local epidemics are the vital responsibilities to homeowners and citizens of South African municipalities.

The better value for the taxes and the charges levied for the service local residents receive from their local governments, the more valuable will be the land, homes and buildings they own or rent. The better the protection delivered by local governments, the lower will be the insurance premiums or the charges levied by alternative providers of security services, to the further benefit of real estate valuations. In the US towns and suburbs, we would add the responsibility exercised by local authorities for schools and local policing, the cost benefit relationship of both, that will reveal itself in property values. It is not only the households with children at local schools that have an interest in their quality. Good schools add value to all property in the neighbourhood.

The virulence as well as the pervasiveness of the service delivery protests all over SA are making the point about the importance of local governments. The failures of delivery have more to do with the lack of administrative capabilities and the focus of politicians than it has with a want of additional resources to pay for these services. These protests no doubt are focusing the government’s mind on the failures of local government and the quality of their management.

To quote the 2015 Budget Review on the issue of policies for the urban areas of SA:

“Investment to transform urban spaces

South Africa’s urban infrastructure must be renewed. Population growth places enormous pressure on ageing transport systems, roads, housing, water and other amenities. Moreover, apartheid spatial planning dominates the urban landscape. Over the next three years, government will expand investment in the urban built environment, using resources more effectively to transform human settlements, and drawing in private investment to support more dynamic and inclusive economic growth.

The 2015 Budget begins a fundamental realignment to achieve these goals. The National Treasury will work directly with municipal governments, development finance institutions and the private sector to expand investment in urban infrastructure and housing. A series of transformative projects valued at over R128 billion has been identified for potential investment in large cities, supported by a project preparation facility at the Development Bank of Southern Africa (DBSA). To broaden funding streams, city governments will focus on improving their systems for revenue collection, expenditure management and land-use zoning”.

A number of development projects in the large urban metros were identified in the Budget Review, among them to quote further:

“The Metro South East Corridor in Cape Town, where the MyCiti bus service complements the commuter rail modernisation programme. Integrated land, infrastructure and precinct development projects in Athlone, Langa, Philippi, Khayelitsha and Mitchells Plain are being prepared. These projects are being supported by upgrades to sewerage and electricity infrastructure, along with community facilities such as libraries. Alongside extensive investments to upgrade informal settlements are plans to develop 6 000 high-density social housing units in Manenberg, Hanover Park, Heideveld, Marble Flats and Langa.

Cornubia, a mixed-income commercial and residential development in eThekwini, is under construction. A total of 28 500 housing units, 18 clusters of community facilities and 2.3 million square metres of commercial floor space are planned. The city has also developed a densification plan to complement commuter rail modernisation between Umlazi and Bridge City. Private-sector contributions will amount to R15.4 billion of the total development cost of R25.8 billion. To date, 2 668 subsidised houses have been completed and 80 hectares of serviced industrial and commercial land successfully launched, with two transport interchanges under construction. It is estimated that 387 000 construction jobs will be created and 43 000 permanent jobs sustained over 15-20 years, while the city will benefit from R240 million in additional property tax contributions annually”

A large share of the taxes collected by the central government, now about a trillion rand a year, flows back to the municipalities mostly on a predetermined formula based process. As the 2015 Budget Review reports on Transfers to local government:

Over the 2015 MTEF period, R313.7 billion will be transferred directly to local government and a further R31.9 billion has been allocated to indirect grants. Direct transfers to local government in 2015/16 account for 9.1 per cent of national government’s non-interest expenditure. When indirect transfers are added to this, total spending on local government increases to 10 per cent of national non-interest expenditure.

An even bigger share (about 40% of revenue collected at the centre) flows back on a similar formula to provinces who assume responsibility for public schools and hospitals.

The City of Cape Town in its Financial Accounts to June 2013, the latest available on its web page, reports grants and subsidies from the government to the City of R5.4bn and it share of the Fuel Levy of R1.7bn. This R7.1bn represented about 26% of all revenues of R27.4bn. Of these revenues, property rates generated R5.2bn and service charges (electiricty, water, refuse etc) R13.1bn These accounts report an operational surplus of R3.44bn while net financial cash income of R592m fell short of finance cash costs of 646m by a mere 54m in 2013, reflecting very little net indebtedness.

The financial picture presented therefore is one of very robust financial health with what appears to be a lazy balance sheet – especially so when little account appears to be taken of the value of undeveloped land owned by the City – that could be brought to market with the right encouragement. And having been converted, it would thereafter provide annuity income for the City in the form of extra rates and service charges that more than cover costs, as illustrated in the case of the Cornobia project in the Durban area.

Cape Town has the balance sheet and hopefully the competence to raise abundant funds from both private lenders and the central government for expanding the infrastructure of land buildings and roads, investments that will make every economic sense for the City itself. And it would help provide access to jobs and meaningfully help relive national poverty as young work seekers in particular continue to migrate in large numbers to Cape Town, as they are also doing to Gauteng and Durban.

The encouraging feature of this new emphasis by Government on the role of municipalities in SA is the recognition of the economic importance of the major urban areas of South Africa. It is there that the economic opportunities will present themselves and so where the additional investment in houses, serviced land and the roads and transport is best made.

But an important caveat should be registered. It is easier for government agencies to deliver agendas than successful outcomes even with abundant revenues, as government failure to date has illustrated. The road to a successful urban economy has to be paved with more than good intentions. And, one may add, accompanied by a proper degree of respect for the creative powers of private developers with which the city administrators and planners should be encouraged to hold. They will have to draw on them to turn not only the city land to more productive uses, but to ensure that privately owned land and buildings can be converted to ever more productive uses. Such developments will make an essential contribution to economic growth and the relief of the scourge of SA, poverty.

Point of View: It is all about the dollar

One trusts that the foreign currency traders operating in SA closed any long positions on the US dollar or short exposures to the rand before they took off for their Easter holiday weekend. Uncle Sam did not take time off and reported on US employment as usual early on Good Friday 8h30 (14h30 SA time), New York time.

There were clearly enough traders at their computers to react instantaneously to what was an unexpectedly weak increase in jobs added. Accordingly the dollar was marked down and the rand and other emerging market currencies were marked up.

Bloomberg reports that the USD/ZAR opened that day at R11.9747, reached a low of R11.669 and closed at R11.79. At the time of writing, the rand was trading at R11.7789, about 1.97% stronger than its levels late on Thursday 2 April 2015 (See below).

The fewer than expected US jobs added suggests a less robust US recovery and therefore reason for the Fed to want to raise its lending or borrowing rates later rather than sooner. Hence the dollar became less attractive and other currencies, including the rand, more attractive. The other thought doing the rounds is that the recently strong dollar (on a trade weighted basis it has strengthened more rapidly than ever before) is itself the cause of weaker US manufacturing and other data. More goods and services imported and less exported will slow down GDP growth in the US. It will also help to stimulate growth in those economies that gain market share at the expense of US producers. The rising tide in the US, with a 20% plus share of the global economy, must help to lift all boats, as it appears to be doing for Europe, according to more encouraging economic news flow there.

While it is the Fed convention to leave the foreign exchange value of the US dollar to its own devices, the strong dollar may be said to be doing the Fed’s job for it – that is doing what higher interest rates might be required to do – that is helping prevent any unsustainable growth in economic activity. What US rate of growth would be too rapid to be sustained is a matter of conjecture and judgment for the Fed. But given the absence of inflationary pressures, nor of any extra inflation priced into long bond yields (that have been falling sharply rather than rising, the inclination of the Fed will likely be to wait and see how the US recovery unfolds and not to do anything with interest rates, that might delay or restrain, a modest rather than an obviously robust recovery.

A weaker dollar and stronger rand represents better news for the hard pressed SA economy and its consumers. It takes pressure off SA inflation and therefore off SA interest rates and borrowing costs, especially those at the longer end of the yield curve that take their cue from global interest rate trends that have been falling.
It should be clear that the upward pressure on the prices facing consumers in SA has nothing to do with their spending or borrowing plans that remain highly subdued. All the recent pressure on prices facing consumers, that further take away from the willingness of households to spend or borrow more, has come from what may be correctly described as fiscal policy. Higher prices allowed for Eskom is an alternative to government borrowing on Eskom’s behalf to keep the lights on. The higher taxes on fuel, intended to cover the massive shortfall on the Road Accident Fund and on Sanral’s budget, is a convenient alternative to more government borrowing or other tax hikes made possible by the collapse in the oil price- itself in part a reflection of the strong dollar.

Tighter fiscal policy and the stronger rand should be welcomed by a central bank wanting to defend its inflation fighting credentials. But it should be clear that any move higher on interest rates in South Africa can only weaken private spending further without having any predictable influence on the value of the rand and/or inflation generally. The reality is that the inflation outcomes in SA are largely beyond the influence of interest rates and the Reserve Bank. The value of the rand will take its cue from the dollar and the Fed and prices in SA will take their direction from prices administered by the government- that is taxes by any other name.

The Reserve Bank therefore should take a lesson from the Fed itself. And that is to focus on the state of the domestic economy over which its interest rate settings have some influence. Furthermore, it should leave the exchange value of the rand to its own devices, with due regard to the influence the exchange rate may have on the domestic economy. A weaker rand, for reasons beyond the influence of fiscal or monetary policy in SA, weakens the domestic economy, and does not justify higher interest rates. If anything, it calls for lower rather than higher interest rates. And vice versa, should and when the rand strengthens for dollar reasons. When it is all about the dollar, the focus of monetary should be on the sustainability of domestic spending not on the exchange rate.

Hard Number Index: Slow and steady growth

Updating the state of the SA economy to February 2015 with our Hard Number Index (HNI). Economic activity continues to show slow and steady growth, with no obvious speed wobble.

The two very up to date hard numbers, unit vehicle sales in SA and the value of notes in circulation, have been released for February 2015. We deflate the money series with the CPI and seasonally adjust, smooth and extrapolate both series using a time series forecasting method. Both series continue to point higher, with unit vehicle sales continuing their recovery from the blip in early 2014.

It should be recognised that new unit vehicle deliveries to the SA buyer have maintained a robust pace, comparable with peak sales of 2006-07. Much improved exports of built up vehicles have also been helpful lately to the motor assemblers and their component suppliers, who account for the largest share of all manufacturing activity. The money base, adjusted for the CPI, had declined in 2008-09 but the demand for and supply of real cash has grown consistently since in line with economic growth generally.

When both series are converted into annual growth rates, it shows that the growth cycle remains in a recovery phase but that the current growth rates are predicted to slow down in 2015. Vehicle sales may be regarded as a very good proxy for capital expenditure undertaken by households and firms, while the demand for cash supplied by the Reserve Bank on demands for notes from the banks that are having to meet their customers’ demands for cash on hand rather than a deposit in the bank. These demands reveal spending intentions by households and may be regarded as a good coinciding indicator of spending decisions.

We combine these two hard numbers, vehicle sales and notes in circulation to establish our Hard Number Index of Economic Activity in SA (HNI). As we show below, the HNI for February 2015 has held its level and is forecast to continue to do so over the next 12 months. In other words, the growth in economic activity in SA is modestly positive but is not expected to gain or lose forward momentum. The HNI may be compared in this figure to the Coincident Business Cycle Indicator of the SA Reserve Bank that was still rising in November 2014, the latest month measured. We show in the further figure that the rate of change of the HNI, what may be regarded as the second derivative of the business cycle, that the rate of change of economic activity is predicted to remain barely in positive territory. That is to say, more of the same slow growth in economic activity in SA should be expected. The catalyst that would stimulate a stronger upswing in the business cycle remains very hard to identify.

The demand for and supply of cash in the economy has proved very helpful in predicting the state of economic activity in SA over many years. We include cash in our HNI for this reason and also because data on cash in circulation is so up to date and turns what may be coincident economic action, spending and cash determined simultaneously, into a leading indicator.

It may be of interest to recognise that despite all the innovations banks have made in the electronic transfers of deposits and encouraging the use of these convenient means of payment, the importance of the ratio of cash in the economy has not declined over the years. As we show below, the cash intensity of the economy (compared to estimated retail trade volumes) appears to have risen steadily between 1980 and 2000. It then stabilised at a higher level: it declined until 2010 and now appears to be rising again.

Part of the decline in demands for notes after 2003 was from the deposit taking banks themselves. The retail banks reduced their own demands for notes when the Reserve Bank stopped accepting notes in the bank tills and ATMs as part of required cash reserves. Only reserves held as deposits with the Reserve Bank qualified thereafter. But while this influence on the demand for cash seems to have worked its way through the system in the form of a decline in the cash to retail ratio, the ratio of cash to economic activity (represented here by officially measured retail volumes) seems inexplicably high. It does suggest that the statisticians may well be underestimating retail volumes and economic activity conducted informally. The informal economy has a much higher propensity to use cash rather than electronics to close deals. Hence the particular usefulness of cash as a leading indicator because it incorporates informal unrecorded economic activity that may well contribute significantly more to the economy than is officially recognised.

Monetary policy: The big bad wolf

Published in Business Day on 11 March 2015: http://www.bdlive.co.za/opinion/2015/03/11/monetary-policy-the-big-bad-wolf

PUBLIC enemy number one for central bankers in the developed world is deflation. When the consumer price index (CPI) declines we have deflation, when it rises we have the opposite, inflation. Prices in general fall when aggregate demand in the economy exercised by households, firms and governments fails to keep up with potential supply. Prices rise when demand exceeds supply.

The economic problem in the developed world, and in much of the less developed world including SA, is too little rather than too much demand and that has called for highly unconventional monetary policy.

Central bankers, with modern Japan very much in mind where prices have been falling and economic growth has been abysmally slow since the early 1990s, are convinced that deflation depresses spending and thus serves to prevent an economy from achieving its growth potential.

They are therefore doing all they can to stimulate more spending to arrest deflation or a possible decline in average prices. What they can do to encourage reluctant spenders is to create more money and reduce interest rates. Inflation, as they used to say, was too much money chasing too few goods. Deflation may be said to be caused by the opposite — too little money chasing too many goods. Inflation calls for less demand and so less money creation. Deflation calls urgently for the opposite — more money creation to increase aggregate demand and the supply of goods and services given widespread excess capacity, including the supply of labour.

While central bankers have the power to create as much extra cash as they judge appropriate, they have had to overcome a technical problem. The extra cash intended to encourage more spending may get stuck in the banking system and, when it does, there may be no additional demand for goods and services and the extra money created (at no cost) may not encourage spending or lending and provide no relief of the unwanted deflationary pressures. The banks may hold the extra cash as additional cash reserves or use the cash to pay off loans they may have incurred previously with the central bank.

The mechanics of money creation go simply as follows: The cash the central banks create (or more specifically the financial claims they create on themselves, called deposits with the central bank) when buying securities from willing sellers in the financial markets (typically pension funds or financial institutions of one kind or another) reflects immediately as extra privately owned deposits with private banks.

In the first instance, as the proceeds of a sale of securities by a private bank customer are banked, the private bank will have raised an additional deposit liability and will receive in return an asset in the form of an additional claim on the central bank. That is, the asset to match their additional deposit liabilities will take the form of an increase in their (cash) reserves at the central bank.

Normally the banks will make every effort to convert this extra cash into a loan that earns them more interest. Such loans would then lead to more spending. Normally banks keep minimal cash reserves in excess of the regulated requirement to hold cash reserves in fractional (say, 5%) proportion to their deposit liabilities.

But ever since the global financial crisis of 2008 this has not been the case at all. The central banks, led by the US Federal Reserve, have bought trillions of dollars worth of financial securities and the private banks have added trillions of dollars to their cash reserves.

The assets of the major central banks have expanded over the years. Their extra assets have consisted of securities issued by governments, for example, in the form of mortgage backed securities issued by the government backed mortgage lending agencies Fannie Mae and Freddie Mac in the US.

It should be noted that the European Central Bank’s (ECB’s) balance sheet has been shrinking in recent years, unlike those of the other central banks. This decline in ECB assets and liabilities (mostly cash reserves of the banks) has represented additional deflationary pressure on spending in Europe. The European banks have been repaying ECB loans previously made to them and the ECB has now responded by initiating a further programme of quantitative easing (QE), that is to say security purchases, intended to inject an extra €60bn a month into the banks of Europe over the next 21 months. That is to encourage bank lending and spending to counter deflation.

The important point to note is that creating money in the form of a deposit with the central bank by buying securities in the market costs society almost nothing. Creating money that is an asset of the banks, and so an addition to the wealth of the community, does not require any sacrifice of consumption or savings, as would any other form of wealth creation. It is literally money for jam. But in normal times too much money means too much spending and inflation. Hence the political resistance in normal times to creating more money — because it normally leads to unpopular inflation.

But the times have not been normal. The extra supply of money in the developed world has been accompanied by extra demands by the banks to hold money. So too little rather than too much spending has remained the economic problem. Hence the case for creating still more money, until deflation is finally conquered as the extra supply of cash is exchanged for goods and services.

The extra liabilities issued by the central bank matching the extra assets were mostly to private banks in the form of cash balances in excess of required cash reserves. In the US the banks have received 0.25% a year on these cash reserves.

It should be noted that the US banks have begun marginally to reduce their cash reserves with the Fed and that the assets of the Fed are rising more slowly with the end of quantitative easing in October 2014. Quantitative easing ended because the recovery of the US economy is well under way and presumably does not need further encouragement in the form of further increases in the supply of cash. The banks presumably have more than enough excess cash to meet the demands of borrowers. It could be argued that at least in the case of the US — the economy is recovering — the dangers of deflation have receded and the danger of inflation taking over is judged to be absent as a result of quantitative easing.

There is very little inflation priced into the yields offered on 30-year US Treasury bonds that offer yields below 3% and less than 2% more than inflation-protected US obligations with the same duration. Japan and Europe, it may be presumed, will be doing still more quantitative easing or as much as it takes to get the banks to lend out more of their cash.

The problem of deflation is complicated by very low or even negative interest rates. Cash has one advantage over other assets. The income return on cash can only fall to zero and no further. Other assets, for example, government securities or bank deposits, may come to offer less than zero income, that is only offer negative interest rates.

The German government, for example, can now borrow for up to five years, charging rather than paying interest to its creditors. In other words, it can borrow about €105 from you and promise to pay you €3 interest and only repay you €100 in a year’s time. In other words, the transaction will have cost you €2. But this, alas for widows and orphans and all those searching for a certain interest income, may be the best risk adjusted return on offer.

If prices decline by 2% over the year, your €100 will buy you as much as €102 did a year before, so adding to your real return. But you would have done still better holding cash as €100 in cash will still be worth no less than €100 after 12 months and will also buy you more if prices on average have declined.

Hence deflation forces down interest rates and encourages the demand for cash (and safe deposit boxes in which to store cash more safely than under the mattress, though they come with a fee).

Negative deposit rates therefore discourage the demand for bank deposits as an alternative to cash and more importantly for the goods and services that may be expected to become cheaper over time. Deflation also encourages banks and other lenders to hold cash reserves rather than lend them out. Loans may not be repaid in difficult times, especially when these enormous cash reserves earn the banks a positive rate of interest from the central bank.

Hence a further reason for central banks to fight deflation (and too little rather than too much spending) by flooding the system with additional cash to the point when the supply of cash can eventually, even with very low or negative interest rates, overwhelm the demand for cash. Just keep on pumping in the liquid stuff and the dam must overflow its banks. Once again the cost of doing so is zero.

Until Europe succeeds in overcoming deflation and stagnation we can expect interest rates in there to stay low and for the euro to stay weak. The US dollar, offering higher interest rates because its economic recovery is well under way thanks to three rounds of quantitative easing, can be expected to stay strong. We may also expect deflation and low interest rates in Europe to help hold down long-term rates in the US and elsewhere as European lenders seek higher yields abroad.

The weak euro and stronger dollar (and perhaps also stronger emerging-market currencies, including the rand) may also help restrain any increase in short- and long-term interest rates globally. It may take some time before the major central banks can say with any confidence: goodbye to deflation and welcome back the old enemy, inflation.

What can stop US dollar strength?

Only a narrower interest rate spread in favour of the dollar – which widened this morning.

The ECB initiated its bond buying (QE) programme yesterday. By this morning the German 10 year Bund yields had fallen back by about 7bp to 0.3101% p.a. The 10 year US Treasury Bond yields had also declined by about 4bp to 2.19% p.a. Hence the yield spread between these government bonds widened further and (not co-incidentally) the dollar strengthened against the euro and most other currencies, including the rand, weakened.

The extra yield from the Treasuries would appear irresistible and has clearly contributed to dollar strength, as it has been doing consistently since June 2014. The scatter plot relating daily levels of the euro and the 10 year spread tells the story since January 2014. The negative correlation between these two series on a daily basis is a negative (-0.81) over the period. Spread wider means dollar stronger (and vice versa) would seem a very good bet for now.

What then could cause the spread to narrow and take some of the gloss off the rampant dollar? A recovery in the euro economy would lead to higher yields there. More likely sooner are higher yields in the US, especially at the short end of the yield curve, as the Fed responds to the clear signs of a good economic recovery under way. But the strong dollar itself will add to deflationary pressures in the US as the dollar prices of metals and minerals and commodities recede further, adding to deflationary pressures in the US. Exporters to the US, receiving more local currency for their sales, may well be inclined to offer their goods at lower dollar prices. These deflationary trends may well give pause to the Fed. After all, if inflation and inflationary expectations remain highly subdued why should the FED wish to slow down the economy?

In this way, higher interest rates in Europe and a slower route to what might eventually become more normalised rates in the US, may well reduce the attractions of the US dollar. Until then, the attractions of a wide spread in favour of US dollar determined interest rates is very likely to support the dollar against the euro and perhaps also to add further dollar strength and other currency weakness. Living with a strong dollar rather than trying to compete with it with higher local interest rates, which will slow down other economies, would seem to be the way for monetary policy to go, including in SA.

All about risk and return

Risk and expected returns: The inevitable trade off and how to improve it to the advantage of the SA economy.

Equities are more risky than fixed interest (bonds) and bonds are more risky than cash. Hence equities must be expected to return more than bonds and cash, as compensation for investors willing to bear the extra risk associated with shares. The risk we bear when owning different assets is that we cannot be sure what they will be worth in the future when we might be forced to cash in – the next day, month, year or even, in the case of active traders, in twenty minutes’ time. Hence the more risk, the lower will be the prices attached to assets so that expected returns improve.

Past performance of SA assets provides very strong support for the theory that more risk is accompanied by higher returns. Shares in general have returned significantly more than bonds or cash (in the form of capital gains and dividends or interest received over successive 12 month periods) for SA wealth owners since 2000. But these higher returns have come with significantly more risk, as measured by the movements around the average 12 month returns, calculated monthly. The JSE All Share Index returned an average 16.12% over this period, with a Standard Deviation (SD) about this average of 17.8% p.a. In the worst month for shareholders over this period, February 2009, the 12 month returns on the JSE were a negative 43% while in April 2006 shareholders were up 54% on a year before. The bond market returned an average 11.3% over the same period, with a much lower SD of 6.7% and a worst month, April 2014, when the All Bond Index (ALBI) returned a negative 3.1% over the previous 12 months. The best month for the ALBI was the 27% annual return realized in June 2001. Cash on average returned approximately 8.2% p.a between January 2000 and 2015 with a SD of 2% p.a.

Since inflation averaged 5.9% p.a over the period, all asset classes have provided very good real returns, higher on average than could have realistically been expected back then and more than could be expected over the next 10 years. Such excellent returns, if they are to be repeated, would have to be accompanied by excellent management of the capital invested by SA listed companies and a lower SA risk premium demanded by foreign investors. It was this potent mixture of good management and less risk priced into the JSE share and bond markets that delivered such excellent past performance.

The more the cash in value of any asset varies from day to day, the more uncertainty about their cash in value and so the more risky this asset. In the figure below we show the daily percentage move in the JSE All Share Index and the S&P 500 Index. The price of any individual share included in this index is likely to be more variable in both directions than that of the average share represented by the Index.

This day to day volatility can be measured as a rolling 30 day average SD of these price moves. It will also be reflected in the cost of an option on the Index. The more volatile the market is expected to become, the more expensive it will be for investors to insure against such volatility by buying or selling an option to buy or sell the Index at an agreed, predetermined value. The cost of such an option on the S&P 500 is indicated by the Volatility Index (the VIX) traded in Chicago sometimes described as the fear index. The higher the value of the VIX, higher the cost of an option on the market and the more the fear. The VIX may be regarded as a forward looking measure of expected volatility and the rolling SD as a record of past volatility. Yet past volatility appears to strongly influence expected volatility as we show in the figures below. We also include in the figure the rolling SD of the euro/US dollar exchange rate. It should be noted that volatility appears to revert back to some long term average of about 12. It spiked up dramatically during the global financial crisis in 2008. It also spiked during the various phases of the European debt crisis of 2010 and 2011. Volatility in the share markets now appears as close to average. The VIX had a value of about 14 yesterday. See the figure below.

We provide a close up of recent daily volatility in a further figure below. Volatility moved higher in late 2014 and early 2015. In the share market, volatility has moved back to the long run average very recently while volatility in the key foreign exchange market, the euro/US dollar rate, volatility has moved in the opposite, higher direction.

The relationship between volatility or risk of holding a share and its price, that is the return realised for the owner, is almost perfectly negatively correlated. So if volatility rises, share prices will move in the opposite direction in a highly predictable way. The figures below for the S&P 500 illustrate this. The correlation between daily percentage changes in the VIX and the S&P 500 is a negative 0.84 for daily closing prices since January 2014. The negative relationship between the recent decline in volatility on the value of the S&P 500 Index (volatility up, share prices down), is also illustrated.

Correlation does not however mean causation. The cause of share price or exchange rate volatility is in the degrees of uncertainty felt by investors about what the future may hold for the economy and for the companies and currency traders that are influenced by by these economic developments. If the world could be predicted with certainty, there would be no reason for prices to change; no reason for investors to change their mind about future prospects and so to force prices lower or higher to reflect their less or more optimism about future prospects. For every buyer who must think prices will rise in the future to provide attractive returns, a profit seeker willing to bid up an asset price, there will be a seller (a profit taker) who thinks the prices or the market in general will move in the opposite direction. The more uncertain the future appears, the more they will tend to disagree and the more prices will move widely in both directions from day to day to reflect their differences of opinion until something like greater calm in the markets resumes. This degree of movement in both directions, up then down, down then up, is what makes for volatility. The random price walk that always characterises asset price movements over time s can become abecome a wider or narrower path as prices fluctuate one with wider or lesser changes in both directions over time, as has been illustrated above.

ByG greater calm in the market place is characterized by smaller swings in prices from day to day or even within a trading day resulting in smaller moves, implies one associates with a higher degree of consensus about the state of the world and so the less reason incentive for market participants to push prices more sharply in one and the other direction, when markets are highly liquid and attract many buyers and sellersMore volatile markets, that is wider price swings in both directions, imply a higher degree of dissonance about future prospects.. Changes in market prices Volatility reflects essential disagreement between market participants about the state of the world and the prospects for companies. And prices fall as volatility rises in order to provide investors in general with higher expected returns to compensate for these greater perceived risks.

Thus it might help market participants trying to time correctly their entry into or exit from the market to ask a different question – not where the market is going, but rather where will volatility be going, that is will the world become more or less risky? That is because if it does become more or less risky as prices fluctuate over a wider range, the value of relatively risky assets (perhaps all assets other than the true safe havens – perhaps only US Treasury Bills and Bonds) will move in the opposite direction. Or in other words, the question to ask is not what is the likely outlook for the economy etc. but rather, what is the outlook for the economy and for listed companies, currencies and almost all bonds?

Another way of putting it is to ask whether market views will have reason to become more or less diverse. Will events evolve that become more or less easy for market participants to interpret? Will it become easier to solve the known unknowns that investors recognise as consistently driving valuations? A global financial crisis is a very unusual event, the outcomes from which were extremely difficult to agree about – hence the volatility in 2008 and 2009. A Eurozone debt crisis raises uncertainty about how it will all work out for share prices interest rand exchange rates – as would any breakup of the Eurozone system, another first time possibility for which history supplies little guidance..

Hence the obligation for policy makers to act as predictably as possible. Certainty in economic policy reduces risks for investors and helps raise values. Less risk means higher asset prices and lower expected returns. If SA wishes to attract foreign and domestic capital on superior terms, the aim should be to reduce the high risk premium attached to incomes dependent on the SA economy. High returns of the kind earned by investors in SA assets since 2000 might well be realized, should the SA risk premium come down rather than go up over the next few years. The SA government could do a much better job than it has been doing to introduce certainty in its economic policies and, as important, certainty that the right income enhancing policies are being adopted.

Point of View: Less obvious than they seem

Lower average inflation in SA is surely welcome – but will it make doing business or consumption less risky? The benefits of lower inflation in SA may well be less obvious than they seem.

The average price that SA consumers paid for goods and services actually fell by 0.2% in January. The Consumer Price Index (CPI) measured 110.8 in January compared to a level of 111 reached in December 2014 (based on December 2012 = 100). The CPI first reached the level of 111 in August 2014 and is now lower than it was five months ago. Thus headline inflation, calculated as the year on year change in the CPI, has fallen away sharply and, if present trends in the CPI were to continue (which is unlikely) , inflation in a year would be below 2%.

The CPI is but an indicator of the average prices paid by the average SA household for a fixed representative basket of goods, as pre-determined by Stats SA based on its surveys of household spending patterns. As we are all well aware, any average can hide a large dispersion about the mean. The old saw about feet in the fridge and head in the oven yielding a moderate average bodily temperature makes the point. Some of the goods and services included in the CPI may be rising at a much faster rate than others – some important items may even be falling, helping to reduce the CPI and the average inflation rate. This has been the case over the past 12 months.

The different components of the household budget have realised very different inflation rates. The average price increased by 4.4% since January 2014. Food and non-alcoholic beverages, with a large weight in the average budget of 15.41%, rose by an above average 6.5% over the past 12 months. Inside the food trolley, dairy products, milk, eggs and cheese rose by as much as 12.1% year on year. The goods helping to hold down average inflation in 2014 were petrol, with a 5.6% weight, was down 17.6% over the 12 months, while the prices of so called private transport, with a weight of 7.25%, fell by 13%. Telecommunication equipment, presumably high quality or computer power adjusted, was estimated to have fallen by 12.1% in 12 months.

While the quality adjusted prices charged for cell phones and the like may well fall further, the chances of fuel prices declining further seems remote – since even if the rand price of a barrel of oil were to decline further, National Treasury is bound to levy a higher excise tax on petrol and diesel.

Clearly the all important relative prices – the price of food relative to the price of transport – changed quite dramatically and can be expected to continue to do so. Businesses have to be constantly aware of the changing relationship between the prices of the goods and services they buy, including labour services, and the prices they are able to charge in their market places and adjust accordingly.

Presumably households consume more of the relatively cheaper goods and less of the more expensive stuff. They may well trade down – that is sacrifice quality for price as goods or services become relatively more expensive. Stats SA only periodically (every five years or so) adjusts its CPI trolley of goods and services for such shifts – that may be influenced by price as well as by innovations on the supply side of the economy.

Another way of measuring prices is through the use of deflators, as used in the National Income Accounts to convert the value added in money of the day prices to their real equivalent. A deflator takes current consumption or expenditure patterns and converts them into their constant price equivalents. In other words, it calculates what the goods and services bought today would have cost in some base year. Changes in this deflator then offer an alternative view of inflation.

A comparison between the Household Consumption Goods Deflator and the CPI, based on 2010 prices as well as the respective inflation rates, is shown below. The trends are similar but not identical.

Using the deflators can demonstrate just how much relative prices have changed in SA over the years. Deflators are available for a large number of items included in total household consumption. The deflators for the main categories – household spending; non-durable goods, mainly food and beverages; semi durables, mainly clothes and footwear; durables, namely vehicles, furniture and appliances; and household services, utilities, restaurants, entertainment and domestic service – are shown below and are based on 1990 prices for purposes of comparison. As may be seen, the prices of food and services have increased at a much faster rate than the prices of semi-durable and durable consumer goods. Food prices have increased by over seven times since 1990 and clothes and footwear by only two times, with services increasing at almost the same rate as non-durables. We also demonstrate how much more relatively expensive food and services have become.

A large part of the theoretical case made for low rates of inflation is that low inflation helps stabilise relative prices. Such greater certainty about relative prices – or the relationship between the prices of the goods and services we sell and those we buy – would be helpful to producers and consumers. It would help to reduce uncertainty about relative prices and so reduce the risks of undertaking consumption and production over time, which would thus be to the advantage of economic growth.

Unfortunately there is no evidence that lower consumer goods inflation in SA has in any way reduced the dispersion of the prices of goods and services consumed by households about their average. According to the deflators, the rates of inflation of the many goods and services consumed by households differ now by as much as they ever have, as we show below.

The benefits of lower inflation in SA may well be less obvious than they seem. Lower inflation does not appear to have reduced the risks in consumption and production. Relative prices remain as variable as ever. Nor does it appear to have stabilised interest rates after inflation or the rand exchange rate (once adjusted for differences in inflation between SA and our trading partners).

Interest rates: A play on the rates

The JSE as a play on interest rates. The scope for still lower long term interest rates in SA

The importance of movements in interest rates for share prices over the past 12 months has never been more obvious on the JSE. Interest rates turned out to be significantly lower than expected early in 2014 and a group of large cap interest rate sensitive stocks, banks, retailers and property companies, have accordingly performed outstandingly well.

Since 1 February 2014 to 30 January 2015 our market cap weighted Index of large cap interest rate sensitive stocks generated a total return (including dividends) of 48.7%. The Global Consumer Play Index, also market weighted and one that includes Naspers and Aspen, while also performing well returned a lesser 42.9% while the JSE All Share returned 16.8%. The S&P 500, the best performer of the developed equity markets provided a 12 month return in rands of 19.6%, a highly satisfactory outcome, but less than half the return provided by the SA interest rate plays, as may be seen below.

(The index of Interest Rate Plays is made up of the following 30 companies: BGA, FSR, GRT, INL, INP, IPL, MSM, NED, RMH, SBK, TRU, CCO, CLS, CPI, FPT, HYP, NEP, PIK, RDF, RES, TFG, WBO, MPC, WHL, CPF, ATT, PSG, RPL, AEG and FFA. The Global Consumer Plays are: APN, BTI, CFR, MDC, MTN, NPN, SAB, SHF, NTC and ITU)

These interest rate sensitive stocks on the JSE should be regarded as demandingly valued by the standards of the recent past. They were priced at January month end at a well above average 16.9 times trailing earnings. They surely have benefitted from unexpectedly lower interest rates.

Presumably these interest rate sensitive stocks will remain so, making the further direction of interest rates in SA of great importance in stock selection and asset allocation. Long term interest rates in SA will moreover continue to take direction from interest rates in the US and Europe. Furthermore the value of the rand is bound to be strongly influenced by the self same interest rate trends.

When interest rates in the developed financial markets decline, all things remaining the same, especially country specific risk factors, funds will tend to flow towards less developed markets where yields are higher. The search for yield in a low interest rate world will tend to compress yields and yield spreads everywhere, so adding to the demand for emerging market currencies that supports exchange rates, including the rand. And where the rand goes will influence the outlook for inflation in SA and so the direction of short term rates. Over the past year lower euro yields have been very strongly associated with a stronger rand vs the euro, as well as a weaker euro and rand vs the US dollar. A weaker euro, both against the US dollar and the rand, has come with additional demands  for and lower yields on RSA long dated government bonds.

The wider spread between US and German yields shown in figure 1 has clearly helped to add to US dollar strength and can be expected to continue to do so.

Given the freedom to move capital from one market to another, it is clear that interest rates in Europe must influence rates in the US and vice versa – rates in the US must influence rates in Europe as well as SA and elsewhere. It seems as clear that, were it not for the weakness of the Eurozone economies and the threat of deflation there, as well as the promise of European Central Bank (ECB) quantitative easing on a large scale (and so very low Eurozone interest rates), long term interest rates in the US would have been a lot higher than they now are. The leading force in the longer end of the global bond market may well be European deflation rather than US economic growth and the reactions of the US Fed. The US economy seems firmly set on a good growth path. The impressive growth in the numbers of workers employed in the US is ample testimony to the strength of the US economy. The latest employment numbers have been revised sharply higher for 2014, when an extra 3.04 million employees were added to private payrolls. The response of long term US interest rates to these bullish developments has been quite muted.

These employment numbers may well encourage the US Fed in June to raise its own key short term Fed Funds rate from its current zero level, as is now widely anticipated in the money market. But longer term rates may still take their cue from rates in Europe and stay where they are, with 10 year Treasury yields staying closer to the current 2% level than the 3% level, which might be regarded as more normal. In such a case, long term interest rates in SA will also not move sharply higher any time soon. If however rates in Europe trend still lower under pressure from aggressive QE interest rates in Europe, the US and SA can still surprise on the downside. A stronger dollar would press on both US inflation and growth rates and weaken the case for higher short term rates.

While the level of RSA rates will respond to the directions of global markets it may be asked what should be regarded as the normal level of interest rates in SA? The Reserve Bank has spoken of the normalisation of SA interest rates, implying higher rates should be expected, though in its latest Monetary Policy Statement it referred to a likely pause in rates given the much improved inflation outlook. Normal must refer to rates after inflation or, when longer rates are interpreted, it would be by reference to market rates after expected inflation, that is to say real rates.

In figure 7 below we compare RSA 10 year nominal bond yields with their inflation protected alternative yield since 2005. Nominal RSA Yields have a daily average of 8.13% p.a since 2005 with a high of 10.9 % p.a. in August 2008 – and a low of 6.13 in May 2013. Inflation protected real yields averaged 2.4% p.a with a high of 3.65% p.a and a temporary low of 0.38% p.a. in May 2013. The daily volatility of both these yield series, measured by the Standard Deviation (SD) of the daily yields about the average, was about the same, 0.69% p.a.

The difference in these yields, nominal and real, may be regarded as compensation for bearing the inflation risk in vanilla bonds in the form of higher yields, has averaged 5.8% p.a with a SD of 0.61% p.a. Inflation expectations revealed by the RSA bond market appear as highly stable about the 6% p.a level, which is the upper end of the Reserve Bank’s target range for inflation. Headline inflation in SA calculated monthly has not co-incidentally averaged 6.1% since January 2005. Thus normal long bond yields might be regarded as 6% for inflation plus 2.5% p.a as a real return, summing up to approximately 8.5% p.a yield on a long dated RSA bond.

The evidence is that inflation compensation in the bond market follows the inflation trends with a long lag. It will take a sustained period of well below average 6% inflation to reduce the expected inflation priced into nominal bond yields of about 6% p.a. It will take faster growth in SA and globally to raise inflation linked 10 year real interest rates in SA meaningfully above their current 1.72% p.a. This seems an unlikely development in the short term. The equivalent 10 year real inflation protected (TIPS) yield in the US is only 0.28%, offering investors in inflation linked RSAs a real yield spread of 1.5% p.a. This real spread appears rather attractive in current global circumstances and may well decline. This real spread can be compared to a nominal yield spread of 5.44% p.a. in favour of 10 year RSAs on 9 February 2015 (that is the RSA at 7.38% – US Treasury at 1.94% = 5.44%, which is very much in line with the trends in this spread since 2008).

The case for JSE listed interest rate sensitive stocks at current demanding valuations could be based on the prospect of a further decline in SA interest rates. In the first instance this is on US rates rising less than the currently modest 20bps expected by the US Treasury bond market in a year’s time. The market is expecting the 10 year US Treasury Yield to rise from the current 2% p.a to approximately 2.2% p.a in a year. This expected increase should not be regarded as a grave threat to the SA bond market. It could take lower rates in Europe to deny such expectations or any softer actions or words from the US Fed regarding its Fed Funds rate.

The other hope for interest rate sensitive stocks on the JSE would be a decline in the RSA real rate, which appears quite high, compared to real rates elsewhere. A modest decline in the real rate would help depress nominal rates. A more likely, but more and more potentially significant decline in RSA bond yields could follow any decline in inflation expected. This could occur if SA headline inflation stays well below the 6% mark for an extended period of time. Clearly, with interest rates and the valuations of interest rate sensitive stocks where they are, there are upside as well as downside risks to interest rates in SA and to SA interest rate sensitive JSE listed companies.

Hard Number Index: Picking Up Momentum

A dispatch from the economic front: vehicle sales and supplies of cash are picking up momentum

Sales of new vehicles by SA dealers in January 2015 some 52306 units of all sizes were good enough to keep the new vehicle sales cycle on a recovery path that began in mid year. If recent trends are sustained, the network is on track to sell over 700 000 new units in 2015, close to the record levels achieved in 2006.

We combine this statistic with another very up to date hard number, notes issued by the Reserve Bank in January 2015, to establish our Hard Number Index (HNI) of the state of the economy. The HNI for January 2015 indicates that economic activity in SA continues to grow at a modest pace.

Furthermore the pace of activity that appeared to be slowing down in mid-year has gained some momentum and is forecast to sustain this rate of growth in 2015. The HNI may be compared to the coinciding business cycle indicator of the SA Reserve Bank. This economic activity indicator, based on a much larger set of mostly sample surveys (not actual hard numbers) is also pointing higher, suggesting a pickup in growth rates, but is only updated to October 2014. It should be noted that the turning points of the HNI and the Reserve Bank indicator were very well synchronised when the economy first began to recover from the post Global Financial Crisis recession, in 2009.

In the figure below we track the two separate growth cycles, unit vehicle sales and demands and supplies of real cash – the note issue – deflated by the CPI. Both series are pointing higher. This upward momentum will be sustained by less inflation to come and the relief lower rates of inflation provide for interest rates. The lower inflation might, in due course, possibly only in 2016, mean lower (not higher) costs of financing vehicles and will help the vehicle market and the economy generally.

Monetary policy: The big bad wolf

Deflation is the big bad wolf threatening monetary policy. The logic of QE

Public enemy number one for central bankers in the developed world is deflation. When the CPI declines we have deflation, when it rises we have the opposite, inflation. Prices in general fall, when aggregate demand in the economy exercised by households, firms and governments, fails to keep up with potential supply. Prices rise when demand exceeds supply in general. The economic problem in the developed world and in much of the less developed world (including SA) is too little rather than too much demand that has called for highly unconventional monetary policy.

These central bankers, with modern Japan very much in mind where prices have been falling and economic growth abysmally slow since the early nineties, are convinced that deflation depresses spending and by so doing serves to prevent an economy from achieving its growth potential.

They are therefore doing all they can to stimulate more spending to arrest deflation or a possible decline in average prices. What they can do to encourage reluctant spenders is to create more money and reduce interest rates. Inflation, as they used to say, was too much money chasing too few goods. Deflation may be said to be caused by the opposite – too little money chasing too many goods. Inflation calls for less demand and so less money creation. Deflation calls urgently for the opposite – more money creation.

But while these central bankers have the power to create as much extra cash as they judge appropriate they have had to overcome a technical problem. The extra cash intended to encourage more spending may get stuck in the banking system. And when it does there may be no additional demand for goods and services and the extra money created (at no cost) may not encourage spending or lending and provide no relief of the unwanted deflationary pressures. The banks may hold the extra cash as additional cash reserves or use the cash to pay off loans they may have incurred previously with the central bank.

The mechanics of money creation go simply as follows. The cash the central banks create (or more specifically the financial claims they create on themselves called deposits with the central bank) when buying securities from willing sellers in the financial markets (typically pension funds or financial institutions of one kind or another) reflects immediately as extra privately owned deposits with private banks. In the first instance, as the proceeds of a sale of securities by a private bank customer are banked, the private bank will have raised an additional deposit liability and will receive in return an asset in the form of additional claim on the central bank. That is, the asset to match their additional deposit liabilities will take the form of an increase in their (cash) reserves at the central bank. Normally the banks will make every effort to convert this extra cash into a loan that earns them more interest. Such loans would then lead to more spending. Normally banks keep minimal cash reserves in excess of the regulated requirement to hold cash reserves in fractional (say 5%) proportion to their deposit liabilities.

But ever since the Global Financial Crisis of 2008 this has not been the case at all. The central banks, led by the US Federal Reserve Bank, have bought trillions of dollars worth of financial securities and the private banks have added trillions of dollars to their cash reserves. In the figure below we show how the assets of the major central banks have expanded over the years. Their extra assets have consisted of securities issued by governments of government agencies- for example in the form of mortgage backed securities issued by government backed mortage lending agencies Fannie Mae and Freddie Mac in the US.

It should be noted that the ECB balance sheet has been shrinking in recent years, unlike those of the other central banks. This decline in ECB assets and liabilities (mostly cash reserves of the banks) has represented additional deflationary pressure on spending in Europe. The European banks have been repaying ECB loans previously made to them and the ECB has now responded by initiating a further programme of QE, that is to say security purchases, intended to inject an extra EUR60bn a month into the banks of Europe over the next 21 months. That is to encourage bank lending and spending to counter deflation.

The important point to note is that creating money in the form of a deposit with the central bank by buying securities in the market costs society almost nothing. Creating money that is an asset of the banks and an addition to the wealth of the community does not require any sacrifice of consumption or savings, as would any other form of wealth creation. It is literally money for nothing. But in normal times too much money means too much spending and inflation. Hence the resistance in normal times to creating money – because it normally leads to inflation.

But the times have not been normal. The extra supplies of money have been accompanied by extra demands by the banks to hold money and too little rather than too much spending has remained the economic problem. Hence the case for creating still more money until deflation is conquered and central banks can get back to worrying about too much money and inflation.

The extra liabilities issued by the central bank matching the extra assets were mostly to private banks in the form of cash balances in excess of required cash reserves. In the US the banks have received 0.25% p.a on these cash reserves.

It should be notie that the US banks have begun marginally to reduce their cash reserves with the Fed and that the assets of the Fed are rising more slowly with the end of QE in October 2014. QE ended because the recovery of the US economy is well under way and presumably does not need further encouragement in the form of further increases in the supply of cash. The banks presumably have more than enough excess cash to meet the demands of borrowers from banks. It could be argued that QE at least in the case of the US – the economy is recovering – the dangers of deflation have receded and the danger of inflation taking over is judged to be absent.

There is very little inflation priced into the yields offered on 30 year US Treasury Bonds that offer yields below 3% and less than 2% more than inflation protected US obligations with the same duration. Japan and Europe, it may be presumed, will be doing still more QE or as much as it takes to get the banks to lend out more of their cash.

The problem of deflation is complicated by very low or even negative interest rates. Cash has one advantage over other assets. The income return on cash can only fall to zero. Other assets, for example government securities or bank deposits, may only offer negative interest rates. The German government, for example, can now borrow for up to 10 years, charging rather than paying interest. In other words, it can take about 105 euros from you and promise to pay you 3 euros interest and repay you 100 euros in a year’s time. In other words the transaction will have cost you 2 euros and this, alas, is the best risk adjusted return you can get, though, if prices in general decline by 2% over the year, your 100 euros will be worth as much as 102 a year before adding to your real return. But you would have done better holding cash. 100 euros in cash will still be worth 100 after 12 months and will also buy you more.

Hence deflation forces down interest rates and encourages the demand for cash (and safe deposit boxes) and discourages the demand for bank deposits and for goods and services that may be expected to become cheaper. Deflation also encourages banks and other lenders to hold cash rather than to lend it out. Hence further reason to fight deflation (and too little rather than too much spending) by flooding the system with additional cash so that the supply of cash can eventually, even with very low or negative interest rates, overwhelm the demand for cash.

Until Europe succeeds in overcoming deflation and stagnation we can expect interest rates in Europe to stay low and for the euro to stay weak; and the US dollar (offering higher interest rates) to stay strong. We may also expect deflation and low interest rates in Europe to help hold down long term rates in the US and elsewhere as European lenders seek higher yields abroad. The weak euro and stronger dollar (and perhaps also stronger emerging market currencies, including the rand) may also help restrain any increase in short and long interest rates globally. It may take some time before we can say with any confidence: goodbye to deflation and welcome back inflation.

The MPC says welcome to 2015. Will it say out with the old, in with the new?

The Monetary Policy Committee (MPC) of the Reserve Bank will be reporting back today on its first meeting of 2015.

The MPC did not have a good 2014. By the year end it had become clear that it had overestimated both SA inflation and growth in 2014 and beyond.

The estimates of inflation were overtaken by events outside SA, over which the Reserve Bank has no influence. These were events that moved global prices and interest rates markedly lower and the rand no weaker on a trade weighted basis, despite the strong US dollar. However the increases in the MPC short term repo rate in 2014, to 5.75%, by an initial 50 bp in January followed by a further 25bp in July, would have discouraged domestic spending to a degree. This was spending that in mid year gave every indication of slowing down even more rapidly than initially forecast. But the higher cost of credit had no discernible influence on inflation, dominated as it was by global price trends, especially that of oil and grains, and the exchange rate.

Hindsight would suggest that short term interest rates in SA should at worst have been kept on hold in 2014 and, better still, should have moved lower. Longer term rates certainly did, determined as they are by market forces, though they were market forces with an eye always on central bank action.

The Reserve Bank might be inclined to contest such an observation. It stressed in its statements released after its MPC meetings that fighting inflation was its primary task and moreover that it regarded its monetary policy as always accommodating, a reference to the unusually small gap between interest rates and inflation.

According to its statement in July 2014, when it raised short rates by a further 25bp:

“The MPC is also increasingly concerned about the inflation outlook, and the further upside risks to the forecast. Although the exchange rate remains a key factor in this regard, the possibility of a wage-price spiral should wage settlements well in excess of inflation and productivity growth become an economy-wide norm has increased. Although the inflation trajectory has not deteriorated markedly since the previous meeting, upside risks have increased, and it is expected to remain uncomfortably close to the upper end of the target range when it does eventually return to within the target. The upside risk factors make this trajectory highly vulnerable to any significant changes in inflation pressures.

“Although inflation expectations have remained relatively anchored, should inflation persist outside the target band, these expectations risk becoming dislodged.

“The MPC has decided to continue on its gradual normalisation path and raise the repurchase rate by 25 basis points to 5,75 per cent per annum, effective from Friday 18 July. Given the expected inflation trajectory, the real repurchase rate remains slightly negative and well below its longer term neutral level. The monetary policy stance remains supportive of the domestic economy, and, as before, any future moves will be gradual and highly data dependent.

“We would like to reiterate that monetary policy should not be seen as the growth engine of the economy. The sources of the below par growth performance are largely outside the realms of monetary policy.”

The lesson the Reserve Bank might however take from events in 2014 is that while it is true that the “the sources of the below par growth performance are largely outside the realms of monetary policy”, so is the inflation rate.

Inflation in 2015 will continue to be dominated by events beyond the influence of SA monetary policy and short term interest rate settings. For some obvious examples of only the known unknowns, the timing of the first US FED rate increase, June 2015 or later, will matter for global growth and inflation forecasts. So will the success or otherwise of European quantitative easing and how deflation in Europe presses down euro yields and hence the flow of funds both to the US and emerging markets (including SA) in search of higher yields. A possibly still stronger dollar might press further on the oil and other metal prices, meaning less inflation and possibly slower growth in the US. The economic recovery in the US, depending on its pace, may encourage tepid growth in emerging economies, adding to the attractions of their equities and currencies, including the rand. Such outcomes will in turn bring rate increases in the US either forward or back.

The MPC, as is clear from the statements it issued, worried a great deal in 2014 about the turbulence in global markets and economies and how it should react to the interest rate decisions of other central banks. As it turned out, the higher rates imposed by a number of emerging market central banks, including the SA Reserve Bank, were ill advised and are being reversed in the light of lower inflation.

The MPC will almost certainly keep its repo rate on hold today. Hopefully its future decisions will remain data dependent and not presume a so described normalisation of interest rates any time soon. Normalisation of (higher) interest rates presumes a normalisation of global economic circumstances that remain distinctly abnormal as deflation and QE in Europe confirm.

It would be wise for the Reserve Bank to realise that its influence over growth, inflation and inflation expectations is limited given the exposure of the SA economy to global forces.

There is however one feedback loop over which it has some influence. This is the loop from short term interest rates to domestic spending. Higher rates discourage such spending and lower rates can encourage it. This is the only channel of influence the Reserve Bank can rely upon to some degree.

It should therefore concentrate on ensuring that domestic demand neither adds to nor detracts from inflationary or deflationary pressures. Or, in other words, to attempt with its interest rate settings to match domestic spending (influenced as it will be by bank lending) to potential domestic production as closely as possible. If it succeeds in this, it will have done what little it can realistically hope to achieve in consistently low inflation in SA. Hoping to do more than this, especially in hoping to predict the course of global economic events, and then to react “correctly”, is beyond its limited powers. This was amply shown to be the case in 2014.

Domestic spending in SA has been running at what can be presumed to be well below normal levels and rates of growth. It can do with all the help it will be getting from lower inflation and lower fuel prices. Additional help from lower short term interest rates may well be called for in due course, if spending growth remains subdued.

A helping hand from Europe

How European Central Bank (ECB) Quantitative Easing (QE) moved the markets, including the rand and the RSA Yields. Is this good news for emerging market economies?

The unexpected scale of the intended QE in Europe announced on Thursday moved the markets. Most conspicuously it weakened the euro vs the US dollar. Such weakness must be good for European exporters and thus for growth prospects in Europe regardless of how much more lending European banks will do with their pumped up cash reserves. Some stimulus from a weaker euro will add something to the demand for bank credit, which has been as weak as the supply of bank credit from European banks – hence the case for QE.

US dollar strength and euro weakness was an entirely predictable response to what became a wider interest rate spread in favour of US Treasuries over Bunds.

The rand not only gained against the euro but also strengthened against the US dollar on the QE facts.

This strength was however not confined to the rand. It was also extended to many of the other emerging market currencies. The rand lost a little bit of ground against the Brazilian real and gained against the Turkish lira. It also held its own against the Mexican peso and Indian rupee as we also show below. Thus euro weakness vs the US dollar extended to emerging market currencies, including the rand.

The strength of the rand vs the euro was linked with further strength in the RSA bond market. We have alluded in previous notes to the recently strong relationship between the rand/euro and RSA long bond yields. This trend of declining RSA yields associated with rand/euro strength held up strongly over the past few days. It indicates that the lower euro interest rates and a wider spread in favour of RSA (and presumably other emerging market) bond yields also attracted flows of funds out of or away from Europe – enough to move emerging market bond yields lower.

It was not only emerging market bond markets that seemed to benefit from changes in flows of funds in response to ECB QE. Emerging market equity markets, including the JSE when measured in US dollars, also outperformed the S&P 500.

Lower interest rates and determined reflation in Europe have improved global growth prospects. It does appear that EM bond and currency markets have benefitted and that EM economies may grow faster in response to the sustained improvement in the US economy and now hopefully better growth prospects in Europe on which EM economies depend. So much can be read into market moves. As we have mentioned before it is hard to predict other than dollar strength Vs the Euro in the light of the sustained spread in the yields offered by US Treasuries over German Bunds. It seems that the wide spread between Euro yields and EM yields can help to protect EM currencies including the ZAR from dollar strength. This means less inflation as well as low long term rates. It can also mean lower short term rates that might help stimulate growth even as inflation comes down.