Author: Brian Kantor
Rand strength surprise
A shorter version of the below article was published in the Business Day – Available here
The rand does not always perform as expected, thanks to the US dollar, to which we should always pay close attention
Rand strength almost always surprises the market. The large spread between SA interest rates and US or other developed market interest rates indicates that the market expects the rand to weaken consistently against the US dollar and other developed market currencies. By the close on 18 July this spread for 10 year money was 6.43%. To put it another way, the rand was expected at that point to lose its exchange value in US dollar at the average annual rate of 6.43% over the next 10 years.
This difference, or interest carry, is also by definition the annual cost of a US dollar or euro to be delivered in the future. And so, the forward rate of exchange for the USD/ZAR to be delivered in a year or more always stands at a premium to the spot rate. This year, the daily interest spread on a 10 year government bond has varied between 6.4 and 5.94 percentage points while the USD/ZAR has varied between a most expensive R13.20 to a best of R12.42, using daily close rates of exchange. It should be noticed in figure 1, that while the interest spread- or expected exchange rate has a narrow range – the two series move together. That is a stronger rand leads to less rand weakness expected (less of a spread) and vice-versa.
Another way of putting this point is that the weaker the rand the more it is expected to weaken further and vice versa. This is not an intuitively obvious outcome. Normally the more some good or service falls in price the more, not less attractive it becomes to buyers. This is the case with developed market exchange rates – dollar strength vs the euro tends to narrow the carry. But this is not the case with the rand exchange rate and perhaps also other emerging market exchange rates. For the USD/ZAR exchange rate, rand weakness is associated consistently with still more weakness expected and vice versa as figure 1 and 2 indicates. It would seemingly therefore take an extended period of rand strength to improve the outlook, as indeed was the case between 2003 and 2006 when the spread narrowed to about 2% with significant rand strength (See figure 2).


While a more favourable direction for the USD/ZAR may well come as a surprise – the explanation of rand strength or weakness should be more obvious than it appears to be, judged by much of the commentary offered on changes in the exchange value of the rand. The reality demonstrated below is that the behaviour of the USD/ZAR exchange rate to date has had much less to do with South African events and political developments and much more to do with global forces than is usually appreciated. And such global forces affect the exchange value of the rand and other emerging market currencies in similar ways.
Unless the future of SA economic policy is very different from the past, this is still likely to still be the case in the months ahead. In other words, rand strength or weakness in the months ahead, will have a great deal more to do with what happens to the US economy and the strength or weakness of the US dollar against other major currencies, than political and economic developments in SA. Predicting the USD/ZAR accurately therefore will require an accurate forecast of the US dollar vs mostly the euro, and also to a lesser extent the yen, the Swiss franc, the Swedish kroner and the Canadian dollar.
We show below in figures 3 and 4 below how the USD/ZAR exchange rate moves closely in line with those of other emerging market (EM) currencies. Furthermore it is also shown how all EM currencies strengthen when the USD weakens against other major currencies and vice versa. That is US dollar strength vs its peers is strongly associated with EM exchange rate weakness generally and so also USD/ZAR weakness.
In the correlation matrix below, using daily data from 2012, it may be seen that the correlation between the trade weighted US dollar vs developed currencies, and the JP Morgan Index of emerging market currencies is a high and negative (-0.82) (dollar strength = emerging market weakness) The correlation of the US dollar with our own emerging market nine currency basket (US dollar/EM) that excludes the rand, is even greater at ( 0.98) The correlation of daily exchange rates between the USD/ZAR and the trade-weighted dollar index is (0.89). In other words, the stronger the trade-weighted dollar, the higher its numerical value, the more expensive the US dollar has become. As may also be seen in the table below, the correlation between the USD/EM nine currency basket and the USD/ZAR is also very high (0.95).
These relationships are also indicated in figures 3 and 4 below. In these charts the trade-weighted dollar in these figures is inverted for ease of comparison – higher values indicate weakness and lower values strength. It may be seen that US dollar strength after 2014 was closely associated with emerging market and rand weakness. Very recently, since June 2017, it is shown how a small degree of US dollar weakness has been associated with emerging market and rand strength.


In figure 4 below we show the ratio of the USD/ZAR to our Investec nine currency basket (USD/EM) since 2012. This ratio (2012=1) widened sharply after President Jacob Zuma sacked Minister Finance Nhlanhla Nene, only bring in Pravin Ghordan a few days later. This ratio then narrowed sharply after the second quarter of 2016, indicating much less SA-specific risk was gradually being priced into the rand.

(The nine currencies: Equally weighted Turkish lira, Russian ruble, Hungarian forint, Brazilian real, Mexican, Chilean and Philippine pesos, Indian rupee and Malaysian ringgit.)
The second Zuma intervention in March 2017, when Gordhan was in turn sacked by Zuma, had less of an impact on the relative value of the rand. In figure 5 below, we show a close up of this ratio in June and July 2017 after the independence of the SA Reserve Bank was called into question by the SA Public Protector, Busisiwe Mkhwebane. The ratio initially widened on the statement by the Public Protector, to indicate more SA risk. But the rand and its emerging market peers both strengthened as a result of a degree of US dollar weakness against the other major currencies, as is shown in figures 5 and 6 below.


Given the history of the USD/ZAR it should be appreciated that betting against the rand at current rates is also mostly a bet on the value of the US dollar vs the euro and other developed market currencies. Hence the causes of dollar strength or weakness needs careful consideration. The US dollar strengthens US growth beats expectations, leading to higher interest rates in the US relative to growth and interest rates in the likes of the Eurozone as well as to US dollar strength. Emerging market currencies and the rand can be expected to weaken in this scenario. A weaker US dollar and stronger euro will tend to have the opposite effect, as we have seen recently.
Relatively slower US growth and a more dovish Fed can be very helpful to emerging market exchange rates (like the rand) over the next few months. This is providing the political economy of SA is not to be radically transformed. The financial markets, judged by the ZAR/EM exchange rate ratio and the yield spreads, are currently strongly demonstrating a belief in policy continuity in SA. 19 July 2017
Separating the influences of politics and economics
These are fraught times for South Africans. The Public Protector has attacked the constitutional protection provided to the Reserve Bank and the inflation targeting mandate prescribed for it by the Treasury. The (false) notion of white monopoly capital – introduced to counter the critics of state capture – has become a constant refrain and irritant to white South Africans who play such a crucial role in our economy. The tale of corruption at the highest levels of the state is being continuously reinforced by extraordinary revelations out of cyberspace.
They further drain the confidence of businesses and households, whose reluctance to spend has led the economy into recession. The election of a new head of the ANC and presumptive President is being be contested on the issue of corruption and who bears the responsibility for it.
The ANC is currently debating economic policy. Appointed economic commissions have debated the issues and will reveal soon just how the governing party’s economic policy intentions have changed.
These uncertainties could be expected to influence the value of the rand and of SA equities and bonds listed on the JSE. Such would appear to be the case with a recently weaker rand and upward pressure on bond yields. JSE-listed equities, when valued in rands rather than US dollars, may behave somewhat differently in response to SA political risks. Given that many of the companies listed on the JSE (with large weights in the calculation of the All Share and other indices) derive much of their revenues and incur much of their costs outside of SA, their rand values tend to benefit from rand weakness, especially when this is associated with additional risks specific to South Africa. There are other risks to the share market that are common to the global economy and emerging markets generally. These forces are likely to effect the US dollar value of these companies, mostly established on offshore stock markets that are then translated into rand values at prevailing exchange rates. Rand strength since mid-2016 has been associated with improved global economic prospects identified by higher commodity and metal prices and increases in the US dollar value of emerging market (EM) equities generally.
It is possible to identify SA-specific risks by observing the performance of the rand relative to other EM currencies. Further evidence can be derived from the spreads between RSA bond yields and the equivalent yields offered by developed market governments and other EM issuers of US dollar-denominated bonds. We provide such evidence in figure 1 below.
It should be appreciated that bond yields in the US and Europe all kicked up very sharply last week (Thursday 29 June) after ECB President Mario Draghi indicated a much more sanguine view of the outlook for growth and inflation in Europe. The prospect of higher policy-determined interest rates accordingly improved, as did the likelihood of an earlier, rather than later, end to quantitative easing (QE) in Europe and its reversal, or tapering. This led to a degree of euro strength and dollar weakness – but as we shall see EM currencies, not only the rand, lost ground to the weaker US dollar. An early hint of US tapering in 2013 had led to US dollar strength and EM currency weakness and the responses in EM bond markets did have a mild hint of these earlier taper tantrums, as we will demonstrated. Better news about US manufacturing this week helped the US dollar recover some of its losses against the euro. Late on Friday (30 June) the euro was trading at 1.1426 – early yesterday (5 July) it was being exchanged at 1.132.
As we show in figure 1, the USD/ZAR exchange rate has moved mostly in line with the EM currency basket since 20121. The rand is well described and explained as an EM currency. As demonstrated by the ratio of the rand to the EM basket, the rand did relatively poorly for much of the period under observation, and especially after the first President Jacob Zuma intervention in the SA Treasury in December 2015. Then the rand, at its worst, weakened by as much as 25% more than had the average EM currency.
However through much of 2016, the rand did significantly better against the US dollar than the EM basket, with the ratio ZAR/EM (1 in 2012) back again to 1 in 2017, indicating less SA-specific risk. However the second Zuma intervention, the sacking of Finance Minister Pravin Gordhan in March 2017, reversed some of this improvement in the relative performance of the rand against other EM peers – but then was followed again by a degree of further rand strength compared to the EM average.
This improvement in the relative value of the rand was interrupted again in modest degree towards 27 June, as we show more clearly in figure 2 below. The ratio of these exchange rates, based as 1 in early 2017, was 1.02 midday on 5 July. However at the time of writing (late 5 July) the rand has weakened further against the US dollar and the other developed market currencies and presumably also against other EM currencies.
The impact of the most recent news flow, including the news leak on the morning of 5 July that the ANC had called for state ownership of the Reserve Bank, led to about a 1% decline in the rand against other EM currencies by midday yesterday, 5 July. By then the USD/ZAR had weakened from an overnight R13.2 to R13.398, with more weakness following. The EM currency basket had also weakened that morning of 5 July but by only about 0.42% against the US dollar. It should be recognised that much, of the rand weakness in 2017was caused by global forces reflected widely in the EM financial markets.
We await further news about the resolutions adopted by the ANC gathering and pointers to the election of a new ANC leader. The interpretation of these political developments will reveal themselves in the financial markets in the same direction as they have to date. The change in ownership of the Reserve Bank is symbolic and without operational substance. The operations of the Bank are determined entirely by the executive directors and managers who are appointed by the State. The 600 private shareholders (of whom I happen to be one with 100 shares), receive a constant predetermined 4% annual dividend and have the right only to appoint seven of the central bank’s 10 non-executive directors and to attend the AGM. But as we have noticed, symbols have significance and do point to the future direction of economic policy. Any threat to Reserve Bank independence or to fiscal conservatism is a threat to the rand and to the bond market, but less, as we point out below, to the rand value of the equity market.


When we turn to the bond markets a similar picture emerges: a modest increase in the SA risk premiums in late June and early July. Long term interest rates have all moved higher in response to the words of central bankers in Europe. However the spread between RSA yields and US yields has not widened materially, perhaps by only 8 basis points.
This spread incidentally is now as low as it was in early 2015, despite the downgrading of RSA debt by the rating agencies. It may be concluded from these generally favourable developments in the currency and bond markets, that the market is discounting the threat to SA’s economic policy settings posed by President Zuma. The market may well have been anticipating the end of the Zuma presidency.


The spread between RSA and other EM bond yields has also been well contained – despite political developments in SA. The five year RSA Yankee bond’s Credit Default Swap (CDS) spread vs the US – very similar to the spread between the RSA Yankee bond yield and the Treasury bond yield – has moved marginally higher. The spread between other high yield EM and RSA CDSs has narrowed marginally, indicating a somewhat less favourable (relative) rating for RSA debt in recent days. RSA CDS swap spreads over US Treasuries are compared below in figure 6 to those applying to dollar denominated bonds issued by Turkey, Brazil and Russia. Little change in EM credit ratings, that is what it costs to insure such debt against default, can be noticed.


JSE-listed equities by contrast have significantly underperformed their EM peers in recent weeks, as may be seen in figure 7 below. The strong rand has been a head wind for the JSE, given the preponderance of companies with offshore exposure and whose US dollar values are determined on offshare markets and translated into rands at prevailing exchange rates. Over the longer run the US dollar value of the JSE and the EM benchmarks track very closely, helped by similar exchange rate trends as well as earnings trends.
The SA economy plays on the JSE have not yet had the benefit of lower interest rates that usually accompany a stronger rand and lower inflation. So what has been a headwind for the rand values of the global plays has not yet turned into a tailwind for the SA economy plays: the retailers, banks and especially the mid- and small-cap counters that have trailed the market in general.
A cyclical recovery of the SA economy cannot occur without reductions in short term interest rates. One can only hope that the Reserve Bank does not wish to assert its independence of politics by further delaying reductions in interest rates. These are urgently called for and have every justification, even given its own very narrowly focused inflation targeting modus operandi, of which incidentally, I have also been highly critical of. 6 July 2017
1 Equally weighted Turkish lira, Russian ruble, Hungarian forint, Brazilian real, Mexican, Chilean and Philippine pesos, Indian rupee and Malaysian ringgit.

*The views expressed in this column are those of the author and may not necessarily represent those of Investec Wealth & Investment
An exercise in persuading South Africans that a much better economic way is open to them
My book Get SA Growing (Jonathan Ball 2017) hopes to persuade South Africans that there is a clear and highly realistic way out of our poverty trap. And that is to let all our people exercise much more freedom to help themselves improve their economic circumstances. Or in other words for the economy to rely much more on highly competitive market forces, to determine output, incomes, jobs and wages. There is overwhelming support from economic history, especially from the recent immense poverty reduction achievements of many Asian economies, of how it is possible, using the power of the market place, to lift billions of people out of absolute poverty.
South Africa could be playing much more helpfully to its objective strengths – and that is the competence and competiveness of established businesses and new entrants to business to effectively deliver goods and services and employment and incomes. And are highly capable of doing much more for their stakeholders. Not only for their owners, but for their numerically much more important customers and employees. And their owners, often pension and retirement funds who manage most of our savings, are rapidly becoming as racially representative of the work-force. Something ignored so opportunistically by the politics of empowerment.
The book tries to build trust in and respect for market forces by examining and explaining what goes on in our economy and how and why it could be better organized for the benefit of nearly all of us- and especially the many desperate poor. It is written by an economist for my fellow South Africans who share my frustration with our economic failure.
We should have more respect for the rights of individuals to make their own decisions and bear the consequences of them. And we should not allow adults who have the power to elect their government to be treated as if they were children in need of close supervision- an assumption often convenient for politicians and the officials who direct government spending on their behalf. Private providers of goods and services, now supplied by government agencies, would treat people much more as valued customers rather than as supplicants.
Privatization of the delivery of benefits – currently funded by the taxpayer – would produce much better results- especially in education – where the spending and tax burden is a heavy one and the outcomes so disappointing. The extra skills that would command employment and higher incomes are simply not emerging nearly well enough. Radical reforms are required that would make public schools and hospitals private ones. And convert public enterprises into more efficient private ones that would not convert losses and poor operating procedures into ever increasing public debts. Privatization could be used to pay off the expensive public debt.
A much greater reliance on and encouragement for the free play of market forces is called for in South Africa Much less should be expected from well-meaning national development plans or from even honestly governed state owned corporations to deliver the essential jobs and goods and services. Perhaps even more dangerous to the well- being of all South Africans would be to provide even greater opportunity for doing government business, funded by taxpayers, on highly favourable (non-competitive) terms with the politically well-connected few. The newly promulgated Mining Charter is an exercise in extreme crony-capitalism that will undermine the future of mining in SA and its ability to create incomes, jobs and tax revenues.
Faster economic growth would be truly transformational. Building on the strengths we have- on our skilled human capital that is globally competitive – and so very vulnerable to emigration – and on the proven ability to raise financial capital from global markets when the prospects are favourable – faster growth would greatly stimulate the upward mobility of an increasingly skilled black South Africans. The upper reaches of the economy could soon become as racially transformed as have the ranks of the middle income classes. And the very poor and less skilled (now mostly not working) would benefit greatly from increased competition for their increasingly valuable and scarce services. Forcing transformation of the leaders of the SA economy would have the opposite effect. It would mean further economic stagnation and increased resentment of higher income South Africans.
The hope is that the book will make it more likely that the economic future of South Africa will be decided in a less racially charged way- with more reliance on meritocratic market forces. South Africa in fact undertakes an extraordinary degree of redistributing earned incomes, unequal because the valuable skills that command high incomes are so unequally distributed. That is unusual amounts of income is currently taken from the very well off to fund government expenditure – judged by the practices of other economies with comparable incomes per head. But economic stagnation has now severely limited the capacity to help the poor. More of the higher incomes that come with growth can then be redistributed to the least advantaged -hopefully with much more help from private suppliers of the benefits provided. Growth and redistribution is very possible for South Africa- should we change our ways and grow faster – as the book hopes to persuade South Africans to do.
Interpreting the political messages from cyberspace
Cyberspace has revealed the modus operandi of a group of SA businesses that have excelled (if that is the right term) at doing business with the SA government. We now know just how profitable these favoured procurement exercises have been.
The large modern state, which includes state owned business enterprises with genuine monopoly powers, has significant economic powers to contract for goods and services from private suppliers. Such contracts, we would surely agree, should be determined in an objective way and be subject to genuine competition for such potentially valuable business opportunities.
If objectivity is not to be the guiding principle, the waste incurred is not only in the form of hard-earned tax revenues or borrowing powers supported by the tax base. It also means a sacrifice of the alternative benefits that might have been better provided for – including spending on the least advantaged of society. That officials of government, responsible for such negotiations, might directly benefit from such contracts, is always a possibility, to be guarded against by appropriately vigilant and transparent procedures.
Government practice, anywhere in the world, does not always conform to best practice. A case can therefore be made for not only better, and more honest government, but also for less government. This argues for a smaller, less intrusive role for government as a supplier of goods and services (as opposed to funder of benefits). This would leave space for private hospitals or private schools, for example, to compete for demanding patients or pupils, funded partly or fully by the taxpayer. It would also call for the privatisation of public enterprises, with the proceeds used to pay off government borrowing.
In some societies the degree of corruption can be such as to not only destroy the practice of good government itself, but to undermine the efficiency of the greater economy. Economic growth itself, of the inclusive kind, becomes much more difficult to realise and is replaced by exclusive growth that benefits mainly those in power and their politically-favoured hangers on.
One term that describes such a failing economic system is ‘state capture’. Another is crony capitalism. South Africa is in grave danger of more crony capitalism and of undermining the growth prospects for our economy and benefits for the poor that a competitive market led economy could deliver.
Cyberspace has also revealed that the notion of ‘white monopoly capitalism’ is a creation of a PR company employed by the same group of SA businesses that have benefited so greatly from state largesse. But the notion of white monopoly capital is a politically and racially charged canard. It is an attack on well-established enterprises that compete actively and effectively for customers and employees, and which effectively service their stakeholders – who are mostly black South Africans. If these enterprises are JSE-listed enterprises, their shareowners will be pension or retirement funds, the beneficiaries of which will increasingly be black South Africans. It is convenient for crony SA capitalists and their supporters to ignore such ownership claims in conventional measures of empowerment.
Any constraints on these established businesses to compete freely for customers, skills or capital will harm their many owners, customers and employees. It will also harm the employment and income prospects of many poor South Africans. And by reducing the growth of the economy, they limit the tax base that could be used to support them.
How Orwellian it is to find the enemy in established businesses that are the most capable and competitive element of our economic structure. Arguments are raised to increase the scope for crony capitalism, rather than diminish it. The newly released Mining Charter is unfortunately a charter for more crony capitalism. However its terms of engagement make it very unlikely that more capital will be allocated to risky exploration or mining developments. Giving up 50% or more of the upside in any venture, for no protection on the downside, is a severe impediment to risk taking. Not only will potential employment or income or taxes from mining in SA be sacrificed, the very few intended beneficiaries (the potential cronies) will find the takings hard to realise – if there is no investment. 23 June 2017
The views expressed in this column are those of the author and may not necessarily represent those of Investec Wealth & Investment.
The author makes the full case for genuine capitalism in South Africa in his recently published book, ‘Get South Africa Going’ – Jonathan Ball Publishers, Johannesburg and Cape Town, 2017.
Monetary Policy in SA; Exchange rate volatility and exchange rate risks – that should best be ignored
[The text has been revised to correct an earlier version that failed to recognise the sharp reduction in interest rates after the Global Financial Crisis]
The Reserve Bank kept interest rates on hold in May because, as it explained, there were upside risks to the exchange rate. The risk was that if the rand weakened significantly it might have called for an immediate reversal of any interest rate reductions. Since then the Bank has provided further helpful detail of how its Monetary Policy Committee (MPC) goes about its risk adjusted exchange rate forecasting. We quote extensively from a recent address by Brian Kahn, Advisor to the Governor. [1]
To quote Mr.Kahn:
“How do we deal with the exchange rate in our (inflation) forecast? We make a simplifying assumption of a stable real effective exchange rate over the forecast period. That implies an expectation of a rand depreciation over that period in line with inflation differentials with our major trading partners. We then use our judgement to assign a risk to this assumption, which then feeds in to the overall risk to the inflation forecast…”
And to quote further
“….It is not just the forecast itself that is of importance, but also how we perceive the risks to the forecast. Any particular forecast trajectory could have a different policy outcome depending on how we assess the risks. MPC members may have differing views of these risks, which explains to some extent why we do not always have unanimity in the decision-making process…”
And on the forecasting method itself Mr Kahn explained
“…The critical issue then is the level of the starting point. As a general rule, we set it at the prevailing index level of the real exchange rate. However, if we feel that the exchange rate is clearly over- or undervalued at that point, we may adjust that level. In other words, should we regard the current strengthening or weakening of the rand as being temporary, we may not adjust the assumption fully until we have greater confidence of its persistence at those levels. The level that we choose has an important implication for the forecast. In 2016, for example, we saw a progressive improvement of the inflation forecast over the year. Most of this was due to revisions to the exchange rate assumption, following a recovery of the rand ……”
Mr Kahn made it clear that
“…While the exchange rate is one of the important variables in our inflation forecast, it is not the only one and we have to look at its impact in conjunction with the movement of other variables. And we certainly do not conduct monetary policy with a view to impacting on the rand itself…”
Forecasting the ZAR is easier said than done. In reality it is an impossible task to fulfil with any degree of confidence. If past performance of the USD/ZAR is anything to go by the chances of the rand going up or down is statistically about the same. This is not surprising given the size of the market in the ZAR and the advantages an accurate forecast would offer any professional currency trader. In practice all that might be known by professional traders about what might determine the value of the ZAR in the future, will already have been incorporated in the current price of a US dollar. And so the exchange rate moves randomly from day to day, or minute to minute, as more information about the forces that influence the exchange rate are continuously revised.
Daily percentage moves in the USD/ZAR since 2006 and June 2017 have averaged very close to zero, .000230% per day to be exact. The worse day for the ZAR over this period was a 16% fall on the 15th October 2008 during the height of the Global Financial Crisis and the best a 7.5% gain registered on the 28th of that fateful October 2008. Monthly moves in the ZAR are also a random walk with a weaker long term bias. On average since January 1995, the USD/ZAR has declined by 0.59 per cent per month, the worst month being October 2008 when the ZAR lost 20% of its value and the best month was April 2009 when the rand gained over 11% against the USD (See below)

The real rand exchange rate – that is the value of the rand adjusted for differences in inflation between SA and its trading partners – indicates some tendency to revert to its Purchasing Power Parity (PPP) value over an extended period of time. Or in other words faster inflation that follows a weaker ZAR helps to strengthen the real rand given enough time. Given also some stability in or absolute strength in the nominal ZAR. On these grounds and given the recent level of the real rand this might have led the MPC in a less rather than more risk reverse direction. But on a day to day, or even year to year basis, the value of the real rand will be dominated by much wider movements in the nominal, that is the market determined, exchange rates, rather than by differences in more stable inflation rates. An exchange rate that as we have pointed out that fluctuates randomly and so for which the best estimate of tomorrow’s price of a USD value is today’s rate.
In figure 3 below we show how the USD/ZAR exchange rate has deviated from its PPP equivalent value since 1970. Exchange rate shocks- when the exchange rate moved sharply away from its PPP value can be identified in 1985, 1998, 2001, 2008 and also 2011. Though between 2011 and mid 2016 the real rand was subject to an extended period of growing weakness. This was a period of persistent USD strength and weakness of most other Emerging Market currencies.
As may be seen the USD/ZAR has been persistently weaker than would be predicted by the ratio of the Consumer Price Indexes in the two economies since 1995. In 1995 the SA economy was permanently opened to capital flows that had been tightly controlled before – with a brief interlude of freedom from capital controls for foreign investors between 1983 and 1986. It is of interest to note that when capital flows to and from SA were tightly controlled, the exchange rate, conformed very closely to PPP- truly levelling the trading field for importers and local producers competing with them. This currency, used for foreign trade purposes, was known as the Commercial Rand to distinguish it from the consistently less valuable Financial Rand used for transactions of capital undertaken by foreign investors in SA. After 1995, variable flows of capital to and from SA have come to dominate movements in the market determined unified ZAR exchange rates. Any assumption that these exchange rates would conform to PPP would not be a realistic one given the record of exchange rates since 1995- as shown in figure 3 and 4.
This real weakness was largest in percentage terms in 2001 and the real rand was again very weak in 2016. (See figure 3 below) The real trade weighted rand, as calculated by the Reserve Bank, varies about 100 to conform to PPP, as it was assumed to do in 2010. Real strength is represented by increases in the real exchange rate. The real trade weighted rand is compared with the real ZAR/USD exchange rate that uses the respective CPI Indexes In figure 4. The figure indicates a very strong real USD/ZAR exchange rate in the late seventies and early eighties when the USD itself was very weak on its own trade weighted basis. The real trade weighted ZAR rate has a current value of 89 compared to a less valuable 83 for the real USD/ZAR exchange rate.

As Mr.Kahn has explained the exchange rate has a very important influence on the SA inflation rate in SA given the openness of the SA economy to imports and exports- that together amount to over 50% of the GDP. Ideally from the perspective of monetary policy and appropriate interest rate settings, the ZAR exchange rate would be well behaved. Well behaved in the sense that exchange rate trends would closely follow domestic inflation and help maintain the level trading field when exchange rates largely compensate for differences in inflation – that is PPP more or less holds. That is movements in exchange rates compensate for differences in inflation rates between trading partners to neither add to or subtract from the competitiveness of local suppliers in either the local or foreign markets. If so the price of a dollar (and so the rand value of exports or imports) would be determined by the same forces that simultaneously determine the prices of all the goods and services that make up the CPI. In which case prices might rise faster or slower and the exchange rate would depreciate in line. When demand exceeds supply prices, including the rand price of a USD would tend to rise faster – and vice versa. Too much demand and the inflation and exchange rate weakness associated with it would obviously call for higher interest rates. And too little demand- associated with low rates of inflation and a stronger rand would call unequivocally for lower interest rates.
But unfortunately for SA the ZAR exchange rate is not well behaved. It often takes an unpredictable course set quite independently of the forces of demand and supply in the economy. Inflation – depending on the exchange rate and other forces- then follows more or less closely the independent direction of the exchange rate. And interest rates in SA then follow inflation, usually higher sometimes lower, regardless of the causes of inflation and the prevailing state of the economy. They therefore may rise even though domestic spending is growing ever more slowly- as they have done in SA since 2014. These higher interest rates in turn help depress spending further that is already under pressure of higher prices. These forces are known in the economics literature as supply side shocks to prices- less supply means higher prices – as they would in a drought that reduces supplies to the market place and raises price. And supply side shocks, according to the same literature, are considered to be reversible with temporary not permanent effects on inflation- and not to call for monetary policy responses
As Mr.Kahn has explained the current weakness of demand in SA makes it harder for firms to pass on higher costs to their customers- so reducing inflationary pressures to a degree- but simultaneously making it all the more difficult for the firms to invest more or hire more workers. This repression of domestic demand has added to the other recessionary forces under way. Without having any predictable influence on the exchange value of the rand – which as Mr.Kahn has also indicated, is anyway not a target for monetary policy.
The sooner the Reserve Banks lowers interest rates the better the chance of the economy recovering from recession. Delaying the interest rate reductions for fear of what might happen to the exchange rate prolongs rather than relieves the economy agony. There is surely much more at stake than forecasting the exchange rate accurately- a task surely well beyond the capabilities of the MPC or indeed any other forecaster.
There is an obvious way out of this dilemma – of having to increase interest rates to fight inflation, when interest rates have had nothing to do with the exchange rate and the inflation under way. And higher interest rates can only slightly inhibit inflation by further depressing spending that is already depressed. The alternative is for the policy makers to treat exchange rate shocks to inflation as what they surely are – a temporary supply side shocks that will increase prices perhaps for a year and then fall out of the CPI, off a higher base level.
The narrative that suggests all inflation- whatever its cause- demand or supply side – needs to be met with higher interest rates needs to be a very different one. Not raising rates in the face of a supply side shock should moreover not be allowed to indicate any tolerance for higher inflation rates over the longer run. But it would be a narrative that would not allow inevitably risky exchange rate forecasts to influence interest rate settings that induce recessions. Monetary policy should allow a volatile exchange rate to help absorb the pressure of more adverse economic circumstances, not to exacerbate them
South Africa has a very poor record managing exchange rate shocks. The response to the emerging market shock to the ZAR in 1998 was one such particularly disastrous example. The interest rate increases that followed the 2001 exchange rate collapse was also not an appropriate response. Interest rate increases that were then sharply reversed after 2004 when the ZAR recovered and the economy picked up boom like momentum. A less severe hiking of interest rates prior to the 2008 Global Financial Crises, that was accompanied by ZAR weakness might have served the economy better. Though when the rand strengthened markedly soon after the crisis interest rates were lowered very sharply by as much as 7%. This undoubtedly helped the economy overcome a brief recession. Furthermore would inflation been any higher had interest rates not been increased after 2014 – in response to rand weakness and higher inflation and the recession perhaps avoided? (See figure 5 below)2
Had these exchange rate shocks to inflation been ignored, it can be strongly argued that SA inflation over the longer run would not have been very different and that growth rates would have been on average higher and less variable. The logic of inflation targeting – in the presence of un-predictable exchange rates that do not conform to purchasing power parity – needs to be seriously re-considered. The impaired logic of inflation targeting in SA can surely be reassessed without appearing soft on inflation.
Given that any immediate change in monetary policy philosophy is unlikely the improved outlook for inflation is such and further improved by recent stability in the ZAR- that lower interest rates will follow at the next MPC meeting in July 2017. The pace of further declines in the repo rate will follow inflation lower. The chances of a cyclical recovery in the economy depend crucially on lower short term interest rates – the sooner they come and the steeper the reductions the better.

1 “Check in” from the South African Reserve Bank
Address by Brian Kahn, adviser to the Governor,
to the 6th Annual Nedgroup Investments Treasurer’s Conference,
Summer Place, Hyde Park, 8 June 2017; www.resbank.co.za
2 This paragraph in italics corrects an earlier version that failed to recognise the sharp reduction in interest rates after the Global Financial Crisis
Making sense of a sideways moving JSE
Making sense of a JSE moving sideways and the conditions necessary to send the trajectory upwards
The recent performance of the JSE will have been disappointing to many South African shareholders. Since 1995, the JSE All Share Index has had its severe drawdowns. But these were more than compensated for when it came to the buy and hold investor. Since 1995 average annual returns, calculated monthly, were 12.9% compared to average headline inflation of 6.2% over the same extended period.
The worst months were when the JSE All Share Index was down by more than 30% in August 1998, 34% in 2003 and were as much as 43% down in February 2003. The best months came in the aftermath of these severe declines. Total 12 month returns were 40% in January 2001, 41% in July 2005 and 37% in March 2010.
By sharp contrast, between January 2016 and May 2017, the share market has moved very little in both directions, with comparatively little movement about this low average. The worst month over this recent period was February 2016, with negative annual returns of 4.4% and the best the close to 10% that were realised at January month end, 2017. (See Figure 1 below)

The JSE, since early 2016 however, presents very differently when the All Share Index is converted into US dollars. In dollars the Index itself (excluding dividends) is up by 24% since January 2016, a gain that compares very well with that of the emerging market benchmark (up 28%) over the same period and the 19% gain achieved by the S&P 500. (See figure 2 below)

In US dollar terms the JSE has, over the past two years, sustained its very close correlation with the EM Index of which it is a small part, perhaps 8%. Or in other words, the EM indices on average have recovered ground lost vs New York between 2011 and mid-2016, but have realised much more in US dollars than in local currencies, including the rand, which has strengthened materially against the US dollar since mid-2016. The JSE in 2017 to date (8 June) has gained 3% in rands; the EM Index is up 10% in rands, while the S&P 500, at record levels in US dollars, has gained but a mere 2% this year, when converted to the rand (now R12.84).

The rand has gained 6.3% vs the US dollar this year and is 20% stronger than its worst levels of R16.85 of early January 2016. The rand has also gained ground against most EM currencies over the same period. The rand blew out against the EM peers in December 2015 on the initial Zuma intervention in the Treasury. But it then recovered consistently against its peers as well as the US dollar after mid-2016 and is almost back to the level of 2012. The second Zuma intervention in Treasury affairs in late March 2017, when he sacked Minister of Finance Pravin Gordhan, has had very little effect on the USD/ZAR and on the value of the rand compared to a basket of eleven other EM currencies that have gained Vs the USD. (See figure 4 below)

Judged by this performance of the rand compared to other EM currencies shown in figure 3, the risks of doing business in SA rose significantly in December 2015 – but have receded markedly since. Moreover the spread between the yields offered in US dollars by the South African government, compared to the yield offered by the US Treasury, an explicit measure of country risk, is now no higher than it was before December 2015. The RSA, five year Yankee (US dollar-denominated) bond currently offers a yield of 3.7%. The safe-haven five year Treasury currently offers 1.75%. This risk spread rose from about 1.9% in mid-2015 to 3.7% in January 2016. It is currently about 2% or back to where it was before the Zuma threat to SA’s fiscal stability first emerged in December 2015 (see figure 5 below).

The Zuma interventions in South Africa’s fiscal affairs have clearly influenced the rating agencies. They have downgraded SA debt. The market place, it may be concluded, has largely got over the threat. The market must have concluded, rightly or wrongly, that the influence of President Zuma and the threat he represents to SA’s ability to service its debts is in decline. As it is often said, time (and perhaps leaked e-mails) will tell.
It should be appreciated that rand strength, considered on its own, is not directly helpful to about half the stocks listed on the JSE. These are the global companies with a listing on the JSE whose major sources of revenues and profits are outside the country. As such they are rand hedges and perhaps more important, hedges against SA specific risks. A combination of rand strength, especially for SA specific reasons, is not likely to be helpful to their rand values. A given dollar value for their shares, largely established by the global investor outside South Africa, will then automatically translate into lower rand values. Another way of making this point is to recognise that when the rand gains 20% against the dollar, it would take a more than 20% annual appreciation in the US dollar value of a stock to translate into an increase in the rand value of a dual listed company. This 20% or so is a very demanding US dollar rate of return.
This is a rate of return that Naspers, but few others of the global plays listed on the JSE, have been able to meet. Indeed, some of the important global plays listed on the JSE have suffered from weaknesses very specific to their own operations. For example MTN (Nigeria exposure), Richemont (luxury goods) and the London property counters (sterling) as well as AB-Inbev (the beer market) and Mediclinic (regulations in Dubai) have all had earnings problems of their own. Enough to drag back the JSE All Share Index in US dollars and even more so in the stronger rand.
But while rand strength is a headwind for much of the market, it can be a tailwind for the other half of the JSE much more dependent on the fortunes of the SA economy. But to help them, the strong rand and less inflation that follows need to be accompanied by lower interest rates. Lower interest rates stimulate extra household spending and borrowing that then becomes helpful for the earnings of retailers and banks. This move in interest rates has been delayed by the Reserve Bank, despite the recessionary forces that higher interest rates since January 2014 have helped to produce. But the recession coupled with the strong rand and the outlook for less inflation would make lower interest rates irresistible.
These recessionary forces have also been revealed by the earnings reported by industrial and financial companies listed on the JSE. Trailing Findi earnings per share are not yet back at 2015 levels – though they are now growing. In US dollars, Findi earnings per share are yet to recover to levels realised further back in 2011. (See figure 6 below)

These reported earnings moreover do not suggest that the Findi is undervalued – given current interest rates. They suggest the opposite, a degree of overvaluation that will need to be overcome by sustained growth in reported earnings. Naspers, with a weight of 27.3% in this index will have to play a full further part in this earnings growth. A regression model of the Findi, using reported earnings and short term interest rates as explanations run with data captured from 1990, explains the level of the index very well. The model suggests that fair value or model predicted value for the Findi was only 59 964 compared to the actual level of 72 732 at May 2017. That is, the model suggests that the Findi is now some 20% overvalued and has remained so for an extended period of time since 2013. This theoretical valuation gap has grown despite the stagnant level of the market as shown in figure 7 below.

The market has implicitly remained optimistic about a recovery of earnings, a recovery now under way but, that has taken an extended period of time to materialise given recession-inducing higher interest rates in SA. Lower interest rates – perhaps significantly lower rates – would be essential to justify current market levels. They will help by discounting current earnings at lower rates, but help more by stimulating currently very depressed levels of household spending and borrowing.
A stronger global economy will also help improve the US dollar value of the global plays listed on the JSE and, depending on the USD/ZAR, perhaps also their rand values. A weaker rand may help the rand values of the offshore dependent part of the JSE. But rand weakness might (wrongly) delay lower interest rates. The best hope for the JSE is a strong global economy, combined with a strong rand and a recession-sensitive Reserve Bank. Is this all too much to hope for?
Staying on a destructive path
The Monetary Policy Committee (MPC) of the Reserve Bank last week found reasons to deny any relief to the hard pressed SA economy in the form of lower short term interest rates. And to do so despite the very good prospect of less inflation and still slower growth to come.
According to the MPC statement:
“The MPC assesses the risks to the inflation outlook to be more or less balanced. Domestic demand pressures remain subdued, and, given the continued negative consumer and business sentiment, the risks to the growth outlook are assessed to be on the downside.”
Concern about the possible direction of the rand appears as the principle reason for the MPC to delay any action on interest rates and wait for further evidence of lower inflation.
To quote the MPC further:
“The rand remains a key upside risk to the forecast. The rand has, however, been surprisingly resilient in the face of recent domestic developments. This is partly due to offsetting factors, particularly positive sentiment towards emerging markets and the improved current account balance.”
But as the MPC must surely know, the future of foreign exchange value of the rand – weaker or stronger – will always be uncertain because it is at risk of political and global forces well beyond the influence of Reserve Bank actions or interest rate settings. Over the past year the rand has strengthened for global reasons, common to all emerging market currencies and, as acknowledged by the MPC, despite the Zuma-induced uncertainties about the future course of fiscal policy.
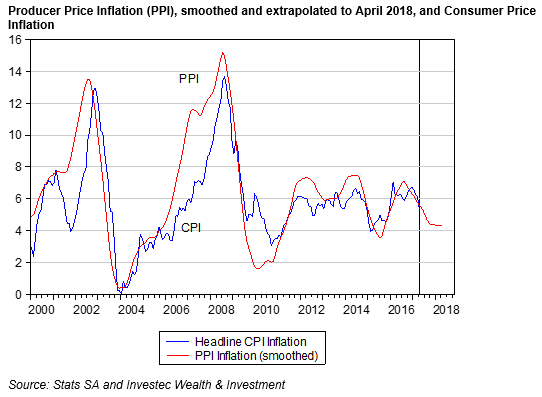
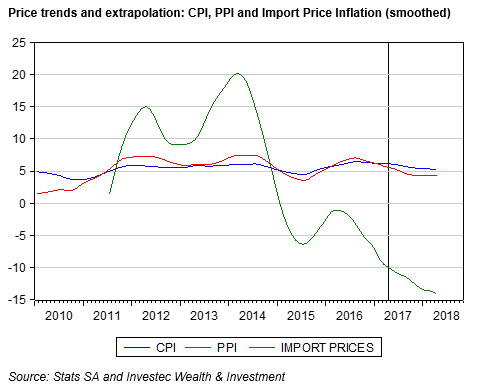
What is known about changes in the exchange value of the rand is that it will make exports and imports more or less expensive and usually lead the inflation rate higher or lower. In the figures below we show how the Import Price Index leads the Producer Price Index that in turn leads the Consumer Price Index in a consistent way. Given the recent strength in the rand, the trend is strongly pointing to lower inflation to come. Indeed, the MPC was surprised by the latest lower headline inflation rate reported for inflation, a lower rate that has still to be incorporated into its own forecasts of inflation.
The so-called pass through effect of the exchange rate on domestic prices, will also depend on also uncertain, global prices that also effect the US dollar prices of imported goods and services- particularly the dollar price of a barrel of oil. Other uncertainties will also influence domestic prices as the MPC acknowledges (for example electricity prices) as will expenditure taxes and excise duties – again forces not influenced by the interest rates. The unpredictable harvest is another major uncertainty that influences prices in SA – for now this is helping materially to reduce the inflation rate.
Exchange rate moves and other shocks, unconnected to the level of spending in the economy, are regarded as supply-side shocks that register in the CPI temporarily. Unless the shocks are continuously repeated in the same direction, they fall out of the CPI after 12 months. Hence monetary theory tells us these are temporary forces acting on prices that should best be ignored by monetary policy.
Interest rates will however influence spending in the economy in a predictable way and are called for when there are excess levels of demand. This is usually accompanied by increases in the money and credit supplies. This is far from the current case in South Africa, where spending and credit growth remains subdued and hence calls for lower interest rates, perhaps much lower.
This all raises the rationality of interest rate settings in SA that react to forces that are impossible to predict with any confidence – for example the exchange rate, over which monetary policy has no influence. Supply side shocks on inflation in SA have (wrongly in my opinion) allowed to influence interest rate settings with all inflationary forces treated as the same threat by monetary policy, regardless of its provenance. This has been the case since early 2014 in response to rand weakness and a drought that both forced prices higher. But a positive supply side shock on prices of the kind South Africa is now benefitting from (a stronger rand as well as a much improved harvest) is surely to be acted upon with urgency. Waiting to see what will happen to the exchange rate is simply to prolong the agony of tolerating slow growth for no good anti-inflation reason.
And in response to the inevitable Reserve Bank retort that failure to act on inflation will lead to more inflation expected and hence more inflation to come, I would suggest that this theory, on which the Reserve Bank relies so heavily to justify higher interest rates, has little support from the evidence of the inflationary process in SA. Inflation expectations have remained persistently high, as has the expected weakness of the rand, even as inflation itself has moved higher or lower. Evidence furthermore suggests that inflation expected, if anything, follows rather than leads realised inflation.
More important, it is highly unlikely that inflation expected can decline with the persistent market view that the rand will weaken by 6% p.a. or more each year for the next 10 years, as has been the persistent trend. Inflation expectations have proved very hard to subdue, despite the determination of the Reserve Bank to act against inflation, without obvious benefits for the inflation rate and regardless of the negative impact higher interest rates have on the subdued growth in demand.
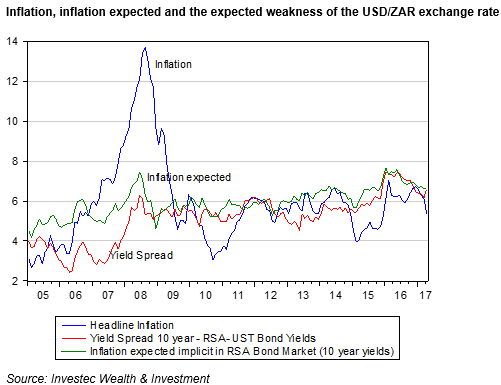
Inflation expectations are measured below by the difference between nominal bond yields and their inflation-linked equivalents of similar tenure. The expected path of the USD/ZAR is measured by the difference between RSA bond yields and their US Treasury equivalents. These are compared to actual inflation in the graph below. As may be seen, inflation has been far more variable than inflation expected or the expected weakness of the rand. For the record, since 2005, measured at month end, the headline inflation rate has averaged 5.9% p.a, with a standard deviation (SD) of 2.2% p.a. Inflation expected has been much more stable, while it also averaged 5.9% p.a with a reduced SD of 0.71% p.a, while the spread between 10 year RSA yields and US Treasuries – a very good proxy for the extra cost of buying dollars for forward delivery – averaged 5.25 p.a. at month end with a SD of 1.2% p.a.
It will probably take an extended period of low inflation to reduce these expectations of inflation and rand weakness. Sacrificing economic growth for an inflation rate that has proved largely beyond the control of the Reserve Bank has never seemed to me to be good monetary policy. And it makes even less sense now that the inflation outlook has improved, even if this should prove temporary. 31 May 2017
From underperforming BRICS to the now less Fragile Five. Lessons for Brazil and SA
We can recall the days when the BRICS, Brazil, Russia, India, China and, a later inclusion, South Africa, were the darlings of the commentators. Their growth prospects were fueled by the super-cycle of commodity prices and improved equity markets – until the global financial crisis of 2008 intervened.
Commodity prices and emerging market (EM) equities recovered strongly after the crisis, but then in 2011 fell away continuously, until mid-2016. This took down the exchange value of EM currencies, including the rand, with them and forced inflation and interest rates higher, so adding further to the BRIC misery.

The economic and political reports out of Brazil in recent days are particularly discouraging. Its current constitutional crisis and likely upcoming elections will make it more difficult to enact the economic reforms that could permanently improve the economic prospects for the country. The trajectory of its social security expenditures and lack of revenue from payroll taxes will take the social security funding deficit, currently 2.4% of GDP, to 14% by 2022, according to the IMF. But these fiscal problems are compounded by a recession that shows little sign of ending.

The disappointments of the BRICS moreover forced attention on the “Fragile Five” of Turkey, Brazil, India, South Africa and Indonesia. These are economies with twin deficits – fiscal and current account of the balance of deficits, that makes them especially vulnerable to capital flight. Some investors have found consolation in this slow growth. Slow growth has seen these current account deficit decline markedly. In the case of South Africa the current account deficit – the sum of exports less exports, plus the net flow of dividends and interest payments abroad – has declined markedly from near 7% of GDP in 2013 to less than 2% in Q4, 2016, and is likely to have fallen further since.

These trends have made the SA economy and its fragile peers appear less dependent on inflows of foreign capital, thus making the spread between the yield on its bonds and safe-haven bonds attractive enough to attract inflows of capital and provide support for the local currencies. In mid-2016 the declining trend in EM exchange rates and commodity prices (not co-incidentally) was reversed, as was the outlook for inflation.
These reactions however neglect the more important vulnerability of the SA and the Brazilian economies to persistently slow growth. That is the danger slow growth presents for social stability. The capital account inflows no more cause the current account deficits, than the other way round. The force driving both sides of an equation is an equality is the state of the domestic economy and its savings propensities. In the case of SA, Brazil or Turkey, should the growth rate pick up, so will the current account deficit and the rate at which capital flows in. If the capital proves expensive or unavailable, the exchange rate will weaken, inflation will rise, the prospective growth will not materialise and the current account deficit will remain a small one.
Were Brazil or South Africa to adopt a mix of policies that reduces risks and improves prospective returns on capital, the long-term growth outlook will improve and their economies will grow faster. And they will have no difficulty in attracting the capital to fund the growth. Growth could lead and capital will follow in a world of abundant capital.
South Africa and Brazil have more in common than slow growth and fiscal challenges. They have similar degrees of political difficulty in adopting growth-enhancing reforms. The best they can now do, absent a credible growth agenda, would be to aggressively lower short term interest rates. This would improve the short term growth outlook and help attract capital and, if anything, help rather than harm the exchange rate. It remains for me a source of deep frustration that the SARB remains so reluctant to take the opportunity to improve growth rates, without any predictable impact on inflation. 26 May 2017
Get South Africa Going
My book has been published. ( See below for details ). It should be available in the book stores and on-line very soon. The chapter outline included in the Foreword is shown below.
Get South Africa Growing
Jonathan Ball Publishers
Johannesburg and Cape Town
Brian Kantor
Published in South Africa in 2017 by
JONATHAN BALL PUBLISHERS
A division of Media24 (Pty) Ltd
PO Box 33977
Jeppestown
2043
ISBN 978-1-86842-763-5
ebook ISBN 978-1-86842-764-2
Chapter outline
In the first chapter, I address the current very unsatisfactory state of the South African economy seen as a whole – the macro environment – and what might be done to improve it. I accept that the global economy has made it more difficult for our economy to grow faster in recent years and I consider what more favourable cyclical forces might spark faster growth. But, I would argue that our problems are not with our stars but with ourselves, and while the challenge to government is to live within the taxpayer’s means, it is a call for not just more competent government but also less government.
In Chapter 2, I make the argument for market forces properly understood – why they are fair to the participants in markets while delivering the goods, services and incomes that people want more of. I make the case for the market meritocracy and why much greater reliance on the free play of market forces is called for in South Africa. As support for this contention, I refer to the proven ability of these market forces, of individuals given essential freedom and encouragement to pursue their economic interests and protection of their gains, to lift billions of people out of absolute poverty in recent years. The global economy bears witness to an unprecedentedly successful poverty relief programme that deserves greater recognition appreciation than it has received and emulation for other economies playing catch-up. The chapter attempts to do this.
Chapter 3 attempts to answer a burning question: given its well-demonstrated achievements, why do these market forces, and the business enterprises that are their prime instrument, not receive more approval? Why are they so often regarded with hostility rather than respect? Why are they regarded as opposed to the economic interests of the many they serve, thought capable of dishonesty unless proved otherwise, rather than the other way around – recognised as beneficent forces for economic progress, unless in exceptional cases proved otherwise? In doing so I challenge those with these attitudes to perhaps reconsider their motives and to change them – so that markets in this country can more easily get on with their important task of delivering goods, services, incomes and jobs in abundance.
Chapter 4 provides further exhortation to South Africans and arguments to back up this essential view of the world and how it works. It attempts to explain how we as a society would do much better to focus on the growth in incomes and wealth rather than their redistribution. The danger to the growth opportunity is redistribution – redistribution not necessarily to the poor that are deserving of assistance, but to the better-off with a strong sense of opportunity. Opportunities that can advance the economic welfare of a privileged minority but are taken at the expense of a better functioning economy and are often to the disadvantage of the objectively poor and disadvantaged. More redistribution – taking from the more successful to give to the economically less successful – inevitably follows economic growth. It has always done so, as the history of other economies reveals. But it is vital to get the sequence right and not to let redistribution – of which we already do significant amounts – get too much in the way of faster growth by undermining the incentives of enterprising and efficient individuals to contribute their skills and assets to the economy. Discouraging rather than encouraging such individuals means that they could easily decide to supply their services to other economies rather than ours.
Chapter 5 and 6 look more closely at the labour market and at policies for regulating the South African economy and encouraging competition. Chapter 7 examines competition policy in more detail and looks at why activist policies are not good for business and so the economy. My scepticism about the beneficence of such policies will be apparent, as will hopefully the reasons for my critique. I hope that public opinion will share such views and help inhibit the ever-flowing tide of more onerous regulation and more active competition policy, which discourages rather than encourages economic efficiency in a world of continuous innovation that effectively threatens what are temporary powers to control markets.
Chapter 8 shares insights about the all-important role played by privately owned corporations and the stock exchanges that help them raise capital and monitor their use of capital. I analyse the sources and uses of savings in South Africa and why our corporations have succeeded, on both sides of the saving–investment nexus, for their owners, who are mostly members of pension and retirement funds and collective investment schemes. I celebrate the opportunities that South Africans, the pension funds that act as their agents for acquiring wealth, and the companies that they own on their behalf have been given in recent years to diversify their wealth across other jurisdictions. I explain why being able to reduce South Africa-specific risks to the wealth of South Africans has been very helpful to the economy. This has encouraged risk-taking in South Africa rather than elsewhere. This chapter also discusses the costs and benefits of black economic empowerment (BEE).
To conclude, Chapter 9 supports the thrust of my argument by turning to measures of South African economic performance. It considers how South Africa ranks relative to our competitors in the global economy. The measures of our standing in the world are mostly very discouraging – and encouraging of reforms that would add freedom and competitiveness and enhance both incomes and standing, as well as respect for our economy as a place to do business.
The text is supplemented by shorter essays, entitled ‘Point of View’, previously published on my www.zaeconomist blog and elsewhere, that substantiate and concentrate the argument without repeating too much. If you like, they offer a short reinforcement of the message.
Brian Kantor
February 2017
Message for the Reserve Bank- act now on interest rates
When President Zuma intervenes in the Treasury alarm bells were set off in the market place and by the credit rating agencies. The danger is that fiscal conservatism in SA – the willingness to fund government spending without printing money – will be sacrificed to other interests. So making the government more prone to raising loans from the central bank rather than raising additional revenue or issuing more debt. And when a government borrows heavily from its central bank and spends the proceeds credited to it adds to the money supply. This usually brings more spending, more inflation and a weaker exchange rate in its wake.
Zuma interfered initially in December 2015. The negative impact on the SA bond and currency markets was immediate. The spread between RSA bond yields and their US Treasury equivalents widened dramatically by close to an extra 2% p.a. to 8.14% p.a. This 8% p.a became the faster rate at which the ZAR was expected to depreciate against the US dollar over the next ten years thus still more inflation expected.
The difference between an inflation protected real yield offered by the RSA and a vanilla bond of the same duration is another good measure of inflation expected. This other spread also widened on the Zuma intervention from around the 5.5% level in mid- 2015 to well over a 7% p.a (See figure 1 below).
Fig.1: Measures of expected rand weakness and inflation in SA. (Daily Data 2013-2017)

Source: Bloomberg and Investec Wealth and Investment
A further direct measure of the Zuma effect on SA risk is to examine the spread between a RSA obligation to pay interest and principle in US dollars (a so called Yankee bond) and a US Treasury obligation with the same duration. This spread indicates the compensation for carrying the risk that SA would default on its debt- also the concern of the credit rating agencies. This risk spread widened from less than two per cent p.a. on offer through much of 2014-2015, to as much as 3.6% extra demanded in early 2016 for a five year obligation. (See figure 2 below)
Fig.2: The default risk spread for a 5 year RSA dollar denominated bond. (Daily Data – 2014-2017)

Source: Bloomberg and Investec Wealth and Investment
All these measures of SA risk and inflation expected declined consistently through 2016 as the rand strengthened. That is until president Zuma replaced highly respected Finance Minister Gordhan and his deputy on March 23rd 2017. Whereafter the rating agencies downgraded SA debt and the risk spreads widened and inflation expected increased. But these reaction to the second Zuma intervention have proved much more muted. The spread on the RSA Yankee bond is now no higher than it was in 2014.
The exchange value of the ZAR – a major force acting on actual if not expected inflation – has been much enhanced – from the weakest levels of more than R16 for a US dollar in early 2016 to the approximately USD/ZAR today- a gain of approximately 20%. In figure 3 below we show the exchange value of the rand compared to the USD value of eleven other Emerging Market (EM) currencies. Not only has the ZAR strenghtened – it has gained ground against the other EM currencies similarly influenced by global events. This ratio (ZAR/EM) declined from 1.25 in early 2016 to close to 1 in early 2017 aslo indicating less risk attached to the SA economy. This ratio then was bumped up by the second Zuma interevention but again only modestly so as may be seen.
Fig.3: Zuma and the exchange value of the rand

Source: Bloomberg and Investec Wealth and Investment
Why the market place, if not the credit rating agencies, have become more sanguine about the credit worthiness of SA is a matter of conjecture. Perhaps it is because the chances of President Zuma being removed from his high office has improved?
But the current state of the markets have an important reality. The outlook for lower inflation in SA has improved significantly with a stronger rand and a much improved harvest. The case for lowering interest rates to stimulate a now prostate SA economy is all the stronger. Uncertainty about the exchange rate, over which short term interest rates have no influence whatsover, is no reason at all for the Reserve Bank to delay much needed relief for the depressed local economy. Faster growth without any more inflation or inflation expected, is surely the right option to exercise.
Making sense of low JSE returns – and identifying the conditions for better returns
Over the past 24 months the returns realised from most asset classes available to the rand investor have been well below their long term averages. Since May 2015, as may be seen in figure 1, only rands invested offshore in the S&P 500 would have provided anything but pedestrian returns.
The returns over the past 12 months are shown in figure 2. The RSA bond market provided good returns of over 12% over the past 12 months, while the other asset classes, including inflation-linked RSA bonds, generated low returns. The S&P 500 has also provided poor rand returns since May 2016. This is an understandable outcome given the strong rand (it gained about 10% Vs the US dollar over the 12months to end April 2017). The S&P 500 delivered impressive US dollar returns of 15.9% over the same period.


Figure 3 shows how the performance of the rand over the two years contrasted strongly. Significant weakness was recorded through 2015 and the first half of 2016, with a strong recovery since. The JSE as a whole moved mostly sideways independently of the rand. This is because about half the companies on the JSE, weighted by their market values, can be regarded as rand hedges and the other half defined as rand plays. The effect of changes in the exchange value the rand on the JSE as a whole therefore becomes unimportant. The rand hedges are companies whose rand values can be expected to rise with rand weakness (other forces remaining the same) and the other half, the rand plays, are those whose rand values can be expected to decline with rand weakness and increase with rand strength. This is because rand strength can be expected to lead to lower inflation and lower interest rates and additional impetus for the SA economy.
Many shares listed on the JSE have their primary listing offshore, meaning often that the SA component of their share registers is a small one, as is the case with the dual or multiple listed British American Tobacco or AB Inbev, or the resource companies, BHP-Billiton or Glencore. In such cases the translation of their US dollar value – determined offshore – into rands at prevailing exchange rates is automatic and maintained by arbitrage operations in both markets. And so a weak rand translates automatically to higher rand values for these essentially offshore companies and vice versa when the rand strengthens. The same translation effect is at work for those companies whose primary listing is on the JSE but whose shares are held largely offshore. If so the dollar value of these shares may be regarded as being determined off shore and automatically translated into rands at prevailing exchange rates.
The largest company included in the JSE All Share Index, with a weight of about 17%, is Naspers and may be regarded as falling within this category. Thus a strong rand, up say 20% on a year before, as has been the case in early 2017, means that Naspers must have gained more than 20% in US dollars to provide positive returns for a rand investor. This becomes a very demanding target for US dollar returns that most companies would be very hard pressed to overcome. Most of the resource companies listed on the JSE however gained more than enough extra dollar value in 2016, to more than overcome the effects of a stronger rand.
In figure 4 we show the rand value of 14 stocks listed on the JSE (in this grouping all equally weighted) that we regard as global consumer and UK property plays, compared with the US dollar / rand (USD/ZAR) exchange rate since early 20161. They are global economy plays because their revenues and earnings are derived predominantly offshore. Their fortunes do not depend much on the state of the SA economy. Some of the companies on the list did poorly both in rands and in US dollars. They performed poorly for a variety of their own company-specific reasons. We show the sharp decline in trailing earnings per share (market weighted) of this grouping of global economy plays in figure 12. These companies account for a very significant proportion of the market value of the JSE, perhaps as much as 40%.

In figures 5 and 6 we compare the performance of this JSE global 14 with the S&P 500, with both groups of companies valued in rands. The JSE global 14 matched the S&P 500 well until approximately October 2016, where after, until year-end 2016, the S&P enjoyed a period of marked outperformance. More recently the two groups of companies have again been following a similar path.

The largely sideways movement of the JSE Index since 2015 is moreover consistent with the downward direction of index earnings per share over the same period. Figure 7 shows how JSE All Share Index earnings per share, measured in rands or US dollars, had lost 20% and 30% of their early 2015 levels by mid-2016 after which a recovery in earnings ensued. A time series extrapolation of these recent trends would suggest earnings per share at only 10% higher than their 2015 levels, by mid-2018.
A similar pattern of declines in earnings and their incipient recovery may be observed of the JSE sub-indices for financial and industrial companies and for JSE listed resources. See Figure 8 and 9, where the particularly sharp reduction in resource earnings and their subsequent recovery may be observed.


The trend in JSE earnings has not been supportive of higher share prices. The trend in share prices and earnings per share has closely followed the trend in earnings as we show in figure 10. Something of a re-rating of the JSE – given an expectation of improved earnings to come – occurred in 2016, making the JSE appear demandingly valued by its own standards. The recent recovery in earnings, especially resource earnings, has meant a reduction in the PE multiple (see figure 11).

In figure 12 we break down further the earnings of some of the major companies listed on the financial and industrial indices of the JSE. We divide companies into the same global plays and the SA interest rate plays. In this grouping the earnings per share are weighted by the market value of the companies. The earnings disappointments of 2015-2016 have come from among the ranks of the global plays, while the SA economy plays have continued to grow their earnings per share slowly, despite the weakness of the SA economy.

A number of these global plays have fallen from their once lofty perches for a variety of company-specific reasons that have had little to do with the behaviour of the rand. As we show in figure 13, the worst of the global companies on the earnings front have been MTN and the UK property counter, Capital and Counties. Aspen, Mediclinic and Richemont have also suffered significant declines in their rand earnings per share since 2015 – despite assistance form a generally weaker rand since 2015. Were it not for the continued success of Naspers, with its growing market value and ever larger share of the JSE, JSE index earnings per share would have presented a still weaker state.

These underperforming global companies will benefit from better management as well as a stronger global economy. A stronger global economy is more likely to be associated with rand strength r than rand weakness. Such rand strength in 2016 became a headwind for rand investors. Though it should also be said that their SA shareholders are well hedged against rand weakness associated with SA political developments of the Zuma intervention kind, as they were until mid-2016 assuming the absence of value destroying company specifics. They are even more likely to provide good returns when rand weakness (for SA reasons) is combined with global economy strength, provided again they do not run into further problems of their own making.
Rand strength for SA-specific reasons is something of a headwind for these global companies, as was the case in 2016 when the rand recovered both because the outlook for emerging market economies and their currencies was improving (and because it appeared wrongly that President Zuma’s willingness to interfere in the SA Treasury was contained). The current value of the rand, around the R13.30 level to the US dollar, still appears to depend to some degree on the chances that President Zuma will be forced out of office.
The earnings of SA economy plays benefit from rand strength, provided it is accompanied by less inflation and lower interest rates. So far they have been subject to a degree of recent rand strength, but as yet this strength is unaccompanied by lower interest rates. Without lower interest rates, a cyclical recovery of the SA economy, from which SA focused business and their shareholders stand to benefit, will not occur.
The Zuma interventions in fiscal policy have reduced the degree of rand strength made possible by an improving global economic outlook. It has moreover undermined the confidence of SA business and households in their economic prospects and their willingness to spend more. Yet the outlook for lower inflation has improved, given the partial recovery of the rand and lower food prices. The case for cutting short term interest rates in SA has therefore become more compelling. Perhaps there is enough of a case for the Reserve Bank to do what it can for the real economy by lowering interest rates. Its influence over the value of the rand remains limited, as one can only hope its Monetary Policy Committee finally realises. The case for rand plays on the JSE is the case for lower interest rates and at worst rand stability at current levels. The case for the global plays would have to be based on an improved outlook for the global economy, ideally for their SA shareholders, accompanied by rand weakness for SA reasons. But as important will be the ability of the managers of the fallen angels to restore growth in US dollar earnings.
1The fourteen companies included in this grouping with equal weights are British American Tobacco, Richemont, Mediclinic, Aspen, Steinhoff, Reinet, MTN, Naspers, Sappi, Intu, Capital & Counties and Netcare
Why property rights matter – and could matter more
I recently asked a class of senior law students what they thought the purpose was of all the laws that protect property (wealth or assets or capital by other names) against theft, fraud or seizure, including by the state, and the purpose of the many laws that facilitate the exchange of assets.
The students did have a sense of the fairness of such laws protecting owners. They did not recognise the importance of the economic incentives at work: that unless rights to property were exercised, there would be little incentive to create wealth; to save, to build and to sacrifice immediate consumption for later benefits for society at large.
Who would wish to save up to build a house or a business or improve a tract of land, providing goods, services and incomes to others, if someone more powerful could move in and take over? But I also pointed out that the value of assets owned can be severely damaged by regulations of their use (perhaps of net benefit to society at large) for which compensation is seldom allowed by the courts. I spoke of the proverbial little old lady and her children whose only meaningful asset is a house, whose value is much diminished by declaring it of historical interest – for which compensation could be offered but in practice is never offered or awarded.
I made the point that property rights or their absence (or the dangers of regulation of the use of assets) would be reflected in the market value attached to such always vulnerable assets. Threaten for example a wealth tax or a mining tax and the value of assets and the incentive to create wealth will be undermined in ways that are very likely to harm the poor.
But the state not only has the power to take wealth, it also exercises the power to take from wealth or income from some and give it to others. South Africa has supplied very large numbers of houses to essentially lucky recipients – lucky because the waiting lists for gifts of this value are very long and will never be exhausted. The numbers of such interventions in the housing or accommodation space are not known with certainty, nor is it fully known what happens to the houses once handed over.
The important question is how should the value of these gifts of housing or land or low rentals be best protected by law? Protected surely best by full rights of ownership attached to them, as is the wealth protected when created through the sacrifice of consumption or the sweat of a brow. Living in a potentially valuable home without food on the table has little logic to it. Effectively exchanging the house for more food and cheaper informal shelter may be a sensible choice to make. Leasing out and combining small parcels of farming land can provide a better standard of living for its new owners than subsistence farming on it.
Our laws that most unfortunately restrict property rights – for example that only allow the transfer of RDP homes after eight years of occupancy or prevent formal rental contracts – accordingly leads to widespread losses and waste. To houses that exchange hands at far less than their cost or potential and that can never form part of any inheritance or tax base. To potentially valuable farms that become wastelands.
We should make all transfers of government assets to private ownership immediately come with full rights of ownership. And we should be making every effort to convert currently fallow government owned and tribally managed land to private ownership with full rights, whoever are the initial beneficiaries. This will then allow the market place take over to make the best use of these assets. The impact on the economy will be as favourable for the creation and preservation of wealth and the generation of extra incomes in SA, as secure property rights always prove to be. 28 April 2017
When Zuma goes
Click here for a shorter version of this article
There will be good economic reasons for rejoicing should he go. The rand would strengthen – it would move back into line with its emerging currency market peers. Today this would have meant a USD/ZAR of approximately R12.6. Yesterday, April 12th a day of protest and a day when the probability of Zuma going sooner rather than later improved, saw a basket of EM currencies gain seven cents vs the weaker USD while the ZAR gained 34 cents, indicating less SA specific risk priced into the rand.
If the rand maintains these better values lower inflation will follow the lower costs of imports and the lower prices for exports and would bring lower short term interest rates in its wake. Cheaper than otherwise goods and services and credit would encourage households to spend more- as would the higher house prices and equity in homes that accompany lower mortgage rates and a more hopeful outlook for South Africa. And the firms that supplied them would be much more inclined to add, rather than contract capacity and hire more rather than fewer employees, as they are now doing. The SA business cycle would turn up rather than down.
The yield on longer dated RSA debt would also tend to go back to where it was, reducing the cost of servicing our national debt –easing the burden on SA taxpayers and opening up the possibility of more help for the poor and improve the prospects of growth friendly, lower tax rates. The first Zuma attempt to control the Treasury in December 2015 took the yield on RSA 10 year bonds from 8.5% p.a in early December that year to about 9.6% by early January 2016. This move also widened the spread between RSA and US debt by about the same 100bp ( see figure below) from about 5.7% p.a to 6.7%. The latest Zuma intervention in the Treasury has seen this risk premium rise further, but not dramatically, from a still unsatisfactory 6.46% level in early 2017 to the current 6.6% p.a level.
The ZUMA factor driving SA risk
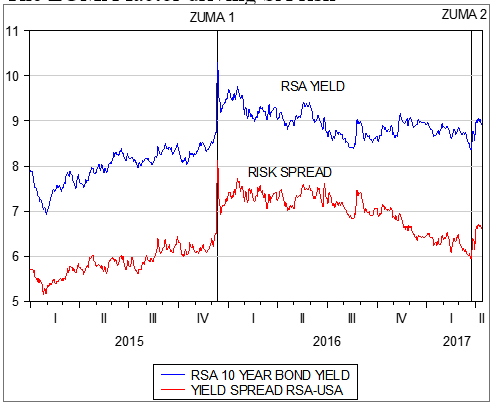
Source; I-net Investec Wealth and Investment
This spread may be regarded as the SA risk premium, the extra returns in rands, all South African investments have to be able to offer to justify their viability – in addition to their covering the additional business risks associated with a particular enterprise. This extra return is also the rate at which the rand is expected to depreciate over the next ten years. And the weaker the rand the more inflation expected. The Zuma interventions have understandably have resulted in the rand being expected to lose dollar value at a faster rate and so also, in a consistent way, to increase the expected inflation rate. The market place understandably expects a weakened Treasury to be less able to control government spending and less conservative in how such spending is funded. That is less able to raise taxes and less willing to pay ever higher rates of interest on its debts and so more inclined to print money, an approach that would be clearly inflationary.
Another way of measuring risks would be to convert the calculation of required returns and risk into to much less inflationary USD. The yield on US dollar denominated debt issued by the SA government provides an appropriate bench mark for measuring required risk adjusted returns on South African assets. As we show below these dollar yields rose significantly from around 3.6% in early 2015 to as much as 5.12% p.a. by year end. Since then this rate has receded but increased by a significant 36bp since mid- February. The cost of insuring SA 5 year dollar denominated debt against default, an accurate measure of real sovereign risk has followed a similar pattern rising from 1.82% p.a at its lowest in 2017 to the current 2.15% p.a. That is when converted into USD an investment in a South African asset would be required to return over 2% p.a. more in USD than an equivalent US investment to justify its value.
Zuma risk measured in USD
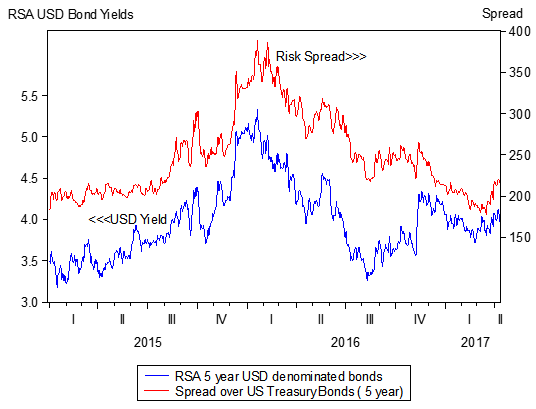
Source; Bloomberg, Investec Wealth and Investment
More risks demand higher returns (sometimes described as the hurdle rate capital raisers have to leap over) and the higher the required returns the fewer investment projects will qualify – to the grave disadvantage of the economy and its growth prospects. The object of economic policy should be to reduce such risks rather than to raise them- something the Zuma presidency has clearly failed at.
These required returns that add business risk to sovereign risk may also be regarded as the discount rate used to present value any flow of income from businesses or government agencies. The higher the discount rate attached to SA assets the less they are worth. Adding risk makes SA immediately poorer as well as undermining their income prospects as less is invested in SA projects that could add to incomes and demands for labour.
Yet given the reactions of the credit rating agencies that have down rated SA credit indicating a higher probability of default on our debt these market reactions as we have identified them must be regarded as surprisingly subdued.
The rand, and the market in RSA bonds, clearly benefit to a degree from the prospect that Zuma might not survive the campaign to remove him. Were Zuma certain to stay rather than possibly go, we would be facing even more risk aversion more inflation expected, higher interest rates and a very likely recession as confidence in the prospects for the SA economy ebbed away.
Were Zuma to go the benefits could extend well beyond the promise of a revival of fiscal rectitude and less inflation and lower interest rates. It would offer the prospect of a radical economic transformation. By which I mean the cleaning of the Aegean stables that the State Owned Companies (SOC’s) have become. It would not require any Hurculean effort to do. A few investment bankers could do the job of converting the SOC’s into ordinarily valuable and well managed business. So converting them into assets from their current state of very expensive and potentially ever larger liabilities, that SA tax payers and consumers have to cover. Converting these burdens into private businesses that will compete for their custom, that will be run efficiently and deliver their goods and services at lower competitive prices – as business have to do to survive the market test would be a large plus for South Africans. And they would become taxpayers rather than incur vast contingent liabilities that damage our credit rating and raise our costs of finance.
Can any SA seriously believe that these SOC’s are essential to the purpose of developing the SA economy? Or fail to understand that their actions are driven by the narrow interests of their managers and employees and what their suppliers can extract from them. Their monopoly powers that make this behaviour possible need to be removed by breaking them up into smaller units by selling off their assets to a variety of owners and operators. And the capital to fund these purchases will be abundantly available from domestic and foreign capital providers at market determined values.
The proceeds from their privatization could be used to pay of much of SA’s debt and dramatically reduce the interest burden of serving it and open up the prospect for genuine poverty relief. This transformation – turning great weakness into strength – would help raise the growth potential of the SA economy – and truly transform the economic prospects of all South Africans
When Zuma goes
There will be good economic reasons for rejoicing should President Jacob Zuma relinquish his post in the near future.
The rand would in all likelihood strengthen and would probably move back into line with its emerging currency market peers. Today this would have meant a USD/ZAR exchange rate of approximately R12.60.
Lower inflation will follow a stronger rand and bring lower short term interest rates in its wake. Cheaper goods and services and credit would encourage households to spend more, as would the higher house prices and equity in homes that accompany lower mortgage rates and a more hopeful outlook for South Africa. And the firms that supplied them would be much more inclined to add capacity and hire more employees. The SA business cycle would turn up.
The first Zuma attempt to control the Treasury in December 2015 took the yield on RSA 10 year bonds from 8.5% p.a in early December that year to about 9.6% by early January 2016. This move also widened the spread between RSA and US debt by about 100bps from about 5.7% p.a to 6.7%. The latest Zuma intervention in the Treasury has seen this risk premium rise further, but not dramatically, from a still unsatisfactory 6.46% level in early 2017, to the current 6.6% p.a level.
This spread may be regarded as the extra returns in rands that South African investments have to be able to offer to justify their viability – in addition to their covering the additional business risks associated with a particular enterprise. This extra return is also the rate at which the rand is expected to depreciate over the next ten years. The weaker the rand, the more inflation expected.
The cost of insuring SA five year, US dollar-denominated debt against default, an accurate measure of real sovereign risk, has followed a similar pattern, rising from 1.82% p.a at its lowest in 2017 to the current 2.15% p.a. When calculated in US dollars, an investment in a South African asset would be required to return over 2% p.a. more in US dollars than an equivalent US investment, to justify its value.
Greater risks demand higher returns and the higher the required returns, the fewer investment projects will qualify – to the grave disadvantage of the economy and its growth prospects. The object of economic policy should be to reduce such risks rather than to raise them, something the Zuma presidency has clearly failed at. Yet, given the reactions of the credit rating agencies, which have downgraded SA credit (indicating a higher probability of default on our debt), these market reactions must be regarded as surprisingly subdued.
The rand, and the market in RSA bonds, clearly benefit to a degree from the prospect that Zuma might not survive the campaign to remove him. Were Zuma to go, the benefits could extend well beyond the promise of a revival of fiscal rectitude and less inflation and lower interest rates. It would offer the prospect of a radical economic transformation. By this, I mean the cleaning of the Aegean stables that the state-owned companies (SOCs) have become. It would not require any Herculean effort to do.
A few investment bankers could do the job of converting the SOCs into a number of ordinarily valuable and well-managed businesses that compete with each other. They would be run efficiently and deliver their goods and services at competitive prices – as business have to do to survive the market test.
Can anyone seriously believe, in light of the evidence, that these SOCs with monopoly powers are essential to develop the SA economy? Or fail to understand that their actions are inevitably driven by the narrow interests of their managers and employees and what their suppliers can extract from them?
The proceeds from their privatisation could be used to pay off much of SA’s debt and dramatically reduce the interest burden of serving it, thus opening up the prospect for genuine poverty relief. This transformation – turning great weakness into strength – would help raise the growth potential of the SA economy – and truly transform the economic prospects of all South Africans. 18 April 2017
On Eskom: act soon or it will be too late to get back our investment
One offers commentary on matters of broad SA national interest that might helpfully respond to and benefit from the analysis and arguments raised. It is a tradition that – perish the thought – goes back to colonial times.
The notion that a concern for economic efficiency and economic development in the interests of society at large will prevail in the policy choices SA makes and the economic direction we take, has alas, become increasingly suspect. No other set of policies will be as important for the ability of our economy to raise future incomes, output and employment and to compete globally as taking the right path for delivering energy. Yet following the tempting money trail open to a few potential beneficiaries of energy procurement as currently practiced is much more likely to predict the future of energy production and consumption in SA than any objective analysis can do. But however objective such analysis could be it is still very unlikely to make the right choices- given the unpredictability of the future of energy. The best the government of SA and its agencies – Eskom and the municipalities that have monopoly powers over the generation and distribution of electricity in SA – could do for SA, would be to get completely get out of the business as soon as possible and on the best possible terms. Terms that are very likely to deteriorate the longer they delay their exit.
The reason for getting out and handing over the responsibilities to the fullest possible set of competing privately owned generators and distributors is that the future of energy is impossible to predict with any degree of confidence. Therefore the decisions to be taken in this regard by a government monopoly (with its narrow interest as a monopoly even an honest monopoly) are almost certain to be the wrong ones from which the society and economy will suffer permanent damage.
The most efficient, lowest cost methods of delivering energy in the future cannot be known. It will be discovered in the market place as all such discoveries are made. Discovered, as will be the case with every product and service to be delivered over the next thirty years, by trial and error in the market place, by constant experimentation by owners and managers with their open capital at risk where winners may be rewarded handsomely and losers punished severely with the loss of their capital. It may well turn out to be a future where the cheapest energy is delivered off-grid, making large capital intensive generating plants generating electricity with coal, uranium or gas redundant in time – but just how much time?
Permitting and encouraging such a market place in energy to fund the future demands for electricity on competitive terms , is the right path for SA to take. Adding further highly capital-consuming power plants using whatever kind of input, is surely a most dangerous step for the SA tax base or electricity consumers to have to support. Such plants supported by monopoly powers as were granted their developer Eskom fifty years ago, were arguably then the right way forward. They delivered satisfactory outcomes until recently, in the form of what were globally competitive electricity prices. But they are surely not the way forward today given the risks that technology poses and especially since Eskom itself has become close to bottom of its class of electric utilities on efficiency criteria – as judged by a recent study commissioned by the Intensive Electricity Users Group in SA – who have much at stake.
Eskom has proved very good (predictably so given its monopoly) only at providing employment and generous employment benefits as well as it would appear generous terms to its suppliers – at the expense of its users – who could have proved much better at delivering employment, profits and taxes (with lower electricity costs) including benefits of energy intensive beneficiation of metals and minerals.
There is little time to be lost if the SA tax payer is to recover its investment in and debt guarantees provided for Eskom given the uncertain future. If the plant and equipment were to be privatised soon, they might well fetch a price that would pay off the debts and avoid subsequent white elephants. And help open up, perhaps only gradually, a competitive market for electricity where different owners of generating capacity could compete for customers through the privately owned grid, treated perhaps as a regulated private utility.
The plants Eskom is now mothballing could attract bids and be kept running at a low enough asking price. And help produce electricity at highly competitive prices, enough to cover operating costs and a return on capital, that could perhaps, for a while, keep alternative electricity generators at bay, long enough for SA to get its money back.
*The views expressed in this column are those of the author and may not necessarily represent those of Investec Wealth & Investment
Stock market indices: Swix in the mix
The very large weighting of Naspers in leading indices like the JSE Swix and the JSE All Share Index has major implications for active and passive investors alike. Investors need to be aware of what this means for the risk attached to their portfolios.
The original reason for constructing a stock exchange index was simple: to provide a statistic that summarised the price performance of the average company listed on a widely followed stock exchange. The calculation of such an average or index is supposed to represent the general direction of the equity market.
The most famous and oldest of the indices that tracks share prices on the New York Stock Exchange, the Dow Jones Industrial Average (DJIA), simply aggregates the US dollar share prices of the 30 largest US companies. The higher the prices of the individual shares included, the higher the DJIA and vice versa. The S&P 500 was introduced later and has become the most important of the global indices. In contrast with the DJIA, the S&P 500 tracks the market value of the 500 largest companies listed on the New York stock exchanges. The share price moves of the largest companies carry the most weight in the index and move the index proportionately.
Indices that attempt to summarise equity market performance, however, have much more than simply an informative role. They are also widely used to measure the ability of fund managers who actively manage their share portfolios and compete with other managers for assets to manage. Relative, as well as absolute price performance and returns, matter to both fund managers and their clients.
The performance (total returns in the form of price changes plus dividend income) of the funds they manage are not only compared to those of their rivals, but also to some relevant equity index. The ability to generate returns ahead of the benchmarks – the returns (theoretically) generated by the index (positive or negative) – becomes their measure of success or failure. Conventional wisdom now dictates that index-beating returns, beating the market (after fees), is the only reason for active management. We will show why this is incorrect.
A passive approach
Because of the difficulty that the average equity fund manager faces in trying to perform better than the index, there has been a large move to so-called passive equity investment strategies. Investors simply track some index by dividing their equity portfolios in exactly the same proportions (weights) as the shares included in the index.
Index tracking funds (under the banner of the so-called exchange traded funds or ETFs) have been created in large numbers by different fund management houses to facilitate such an investment strategy. This process generates no more or less than index-equivalent returns for the investor. The advantage for the investor is that since no knowledge or experience of the market place is needed – only a suitably programmed computer – the fees charged for the service (usually measured as a percentage of the assets under management) can be far lower than the fees typically paid for actively managed portfolios. These latter fees are charged to cover the higher costs of active managers, for example the salaries of the stock pickers and their analysts, as well as the trading and marketing costs incurred by the firms.
The ETFs and their originators and managers are therefore taking full advantage of highly efficient and competitive equity markets, without contributing to the process of price discovery. It is this efficiency in processing information about companies and the economic and political forces that will influence their future profitability (and their current value) that makes the share market so difficult to beat. Such information comes without expense for the passive investor.
Another expensive responsibility incurred by active shareholders is the surveillance of the managers of the companies in which they invest client wealth. This responsibility and the accompanying costs are largely avoided by passive investors. Good corporate governance demands that shareholders cast their votes on corporate actions by exercising proper diligence, which has a cost. Engaging actively with company managers is essential for active investors but not for index trackers.
The index trackers are free riders on the investment bus, paid for by others. The proportion of funds that would have to be actively managed to make for a well-informed, efficient marketplace and to keep the investment bus rolling cannot be known with any degree of certainty. If all investors simply followed rather than led, the market would be full of valuation anomalies, from which only a few active investors could become fabulously wealthy by exploiting the valuation gaps.
The relevance of risk
Prospects like these are what encourage active investors to take risks. Think of hedge fund managers who take large risks in exchange for prospectively (not always realised) large returns. They also add helpful liquidity to the market that facilitates trading activity by risk averse investors. It is the expected distribution of returns, the small chances of a big win on the markets and the potential to achieve long run returns sustained well above average market returns that explains some of the preference for active managers. A select few of these (though we never know which few) will always beat the market by a large and sustainable margin.
This raises an all-important issue. Investment decisions and the make-up of investment portfolios are not determined only by prospective returns. The risk attached to such prospective returns is at least as relevant for the average wealth owner saving for retirement or a rainy day. This is the risk that the portfolio can lose as well as gain value. Stock market indices and the ETFs that track them can be more or less risky, depending on their character and composition. An essential requirement of a low-risk equity portfolio, actively or passively managed, is that it should be well diversified against risks that individual companies are exposed to.
This is achieved by spreading the portfolio among a large number of shares, none of which should account for a large proportion of the portfolio. The threats to the value of a share of a company that comes from adverse circumstances beyond the control of all company managers – i.e war, revolution, taxation, expropriation, regulation, inflation and financial crises – can only be mitigated by diversifying the wealth owners’ total portfolio across different asset classes, such as bonds, cash or real assets – or different jurisdictions. Index-tracking ETFs can simulate a particular equity market or well traded sector of it. But designing an optimal, risk-aware total portfolio – how much equity or other risks a wealth owner should assume – calls for more complicated considerations.
An important consideration for any investor tracking some equity market index is the issue of how well diversified the index being tracked is. A further consideration is which equity markets should be tracked given their very different risk profiles and how they are constructed.
The S&P 500 is very clearly well diversified against US company specific risks. The JSE All Share Index, by contrast, is not well diversified, nor is the JSE Top 40 Index nor the JSE Shareholder Weighted Index (Swix), which has largely superseded the other JSE indices as the benchmark for measuring the performance of SA equity managers. The Swix is weighted by the shares of the company registered by the JSE itself, as opposed to shares registered for transfer on other exchanges where the company may also have a primary or secondary listing. The larger the value of the shares registered by the JSE (Strate), the larger the weight that company will be allocated in the Swix. It should be understood as a measure of the proportion of the shares registered for transfer in SA, not necessarily of the share of the company owned by South Africans.
How diversified is your index?
The largest company currently included in the S&P 500 Index is Apple, with an S&P 500 Index weighting of only about 3%. The largest 100 of the S&P 500 account for about 60% of the index. In strong contrast, the largest company included in the market capitalisation-weighted JSE All Share Index in November 2016 was Naspers, with a weight of 17.14% in the Index. The next largest company included was British American Tobacco, with a much smaller weight of 4.31% followed by Sasol with 4.08%. The largest 10 companies included in the All Share Index now account for as much as 42.6% of its weighting – it’s clearly a much less diversified index than the S&P 500. Until its recent takeover, SABMiller was accorded a large weight in the All Share Index and the other leading indices. It is no longer represented and its new owner, AB Inbev, while already listed on the JSE, at the time of writing had still to make an appearance in the indices. The weights in the Swix have become similarly lopsided as we show below in figure 1. The weight of Naspers in the Swix is now even larger than that accorded to it in the All Share Index.
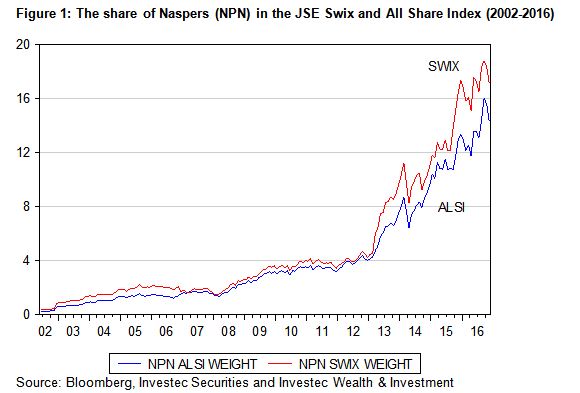
The weight of Naspers in the JSE indices has risen automatically with the extraordinary and persistent increases in its share price. Naspers shares are also all registered on the JSE, though foreign investors hold a large proportion of the company. As important for increasing the weight of Naspers in the indices has been the near stagnant value of resource companies that once had a very large weight on the JSE, but whose valuations have increased very little over the same period.
From mining to media
In figure 2 we compare the Naspers share price with that of the JSE Resources Index. The Naspers share price has increased 26.4 times since June 2002 while the JSE Resources Index has not even doubled over the same period. In figure 3 we show consequently how the weight of resources in the JSE All Share Index has declined from over 40% in 2008 to about 15% today, a lower weighting than Naspers on its own. The Swix reveals a very similar pattern, according a very high weight and importance to the Naspers share price moves and much less importance to resource companies in the direction the index takes (and so any ETF that tracks the JSE All Share Index or Swix).
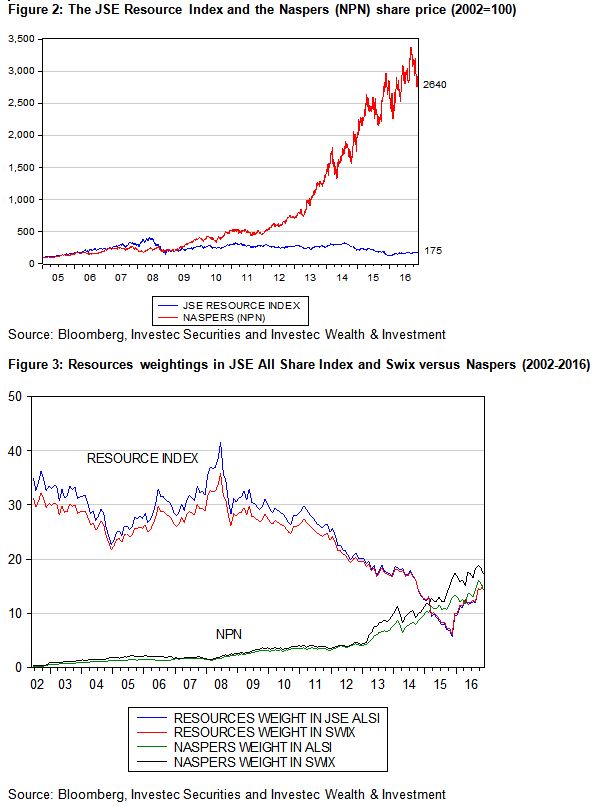
It is the rising Naspers share price and its growing and larger weight in the Swix that has made the latter the best performing of the local indices over the past 14 years. The differences in performance are significant. R100 invested in the Swix in 2002 with dividends reinvested (before fees and taxes) would have grown to R864 by November 2016. The same investment in the JSE Top 40 would only have realised R645, with the All Share Index and an equally weighted index of the 40 top companies performing somewhat better. Not only did the Swix deliver higher returns, but it did so with less volatility than the other indices, thanks to Naspers (see figures 4 and 5 below).
Clearly, choosing the right index to represent and track the JSE and measure the performance of active managers is an important decision for investors or their advisers to make. All indices are not alike and some can be expected to deliver returns with much greater risk or volatility than others.
The major JSE indices that might be used to deliver market equivalent returns by some tracker fund or others are not suitable for diversifying the specific company or sector risks that investors tracking the index will be exposed to. Naspers carries far too much weight and therefore exposes index-tracking investors to much more danger than would be appropriate for any risk averse portfolio. The same criticism could have been made of the composition of the JSE indices in 2008: they were too exposed to the specific risks that faced resource companies. Investing over 40% of an equity portfolio in resource stocks – with their well known dependence on highly unpredictable metal prices – is not something a risk averse investor would want. The same argument could be made of a current exposure to Naspers: investing up to 20% of a portfolio in one company would be regarded as highly unwise.
Wise and risk averse active managers presumably would not have allocated 40% of their portfolios to resource companies in 2008. And, they would have been much more likely to have outperformed the indices over the subsequent eight to nine years as resource valuations fell away. They would also have done even better with a larger-than-index weight in Naspers. But the risk conscious fund manager would have had to become ever more cautious about exposure to Naspers after 2013, when its weight in the index began to exceed 10%. Prudence would suggest that no more than 10% of any equity portfolio should be invested in any one company.
Given this, along with the current 18% plus weight of Naspers in the leading SA indices, active managers are therefore much more likely to underperform the index when Naspers is outpacing other stocks, as has been the case until recently. Conversely, they would outperform should Naspers lag behind the other stocks included in the index. The case for or against active management in SA should not have to depend on the fortunes of one company.
Judging the performance of a fund manager in South Africa by reference to a very poorly diversified Index like the JSE All Share Index or Swix would not be an appropriate exercise. Realised returns should always be compared to the risks that were taken to achieve those returns. The task of the active manager is not simply to aim at the highest returns for their clients, they should also be managing risk.
Recognising the risk tolerance of their clients and allocating assets and planning savings accordingly is a large part of a fund manager’s duties. This is even more important when the market (index) carries identifiable and unjustifiable risk as the JSE indices have done and continue to do. Even when the active investor has not beaten the market, the advice offered can be very valuable.
There is incidentally no risk when calculating past performance. Risks apply only to expected performance – not to known past performance. Investing in an index tracker is not a decision that can be made passively because such advice is not easily provided by a robot and is worth paying extra for, or ignored at the investor’s peril.
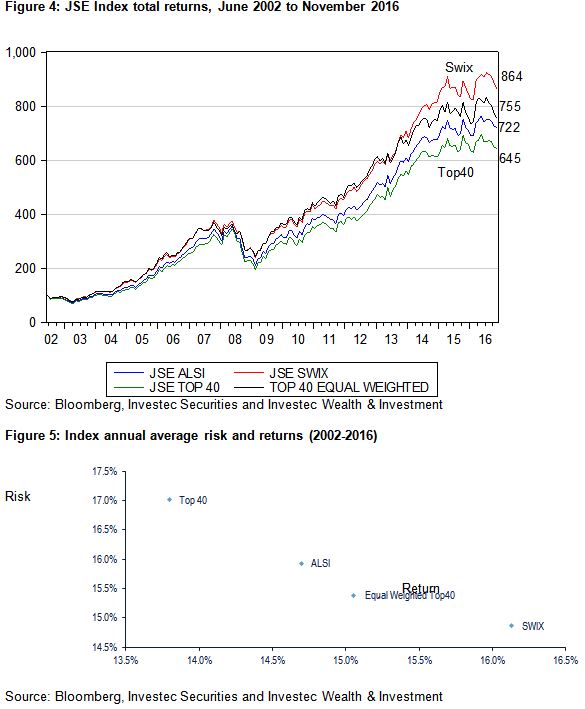
Note: I am indebted to Chris Holdsworth of Investec Securities who painstakingly undertook all the Index and return calculations that are used and represented in this report. All the indices used in the study are dynamic ones representing the indices and the sector and share weights in them, as they occurred over time.
The curious case of Curro
To reward shareholders you have to over deliver- executing well is not enough
When the CEO of a highly successful JSE-listed business aims to “reward shareholders” with a maiden dividend, as Curro CEO Chris van der Merwe has recently promised, one takes notice (Business Day 1 March 2017), particularly because the company is undertaking an impressive programme of investing in new private schools (now 128 of them) with room for the company to grow further and faster. Its plan is to open seven new campuses a year, housing 15 to 18 new schools, intended to take the company to 80 campuses and 200 schools by 2020 and to increase its enrolment from the current 47 000 to 80 000. A longer term potential market for as many as 500 fee paying schools in SA has been suggested.
The 2016 financial year was an extraordinarily good and busy one for Curro. It raised an additional R1.75bn in equity capital to fund about the same amount of capital expenditure. Since 2013 Curro has been investing over R1bn a year in expanding the business. But the growth in the operating lines in 2016 were equally impressive, so helping to maintain a superb track record in executing its business plan. Profits after tax (which was minimal thanks to large depreciation allowances) have grown from R40m in 2013 to R168m in 2016 while the growth in cash generated from operations (helped by the same heavy depreciation and amortisation) has been even more impressive, from R106m to R404m in 2016. These were excellent improvements in organically generated cash flows, but not enough to fund the large current capital expenditure programme.
Why then pay out cash to shareholders rather than continue to reinvest in additional assets? These assets appear to be able to return more than would ordinarily be required by shareholders from other investments with similar risks. Is the value added for Curro shareholders in the form of returns on their capital that are well in excess of the (opportunity) cost of such capital, not reward enough to encourage retaining cash on behalf of shareholders rather than paying it out?
After all the rewards for shareholders come in the form of total returns: capital appreciation plus dividends. And as Warren Buffett has long demonstrated, paying dividends is by no means essential for generating high total returns, indeed dividends may reduce them if paying out cash constrains the scale of value-adding investment programmes that shareholders would have great difficulty in finding for themselves.
The problem however for Curro and its shareholders and managers is that, despite its considerable operational achievements and well executed growth plans, the company has not in reality rewarded shareholders since late 2015. It was then that the value of Curro shares reached a peak of over R52 but are now trading below R48. As may be seen in the figure below, Curro shares performed spectacularly well between 2011, when they traded at R8.92 and its peak of R52.65 in December 2015, equivalent to an annual average compound return of about 42%.

Curro has run into a problem faced by many well-managed companies. That is investors come, understandably, to expect excellent operating results and re-value the company and its management accordingly. They expect more and therefore prove willing to pay up more in advance to own a share of the much appreciated company and its management.
Hence it becomes ever harder for the company to perform well for shareholders given the much more demanding starting values. Unusual share price appreciation (best measured relative to the market as a whole) of the Curro kind, realised until year-end 2015, comes with surprisingly good outcomes, not just good outcomes. Surprisingly poor performance is as likely to be punished in the share market. Under promising and over delivering is the mantra for rewarding shareholders, of whom managers will be an influential minority. Curro clearly greatly surprised the market between 2011 and 2015 as it delivered fully on its promises, but since 2015 has not been assisted by the share market, which has moved mostly sideways. In recent years it has performed well but not better than expected (though offshore investors, measuring performance in US dollars, will regard 2016 with much more favour than their SA partners, given the stronger rand, which was up by about 20% in 2016).
To address this issue, Curro has indicated not only a willingness to pay dividends but to raise debt and debt ratios to supplement internally generated cash flows to fund growth. Cash flows are still expected to increase even though they are somewhat depleted by dividends to be declared.
The company has also revealed an intention to list separately a further entity on the JSE to pursue promising opportunities in tertiary education in SA. Why then list a separate company rather than pursue this opportunity from within the existing structures?
The answer may be that to do so would raise a new opportunity (Curro reprised) to surprise the market with a successful new listing, that is to surprise investors and so achieve capital appreciation more easily than it could do within the established Curro. To expand the tertiary education offering within Curro, with its already large scale, such a build-up of tertiary capacity may not make a very obvious difference to its growth trajectory and the already highly favourable expectations of investors revealed by a demanding share price.
Therefore paying dividends to shareholders will help them fund the new company. Note that the controlling shareholder, PSG, which helped launch Curro and owns 52% of it, must support any new listing. Cash withdrawn from Curro will help PSG fund its share of the new venture that with its small beginnings could surprise the market all over again and reward its shareholders accordingly by over delivering.
It might be sensible for the minority shareholders in Curro to follow any lead given by the controlling shareholder – that is to receive cash dividends from Curro and invest in the new venture and hope to be rewarded for doing so. 15 March 2017
The SA Budget for 2017-18 – Cross road or dead end?
The Budget speech and accompanying Review refer to an economic cross roads, suggesting a new path is to be taken to accelerate growth in SA. There is little in the Budget proposals to indicate a way out of our economic dead end of persistently slow growth and ever higher tax rates. Yet both government spending (up 3% in real terms) and government revenues (up slightly more) and their share of a slow growing economy are expected to rise. The negative feedback from higher tax rates and higher tax revenues to fund an ever larger role for the SA government in the economy – on the growth outlook – is simply not recognised.

Higher income and expenditure tax rates may help to balance the books but will not do anything to revive the creative and entrepreneurial spirits of the key economic actors, the high income earners. The dependence of all South Africans on them goes much further than the taxes they pay to fund welfare benefits. They earn their higher incomes (competing with each other) by directing the markets for jobs, for essential goods and services, and for capital. And they help organise the education, training and skills that make workers more productive and capable of earning more. And they take risks with their capital, human as well as financial, to innovate in the search for better methods and better products and services that is the very stuff of economic advances. This Budget and the accompanying rhetoric will not encourage them; it is likely to do the reverse.
The scale of the redistribution of income from the best rewarded in SA to the wider community is large. One can refer in this regard to Figure 1.3 of the Budget Review that most strikingly demonstrates these outcomes. It shows that the top 10% of income earners contribute 72% of all taxes (VAT etc included) while the bottom 50% receive 59% of the benefits of government spending while contributing 4% of taxes. The middle 40% receive 35% of the benefits (valued at their cost not quality) for 25% of the taxes paid. Clearly there is little scope for further redistribution from the top 10%.

There is much scope for faster economic growth. But this will take less redistribution from the high earners and much better returns (in the form of delivering the extra skills that command jobs and higher incomes) from the large sums the government spends on education and training. It will take much better delivery by the state owned companies that perform so poorly for all but their own employees and directors. Privatisation is the obvious solution to wasteful government spending (the solution to egregious government failure) but alas is not on offer.
What is offered by the Budget as the solution is Transformation for better or for worse (depending on whether you stand to lose or benefit) and the promise of Radical Economic Transformation. By Transformation is meant, presumably, a diminished (proportionate) role in the economy for white South Africans who – presumably – still dominate (disproportionately) the ranks of the movers and shakers of the economy despite impressive transformation to date and despite the indispensability of their contributions to the economy.
It is well recognised in the Budget that economic growth is and has been transformational and that transformation without growth impossible. To quote: “Growth without transformation would only reinforce the inequitable patterns of wealth inherited from the past. Transformation without economic growth would be narrow and unsustainable…”
In a similar vein:
“If we achieve faster growth, we will see greater transformation, enterprise development and participation.”
Economic growth is transformational for SA. Faster growth would mean a greater pace of transformation as the economy would call more urgently upon the skills and abilities of all South Africans and thus help to create improved outcomes. Transformation with growth is inevitable, most desirable and most helpful to the economy. But policies for transformation that intend to handicap white South Africans, who play a crucial role in the economy, to favour a few well-placed, advantaged black South African business people will only frustrate economic growth, rather than grow it, and slow down transformation.
Can the strong rand be more than a headwind for the JSE?
South African investors on the JSE will be only too well aware that it has moved mostly sideways over the past few years. The performance of the JSE in US dollars however presents a very different picture, given the strong recovery of the rand last year. The US dollar value of the JSE, the focus of foreign investors, fell away badly in 2015 and then recovered strongly in 2016. The JSE All Share Index (ALSI) is now back to its value of early 2014 and 2015 having gained nearly 20% in US dollars since January 2016 as can be seen in figure 2. The rand itself is worth about 20% more against the US dollar – compared to February 2016.


The reason for these very different outcomes, when expressed in different currencies, is obvious enough – it is the result of rand weakness in 2014 and 2015 and its significant strength in 2016-17.
Clearly the very strong rand, up 20% year on year, represents a strong head wind for the value of shares expressed when expressed in rands. Or, in other words, for a share to have provided positive rand returns over the past 12 months, would have had to have seen its US dollar value appreciate by more than the 20% gain in the rand, a very high rate of return.
Naspers, with the largest weight on the JSE of about 17%, delivered coincidentally about a 20% increase in its US dollar value since January 2016. This was satisfactory enough, but not quite enough to provide appreciation in 20% more valuable rands.

Resource companies on the JSE did much better than the average listed company, especially from mid-year. Their US dollar value has increased by about 50% since early 2016, more than enough to provide highly satisfactory rand returns, despite the stronger rand. It may be a source of some confusion to market observers that JSE Resources could do so well, despite rand strength. In other words, Resource companies did not behave as a rand hedge in 2016: in reality they performed as rand plays (companies that do especially well when the rand strengthens).
They would have enjoyed much higher operating margins had the rand been weaker – other things remaining the same – including underlying metal and mineral prices in US dollars. But the rand was strong because underlying metal and mineral prices in US dollars had risen, by more than enough to offset the pressure on operating margins that comes with a stronger rand.
Therefore it is always important to establish the sources of rand strength or weakness. Rand weakness for SA-specific risk reasons can make Resource companies or companies with largely offshore operations effective hedges against rand weakness. Their rand values will go up as the rand weakens because they are selling into world markets where business continues as usual and so earn more rands doing so. The opposite influences are at work on SA economy companies when the rand weakens, especially on the rand and US dollar value of companies with an important element of imported components and inventories. The weaker rand not only crimps operating margins; it means higher prices and less disposable income. More inflation also is likely to bring higher borrowing costs in its wake, further depressing the demand of households and firms. Rand strength for SA-specific reasons will have the opposite effect, all other things equal, including the state of global markets, especially commodity markets. But as we have seen in 2016, other things do not necessarily remain the same for global growth reasons. Resource companies can benefit from higher commodity prices, in US dollars, and from higher metal prices in rands – even when the rand appreciates.

The increased global demand for commodities and for the shares of the companies that produce them not only increased their US dollar values. They also increased the demand for the rand and other emerging market currencies and equities generally that have a strong representation from resource companies. In the figures below we show the rand has moved in line with other emerging market currencies- represented by eleven such currencies all equally weighted in our basket. It is also shown how the rand in 2016-2017 has been stronger than its emerging market peers have been against the strong US dollar, with its recovery from a relatively weak position in late 2015.


Of particular interest is how strongly the USD/ZAR rate has been connected recently to emerging market equities. (In turn the JSE in US dollars is as usual strongly connected to the average emerging market equity as we have shown above). The rand is more than ever an emerging market equity currency. It can be assumed (Zuma permitting) that the rand will continue to move in line with them (see figure 7 below).

Furthermore, emerging market equities will continue to be strongly influenced by the behaviour of commodity prices, as they have been recently. Hence the performance of the rand and other emerging market currencies and equities (in US dollars) in the months ahead will depend on the behaviour of commodity prices. Commodity prices will reflect the pace of the global economic cycle. If this cycle continues in its upward direction, the rand could continue to gain value against the US dollar, provided SA specific risks are not elevated, as they were in late 2015.

Furthermore, if the USD/ZAR remains well supported, SA inflation will recede and short term interest rates will belatedly reverse direction. This combination of lower interest rates and lower costs of imports will be helpful to those listed business dependent on the spending and borrowing decisions of SA households. Their rand earnings will grow faster to help add rand value to their shares, perhaps even enough to offset rand strength. Headwinds from the strong rand can become tailwinds for SA economy-dependent business, as was the case between 2003 and 2008. 2 March 2017