The global economy remains hostage to a volatile US dollar
The US dollar continues to serve as the primary international unit of account and as the pre-eminent reserve currency held by central and other banks, yet the rate at which the US dollar is exchanged for other currencies remains vulnerable to large moves in both directions, so adding risks to all financial transactions that make reference to it. In figure 1 below, we show the performance of the US dollar against its developed market peers (The US dollar index or DXY). We also show the real dollar exchange rate against the same major trading partners. The real exchange rate adjusts the nominal trade-weighted exchange rate for differences in inflation rates. We discuss the economic importance of real exchange rates further below. However, it should be noted that the real and nominal US exchange rates have followed a similar pattern.
Figure 1: The trade-weighted real and nominal exchange value of the US dollar (1975=100)
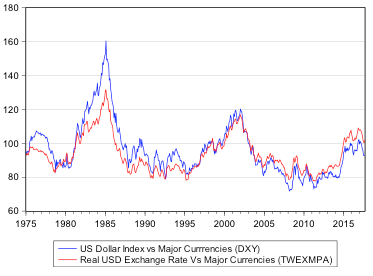
Sources: Bloomberg, The Federal Reserve Bank of St. Louis (Fred Data Base) and Investec Wealth & Investment
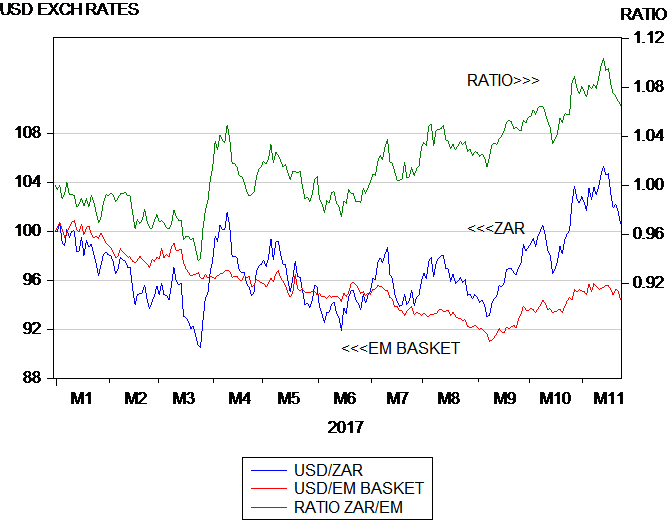
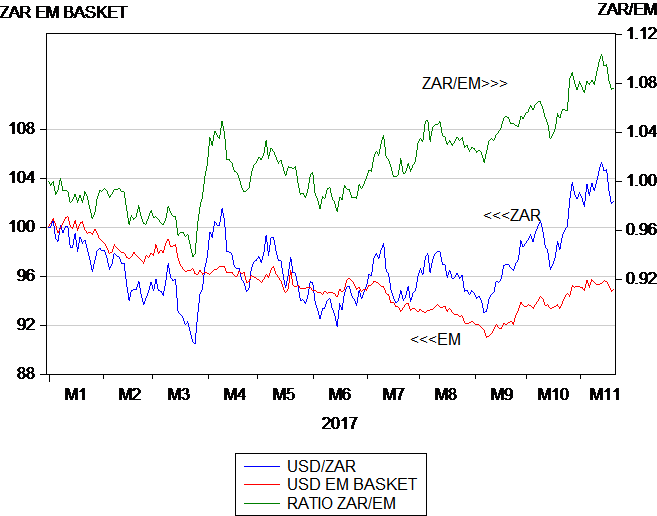
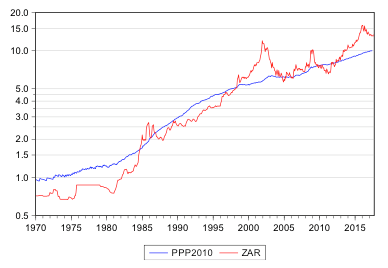
In figure 2, we show the performance of the US dollar against its developed market peers, an index of emerging market exchange rates since 2010 that excludes the rand, and the rand/US dollar rate.
Figure 2: The US dollar vs. major currencies, an emerging market currency basket and the rand (higher numbers indicate exchange rate strength), monthly data (2010=100)
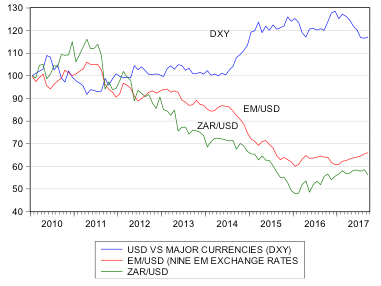
Sources: Bloomberg, The Federal Reserve Bank of St. Louis (FRED database) and Investec Wealth & Investment
The extraordinary strength of the US dollar in 2014 was associated with a high degree of emerging market (and rand) exchange rate weakness. Also note that a degree of US dollar weakness that begins in mid-2016 has been associated with a recovery in the emerging market basket (and the rand). US dollar volatility poses particular challenges for monetary policy in emerging economies. We return to this important issue below.
The real exchange rate is what matters for real business activity
Inflation can make a producer or distributor of goods or services less competitive in home and foreign markets. However, a weaker exchange rate can protect operating margins against those rivals subject to less inflation. What may be gained or lost in the ability to compete on price – when expressed in any common currency – can be offset by changes in the rate of exchange.
When the offset is complete, the exchange rate will have weakened or strengthened by the percentage differences in inflation in the home country and that of its trading partners. If such circumstances, the exchange rate would be said to conform to purchasing power parity (PPP). Thus, PPP is regarded as a theoretical equilibrium to which exchange rates will converge in time.
The deviations from PPP-equivalent exchange rates are used to calculate a real exchange rate. It is this real exchange rate that defines the competitiveness of prevailing market-determined exchange rates. A real exchange rate with a value of more than 100 indicates an overvalued exchange rate and a value less than 100 indicates a competitive or undervalued exchange rate. The direction of the real exchange rate towards or away from 100 shows whether domestic producers have become more or less internationally competitive.
The calculation of a real exchange rate can include multiple exchange rates and an equivalent number of inflation rates – weighted by the share of imports and export held by different trading partners. The prices of relevance for the calculation of inflation and the real exchange rate are usually derived from prices charged for the manufactured goods that are presumed to dominate international trade.
The history of flexible exchange rates in SA shows that, the USD/ZAR exchange rate as well as the trade-weighted rand exchange rate, have consistently deviated from PPP-equivalent exchange rates and in varying degrees (see figures 3 to 5). This indicates that when SA firms engage in foreign trade and have to compete on the domestic market with imports this is a risky activity, given the variability of the real exchange rate and operating margins.
Measuring real exchange rates – a focus on South Africa
These divergences from PPP-equivalent exchange rates, i.e. fluctuations in the real rand exchange rate, are large and variable. This real rand exchange rate volatility for the rand is linked to the removal of exchange controls on foreign investors that were effectively withdrawn in 1995. There was a brief period of real exchange rate volatility, between 1983 and 1985, when foreign investors were also free to move funds into and out of South Africa. A further source of capital flows has been the progressive relief on the exchange controls applied to South African residents.
Freer capital flows rather than trade flows have dominated the demand for and supply of rands exchanged for US dollars and other currencies, and has introduced significantly more rand exchange rate volatility . It is the flow of global capital that has similarly dominated exchange rate trends in all economies that are open to this free flow of capital.
As we show below, using January 1970 as the starting point, the USD/ZAR exchange rate diverged significantly from PPP in 1985, then conformed to PPP between 1988 and 1995, whereafter the divergence has been continuous, though still highly variable. Heavy shocks to the USD/ZAR exchange rate are to be observed in 2001-02, 2008 and 2014. These sharp deviations from PPP have been followed by movement back towards PPP.
Sensitivity to the base year
Notice too that the PPP calculation is sensitive to the base year used to calculate the price indices. When 2010 is taken as the starting point for the calculation, the absolute deviations from PPP exchange rates are of a different magnitude. However, the movement away from or back towards PPP-equivalent exchange rates takes the same direction in both versions of PPP-equivalent exchange rates.
The starting point for any such calculation should be when the actual exchange rate approximates PPP, as it did in 1970. By 2010, the base year for calculating the current real exchange rate, the USD/ZAR exchange rate had moved far away from PPP, using a 1970 base year. When the base year is taken to be 2010, the rand appears as less undervalued generally and even as overvalued in 2010 – when the USD/ZAR traded at less than its PPP equivalent (2010 prices).
Figure 3: Market and Purchasing Power Parity exchange rates (USD/ZAR) (1970=100)
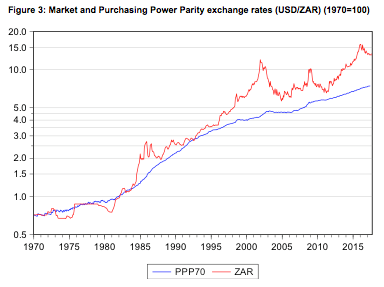
Sources: Stats SA, Federal Reserve Bank of St. Louis (FRED Data Base), Investec Wealth & Investment
Figure 4: Market and Purchasing Power Parity exchange rates (USD/ZAR) (2010=100)
Sources: Stats SA, Federal Reserve Bank of St. Louis (FRED database) and Investec Wealth & Investment
In figure 5 below we show the ratio of the PPP-equivalent USD/ZAR exchange rates to the market-determined USD/ZAR, using 1970 or 2010 as the base year. This ratio may be regarded as representing the real USD/ZAR exchange rates. Values above 100 indicate an overvalued (less competitive) nominal exchange rate and values below 100 indicate the opposite – the nominal exchange rate has changed by more than the difference in inflation in SA and the US.
Using 2010 prices and exchange rates, the rand was overvalued for much of the period from 1970 to 1995 and for some years afterwards. The strong real rand was supported in the 1970s by rising gold and metal prices in US dollars. The picture using 1970 prices as the basis of the calculation is different, revealing a consistently undervalued rand after 1985.
Figure 5: USD/ZAR – the ratio of PPP to market exchange rates; a measure of the real exchange rate using different base years
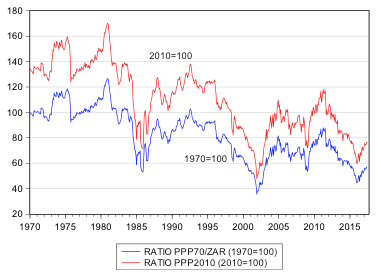
Sources: Stats SA, Federal Reserve Bank of St. Louis (FRED database) and Investec Wealth & Investment
Real exchange rates considered more widely – the international evidence
In the figures below, we show a variety of trade-weighted real exchange rates for the period 1995-2017, as calculated by the Bank for International Settlements and the SA Reserve Bank. All these real exchange rates are highly variable, including those of the US. The real US dollar demonstrated continuous strength between 1995 and 2002, then weakness to 2008, whereafter the safe haven status of the US dollar in a time of crisis added some real strength to the trade-weighted exchange rate. A further period of pronounced real dollar strength ensued after 2014. Not coincidentally, the real trade weighted rand moved in very much the opposite direction, as seen in figure 6.
It should be recognised that the real rand, for all its volatility and the risks to which it has exposed SA business, has not in fact been more variable than the real dollar. As a relatively small economy that is very open to foreign trade, real exchange rates are, of course, more important for the South African economy. The value of exports and imports for South Africa is equivalent to about 50% of GDP. The exposure to imports and exports in the US is equivalent to about 30% of GDP.
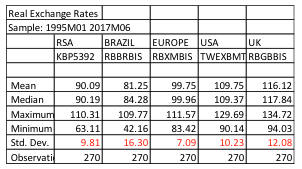
As may be seen in the figures below, the real euro and real sterling have also been highly variable since 1995, while the Brazilian real has been more variable than most. The summary statistics for these real exchange rates are provided in Table 1.
The conclusion, therefore, is that the volatility of the real rand that so complicates the business of exporting from and importing to SA is not exceptional. The same complications and risks of doing business across frontiers, or rather exchange rate regimes, apply across the modern world of flexible exchange rates. It should be recognised that flexible exchange rates have added generally to the risks of doing international business everywhere. As such, these risks are presumed to have increased the required returns on capital invested in servicing global markets.
One can also determine whether there is a general tendency of exchange rates to revert to PPP and foreign trade-neutral real exchange rates. In other words, can one conduct a statistical test of whether real exchange rates are mean reverting?
The answer is that they don’t pass this statistical test with any degree of statistical confidence. The Chinese and Japanese real exchange rate trends since 1995 are most conspicuously not mean reverting to the theoretical 100 as may be observed in figure 9. The real yuan has a distinct and persistently stronger trend while the real yen moves persistently weaker.
Figure 6: Real exchange rates 1995-2017, South Africa and the US (2010=100)
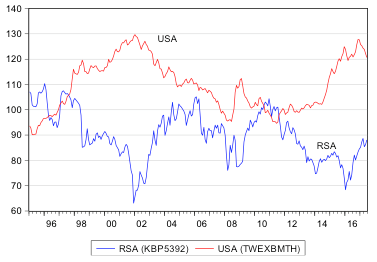
Source: SA Reserve Bank, Federal Reserve Bank of St. Louis (FRED database) and Investec Wealth & Investment
Figure 7: Real exchange rates 1995-2017, South Africa and Brazil (2010=100)
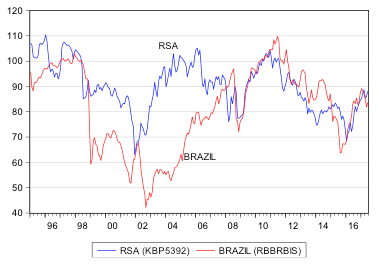
Source: SA Reserve Bank, Federal Reserve Bank of St. Louis (FRED database) and Investec Wealth & Investment
Figure 8: Real exchange rates 1995-2017, UK and Eurozone (2010=100)
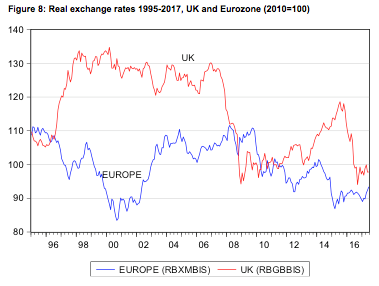
Source: SA Reserve Bank, Federal Reserve Bank of St. Louis (FRED database) and Investec Wealth & Investment
Figure 9: Real exchange rates 1995-2017, China and Japan (2010=100)
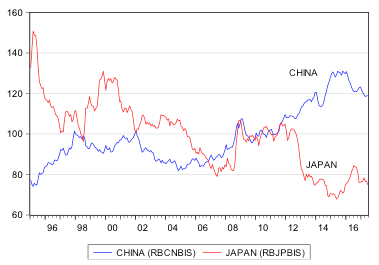
Source: SA Reserve Bank, Federal Reserve Bank of St. Louis (FRED database)and Investec Wealth & Investment
Table 1: Real exchange rates summary statistics
The importance of capital rather than trade flows in determining nominal and real exchange rates
The notion that exchange rates will trend, over time, back towards some kind of competitive equilibrium, as imports and export volumes adjust to the real exchange rate effects on operating margins, therefore does not hold. The volatile behaviour of both nominal and real exchange rates is driven by unpredictable capital flows rather than by flows of currencies generated by the international trade in goods and services.
These capital flows that are based upon changing expectations of future returns, move the rate of exchange stronger or weaker. Inflation rates then react, but not rapidly or sufficiently enough to sustain PPP.
The exchange rate therefore leads inflation and the nominal exchange rate leads the real exchange rate – because inflation rates are much more stable than exchange rates. This stability is partly the result of the convention that measures inflation as the year-on-year change in consumer or other price indices, rather than as price moves over shorter periods of time. For example, a one or three month trend in consumer prices would indicate much more variability. The variability of real exchange rates has, in practice, almost everything to do with shocks to nominal exchange rates rather than price.
The shocks to the real exchange rate observed in the charts above therefore have very little to do with shocks to inflation rates. The openness of an economy to imports of staple commodities reduces the impact of harvests that are subject to unfavourable climatic conditions. Droughts and famines might otherwise have pushed prices temporarily much higher, providing a price shock to the economy.
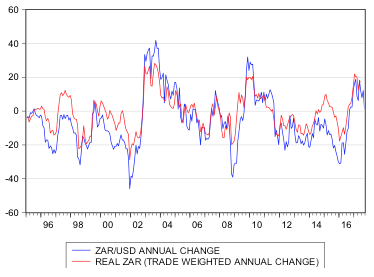
As we show in figure 10 below, annual moves in the nominal ZAR/USD exchange rate dominate the moves in the real rand exchange rate that are so important for operating businesses and their operating profit margins. Similar results could be found for many other economies and their currencies as was found to be true of the US demonstrated in Figure 1
Figure 10: Annual changes in the USD/ZAR nominal and real exchange rates
The impact of exchange rates on prices and inflation
Exchange rate shocks will have implications for the domestic price level. Other things being equal, the price of imported goods and the prices realised for exports in the local currency will rise or fall with the price of a US dollar. Other things may not remain unchanged and may also effect the prices charged domestically. For example, the US dollar price of imported oil may be rising or falling as might other imported commodities.
Dollar strength might well mean downward pressure on prices set in US dollar and dollar weakness might have the opposite effect. The state of the domestic economy will also have an influence on prices. The more or less buoyant domestic spending is, the greater or lesser the pressure on domestic prices will be. However a weaker exchange rate and the higher prices that are likely to accompany it will, in themselves, act to reduce spending power. They may also undermine the confidence of households and firms in their economic prospects, and their willingness to spend more or less of their incomes.
How should monetary policy react to exchange rate shocks?
How then should monetary policy and interest rates react to exchange rate shocks that are so difficult to anticipate? We would argue the best approach to exchange rate shocks is not to react to them at all. This is because such shocks are temporary rather than persistent. If such exchange rate shocks really are temporary – even perhaps rapidly reversible – the impact they have on inflation will be as temporary. They therefore will not be expected to permanently add to inflation and therefore will not add to expected (forecast) inflation.
It should nevertheless be recognised that dollar strength and other currency weakness can persist for an extended period of time. Persistent US dollar strength – against its developed economy peer currencies and against most emerging market currencies – explains much of the nominal and real rand weakness observed between 2014 and 2016.
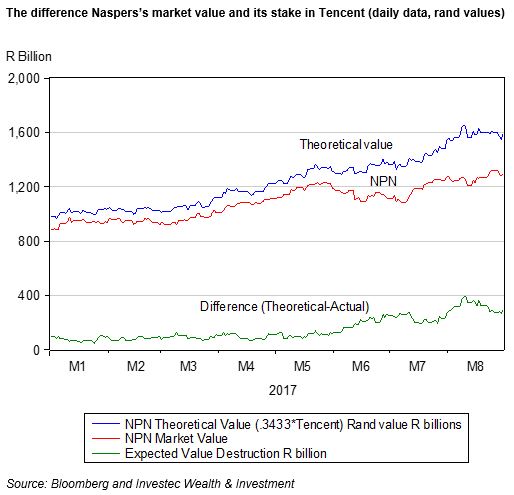
The difference between rand weakness against the dollar and the weakness of other emerging market currencies vs. the US dollar represents additional SA specific risks to the returns expected from SA domiciled assets. We show these global and SA influences on the rand in the figure below. The USD/ZAR and the equally weighted Index of nine other emerging market currencies generally move in the same direction. The ratio of the USD/ZAR exchange rate to the USD/EM basket indicates South Africa-specific risks at work. These South Africa-specific risks spiked significantly in 2001, 2008 and 2015, when they added to rand weakness for global reasons. In other words, a weakness against the US dollar was shared by the other emerging market currencies.
Figure 11: The US dollar vs the rand and the EM Basket (LHS); and the Ratio rand/EM (RHS)
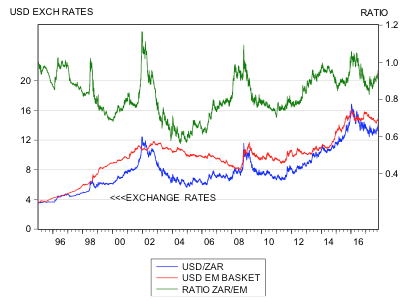
Source: Bloomberg and Investment Wealth & Investment
Thus, much of the persistently high rates of inflation over the period between January 2014 and June 2016 (an average of 5.5% per annum) can be explained by dollar strength and its impact on the rand prices of imports, exports and alternatives for both in the production and price choices firms make. Inflation remained at these levels despite increases in interest rates and near recessionary conditions.
South African inflation over this period cannot be explained by the extra demands exercised by local households or businesses. Aggregate spending remained highly depressed over this period, which was also due to the inflation of prices charged to them. A drought proved to add another supply side shock to the rand prices of staple foods.
Only persistent and permanent increases in the demands for good and services, fueled by persistent increases in the supply of money and credit, will lead to continuous increases in prices and, sooner or later, increases in the price of foreign exchange. Interest rate expectations and capital flows will, in such circumstances of highly accommodating monetary policy settings, come to anticipate more inflation and help weaken the exchange rate.
A central bank charged with securing permanently low inflation would have to react to demand side pressures of this kind on prices. But they are strongly advised not to react to exchange rate shocks, especially when they occur in the absence of excess domestic demand over domestic potential supplies.
To react this way is to make monetary policy hostage to the variable and difficult to predict, nominal and real US dollar exchange rate. It is a risky exposure that businesses engaging in international trade cannot easily avoid. But monetary policy would do well to do what it can to moderate the shocks that emanate from the foreign exchange market. Unfortunately, the SA Reserve Bank added higher interest rates to exchange rate misery over the 2014-2016 period. We regard these as errors of monetary policy that reduced growth rates without any obvious reduction in inflation rates or inflation expected.
The implications of exchange rate volatility for investment portfolios
The volatile dollar can easily lead to such monetary policy errors of judgment – as in the case of South Africa. Emerging market economies, particularly those with significant exposure to foreign trade, are especially vulnerable to fighting exchange rate shocks, that is US dollar-driven shocks, with higher interest rates, which further damage the prospects for local businesses.
These are errors the US is much less likely to make, given that the dollar is likely to be the source of the exchange rate shocks. Monetary policy in the US understandably does not react to the exchange value of the dollar. Therefore, when investing abroad, a bias in favour of dollar based investing seems appropriate.
It may be concluded that the volatility of the real rand (that so complicates the business of exporting from and importing to SA) is not exceptional. The same complications and risks of doing business across frontiers and exchange rate regimes apply across the modern world of flexible exchange rates. It should be recognised that flexible exchange rates have added generally to the risks of doing international business everywhere.
The alternatives to fiduciary currencies and flexible exchange rates
The alternative to flexible exchange rates is fixing the rate at which a domestic currency may be converted into another currency. For example, the Hong Kong dollar has been fixed at 7.8 to the US dollar for many years. This fixed exchange rate link demands that inflation and interest rates in the two currencies will be very similar, to protect the sustainability of the fix. However, this also means that the real USD/HK exchange rate has been as variable as the real USD exchange rate.
An alternative form of fixing an exchange rate that was practiced widely before 1970 elsewhere including in the US, would be to fix the rate of exchange to the price of gold or silver at some predetermined local currency price of gold. For example, between 1933 and 1970 the dollar could be converted into gold at 35 US dollars per troy ounce.
This gold convertibility requirement restrained central banks from increasing the supply of cash issued to banks – held mostly in the form of deposits with the central bank – that could be converted into gold in the days of the gold standard. Constraints on the growth in the supply of central bank cash in turn helped to sustain low rates of inflation in normal times.
In abnormal times of large balance of payments outflows, this convertibility of local currency deposits into gold (that could be exercised by foreign central banks after 1945) might break down, as it did for the US in the early 1970s. This breakdown, or not enough central bank stocks of gold to meet the demands for gold by other central banks, might lead to either a new fix of the rate of exchange of gold for the local currency, or lead to inconvertible currencies. This would be a move to flexible exchange rates and the abandonment of the gold standard.
This is what the US chose to do in 1971 under pressure to convert dollar liabilities into gold that came from the French government particularly. The French strongly objected to the reserve currency role played by the US dollar that increased demands for dollars that they argued added to the economic power of the US.
It might be recalled that the IMF, established immediately after the end of the Second World War to assist a global economic recovery, effectively restored the gold standard and reaffirmed the convertibility of US dollar into gold. The IMF, however, also allowed for and supported orderly adjustments to fixed exchange rates under conditions of “fundamental disequilibrium”.
The intention was to avoid a series of competitive devaluations and ‘beggar your neighbour’ policies that were such a damaging feature of international economic relations in the depressed 1930s.
The problem that fixed exchange rates after 1945 could not resolve, was when a global shortage of dollars became a surplus of dollars. In effect, the US as the dominant economic power that supplied the reserve currency was unwilling to play the gold standard game and limit the supply of dollars to sustain convertibility at a fixed rate. And so the global economy has had to cope with flexible exchange rates that do not necessarily trend to PPP-equivalent exchange rates. The price paid for allowing flexible and market-determined exchange rates to absorb the shocks caused by highly variable capital flows, has been to add to the risks of cross border trade flows