Brian Kantor and David Holland
March 2025
America has not always been great. In the nineteen sixties America lost the war it fought in Vietnam. Conscripting its badly suffering Army and long overdue attempts to address racism divided the nation in a most ugly way. And in the seventies, inflation took off. It had risen to over 13% in December 1979
And then came a most impressive comeback. Inflation came under control in the eighties after a short sharp recession and the US won the cold war under the inspirational leadership of Ronald Reagan. And something else, very important for the economy, was under way. The revolution in corporate finance, in theory and practice, came to transform how American business would direct itself and improve its performance. Increasingly managers came to act in the interest of the providers of their all-important capital, their shareholders. Return on capital became the focus of management attention. A discipline that was forced on managers by increasingly active investors, backed by access to credit made available to them on an unprecedented scale.
Shareholders did not need business managers to diversify on their behalf. Conglomeration became a dirty word. The share market could do it for them and big business became more specialised and more efficient and profitable in the true economic sense- earning more than the opportunity cost of the capital they employed. The bar was being raised for US business and its CEO’s and they responded accordingly by improving the efficiency of their r operations to the great benefit of workers and savers and investors.
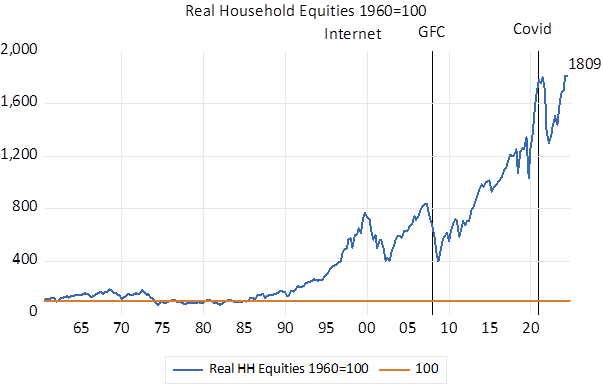
The US equity markets tell the story of improved efficiency and enormous amounts of additional wealth creation. Donald Chew, who was there at the beginning in a recently published book, provides an incisive overview.[1] The improvement in the value of US equities and in the strength of household balance sheets after 1985 has been nothing less than extraordinary. The value of US household’s investments in business, their equities, adjusted for inflation, was stagnant for as many as 25 years between 1960 and 1985. Put another way the share market was not a source of real wealth creation for about a quarter of a century. Thereafter the market value of US equities held by households took off and is now worth about 18 times more in real terms than it was in 1985. Buoyed increasingly by the gains in the market value of these equities, the ratio of household wealth after debts to household incomes has increased from 4.8 times in 1987 to the current over seven times, even as disposable incomes have risen.
Personal Disposable incomes grew from $3.65 trillion in Q1 1988 to 21.89 trillion by Q4 2024. That is at an average compound growth rate of 4.8% p.a. over the 37 years. The net wealth of US households grew from $18.52 trillion in 1988 to $163.5 trillion by 2024 at a higher average compound growth rate of 5.9% p.a. over the same period, helped largely by the increased value of US businesses.
These wealth gains have been especially large after Covid. Between 2020 and 2024 personal incomes after taxes, assisted by Covid relief, grew from 14 trillion to 22 trillion or by 57%. The net worth of US households grew much faster and extraordinarily from 42.2 trillion in 2020 to 163.5 trillion, by the end of 2024, or by 287%. These wealth effects surely dominated the income effects on spending.
Charting the explosion of wealth in US equities.
The charts below show the trends and how gains in the equity market came to dominate household balance sheets.
Fig.1; Household Wealth to Personal Disposable Incomes; Ratio (1987- 2024)
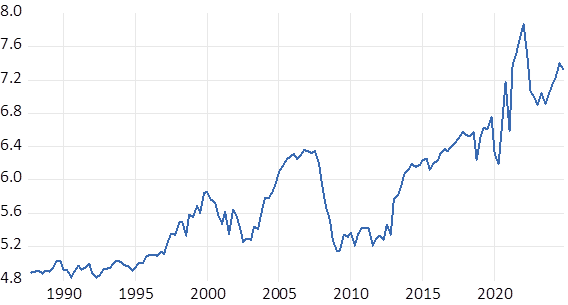
Fig.2: US Holdings of Equities Adjusted for Inflation. 1960=100
Source; Federal Reserve Bank of St. Louis (Fred) Investec Wealth & Investment
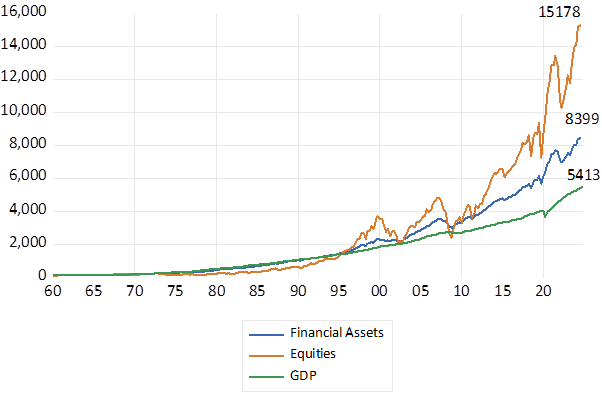
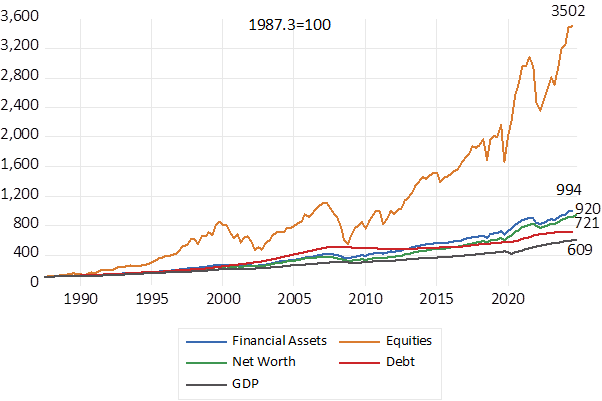
The value of equities in household portfolios has come to dominate much more valuable household balance sheets. A fuller illustration of the trends in household balance sheets after 1990 is also shown below.
Fig 3; US Households Holdings of Equities, Financial Assets and GDP. (1960=100)
Source; Federal Reserve Bank of St. Louis (Fred) Investec Wealth & Investment
Fig 4: US Households Balance Sheet Categories (1987=100)
Source; Federal Reserve Bank of St. Louis (Fred) Investec Wealth & Investment
Fig.5; The value of equities held by US Households and the S&P 500 Index. 1960=100
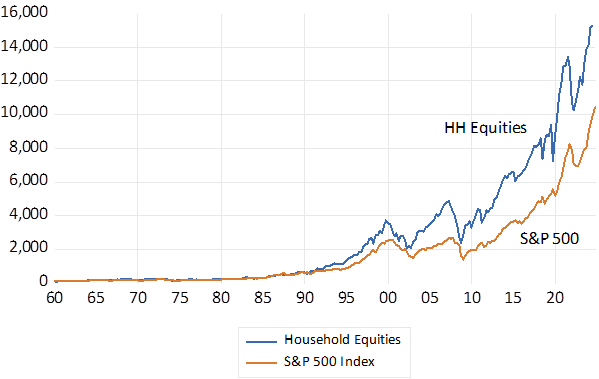
Source; Federal Reserve Bank of St. Louis (Fred) Investec Wealth & Investment
Fig.6; Annual Increases in Household Wealth and Incomes. USD Billions (2020-2025)
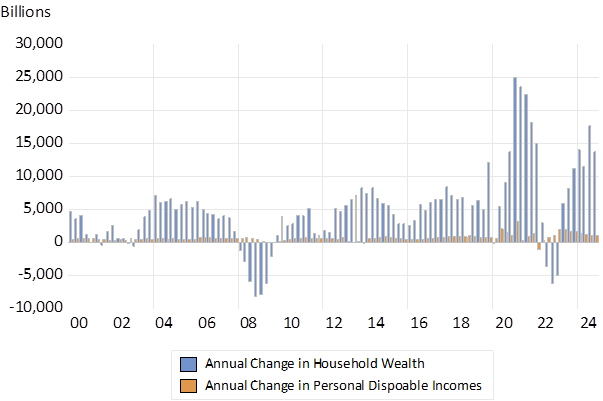
Source; Federal Reserve Bank of St. Louis (Fred) Investec Wealth & Investment
South Africa – a case of capital wasted.
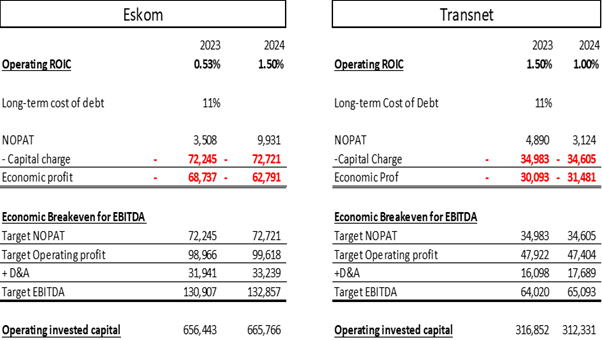
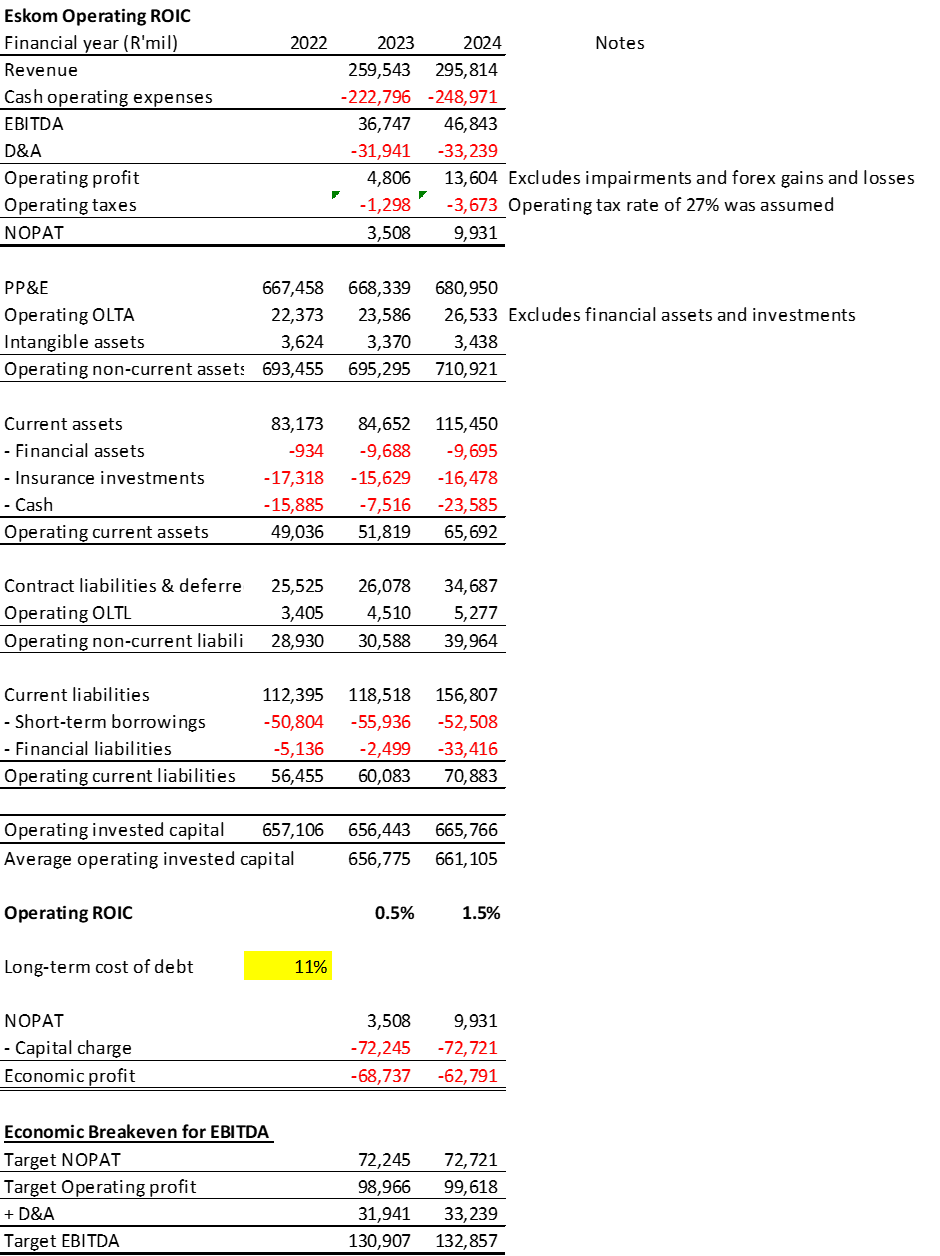
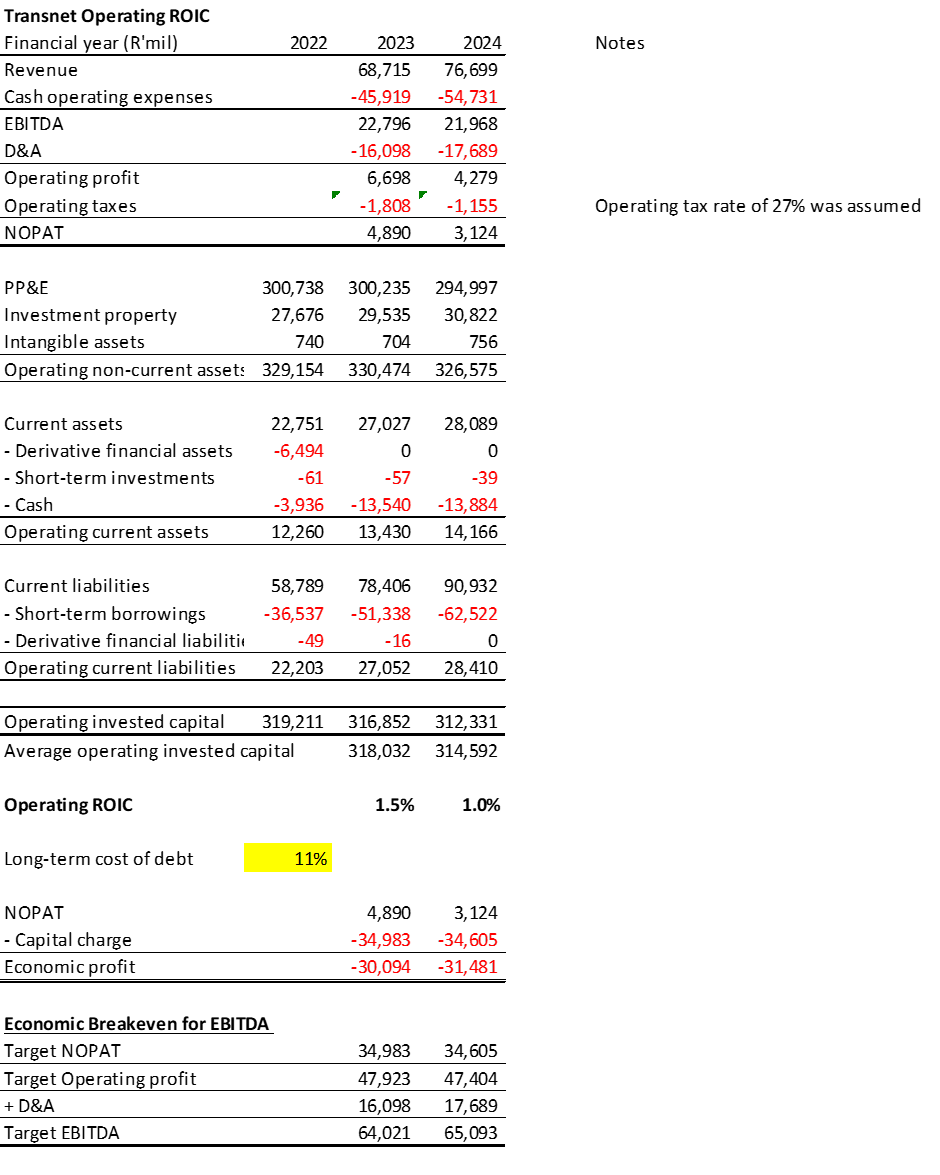
South African business is similarly under pressure from shareholders to generate economic profits for their shareholders. Though the SA economy has offered lesser opportunities for growing businesses than the US economy. An important reason for this failure to grow can be found in the operating performance of the State-Owned Corporations and the terrible waste of the capital that taxpayers have been forced to supply them with. Eskom, the State-owned electricity utility, employs as much as R700 billion of capital in its operations. The return on this capital is at best about 1% p.a. If Eskom were to cover its cost of debt capital (about 11% p.a) it would need to generate and additional R70 billion plus each year from its operations. Or put another way Eskom has been wasting about R70 billion of taxpayers potential income every year. Transnet, the state-owned transport company, employing about 312 billion rand’s worth of capital, at a 11% p.a. charge is similarly wasteful. It would need about R31 billion of extra profit annually to cover its costs of capital. The sacrifice taxpayers have made of potential income had capital had been used efficiently has clearly been enormous.
South Africa urgently needs a revolution in its use of capital. It needs a focus on the return on capital, on the interests of its shareholders in the SOE’s, that is taxpayers that made America great. Among the most abused shareholders anywhere are surely South African taxpayers. The solution is obvious. The taxpayers should not be throwing good potentially valuable capital after bad. But demand that the hopelessly inefficient operations of the SOE’s be transferred to private operators who must cover their costs of capital to survive. The state can exchange assets or additional capital for a stake in more efficient businesses as Temasek has so successfully managed for Singapore. And the RSA can then look forward to taxing their profits rather than cover their further losses.
A financial appendix.
The tables and workings below summarize the dismal record of Eskom and Transnet. [2]
[1] Donald H. Chew Jnr, The Making of Modern Corporate Finance, Columbia University Press, 2025.
[2] ROIC= Return on Invested Capital. NOPAT= Net Operating Profit after Taxes. EBITDA=Earnings before Interest, Depreciation and Amortisation. The fuller work sheet is copied below.
,