Market values secure solvency

I read with some astonishment,  (BD Dineo Faku 22nd September) about the court action taken by shipping company Maersk to overturn the award by Transnet of the Durban Container Port Tender to the Philippine Company International Container Services (ICS) On the grounds that the ICS tender should have been disqualified because it, only it, used its share market value rather than its book value to calculate and report its “solvency ratio”

It would seem obvious that a borrower is solvent when the value of its assets, should they have to be realised, is expected to exceed the value of debts it has incurred. And the closer the ratio of market value to debt the greater the danger that the company would be forced to wind up. If the company is listed its market value is clear and explicit and continuously available. The book value of a private company might be the best initial and readily available estimate of what the assets might realise. If the accountants for the firm have following recommended good practice and have been consistently marking the books to market.

As I write the market value of shipping giant Maersk is 25.9 billion dollars with total debts of 16.7 billion US dollars ( 1.6 times) and that of ICS with a market value of 15 billion dollars, with total debts of 4.16 billion dollars. (3.6 times) The earnings before taxes to interest paid ratio is similar for the two companies 4.5 times for Maersk and 4 times for ICS.

There is a rigorous test of Corporate Default Risk applied to any listed company anywhere, more than 65000 of them, including Maersk and ICS. A test no further away than your nearest Bloomberg Terminal. A click or two calling up the company and the DRSK model will give you an immediate probability of default. And one that will be closely allied with the conventional ratings provided by the debt rating agencies. The Bloomberg model easily downloaded is adapted from the original financial economics of Nobel laureate, Robert C Merton, and is very well known in financial economics. The theory as adapted by the Bloomberg team in 2021 is elegant and is very well tested by the evidence presented of its predictive power. Science, that is theory with predictive power for a large sample is at work here.

The Bloomberg model uses the market value of the assets of a company as the basis of its assets to debt ratios. But with an important proviso. The market value of a company in the model  is adjusted for the volatility of its share price . The market value is estimated as a “down and out” call on the assets with a maturity date. Hence providing a highly realistic estimate of what you might realise the assets for. The more volatility, the less predictable the share prices and the less the company may be expected to fetch

The Bloomberg model gives very similar measures for the very low probability of either Maersk or ICI defaulting over the next twelve months.  (see below) Both companies, as predicted by Bloomberg, would enjoy a comforting Investment Grade rating. The market value of ICS has risen strongly over the past twelve months while that of Maersk has changed little. The volatility of the two share prices- until recently higher for Maersk, is now very similar. The improved value of ICS may well have much to do with winning the tender. It clearly is a valuable contract worth fighting over.

The Maersk and ICI share prices. Daily data (2023-2024) US dollar value.

Source. Bloomberg and Investec Wealth & Investment

Maersk and International Container Services. Probability of Default; over the next 12 months. %

Source. Bloomberg and Investec Wealth & Investment

A South African Case Study Pick N Pay (PIK)

Underperforming companies raising more debt do not necessarily go broke when the market value of their assets approaches the barrier of debt. They may be rescued by shareholders willing to subscribe additional equity capital. When shareholders prove unwilling to provide support a company will go under. Hence the market value of a highly indebted company, close to default, will always reflect the chances of a rescue.

South African retailer Pick ‘n Pay (Pik) has provided a very clear example of the benefits of shareholders coming to the rescue with additional share capital necessary to avert the dangers of a default. The operating performance of the company had deteriorated significantly in recent years. A drain of cash had been funded with much additional debt. Net debt had increased from R3.8 billion in August 2023 to R7.2 billion by January 2024. As the market value of Pik declined from 28.02 billion in January 2023 to R11.48 billion by year end 2023 with elevated daily volatility.

A recapitulation of the business had become essential for the survival of the business and was announced in January 2024. The plan was to raise R4 billion from existing shareholders in the form of a rights issue. To be followed by the listing of and an offering of shares in its profitable subsidiary company Boxer. Bankers also agreed to modify their debt covenants in February 2024.

On the 27th February 2024 the company announced the approval of the capital raising and debt reduction scheme. At which point in time the market value of Pik bottomed out at R8.5b. The rights issue when concluded on July 30th raised the number of shares in issue by as much as 51%.

The market value of Pik is now approximately R19b. Thus, the capital raise of R4 billion must be regarded as having added much value for the shareholders subscribing the extra capital. The value of Pik is now up by approximately R10.7b (19.2-8.5) March 2024 after an investment of R4 billion That is for the initial subscription of R4 billion the shareholders have gained R6.7b. (10.7-4)

Source; Iress and Investec Wealth & Investment

The recent history of Pik – its share price and probability of default as calculated by the Bloomberg model – is shown below. As may be seen the probability of default rose sharply as the share price fell away with heightened volatility. The probability of a default in 12 months has now receded sharply placing Pik debt if it were to be rated in the High Yield category.  (see below)

Pick ‘n Pay Probability of Default and Share Price. Daily data

Source; Bloomberg
Complexity rather than linearity drives share prices in a very good year

In years to come the 2023-24 years will be recognized as very special ones for share owners. Something to toast over what may prove to be an equally special Grand Cru. One that, thanks to the exceptional draw up in market values, has become more affordable to the patient investor. A case of what the wine cognoscenti might describe as linearity- from much extra wealth created to the wine cellar.  Though why a straight uncomplicated line from lips to throat, should be regarded as an attribute of a fine wine escapes me. I thought one pays up for complexity in wines, never simply described.

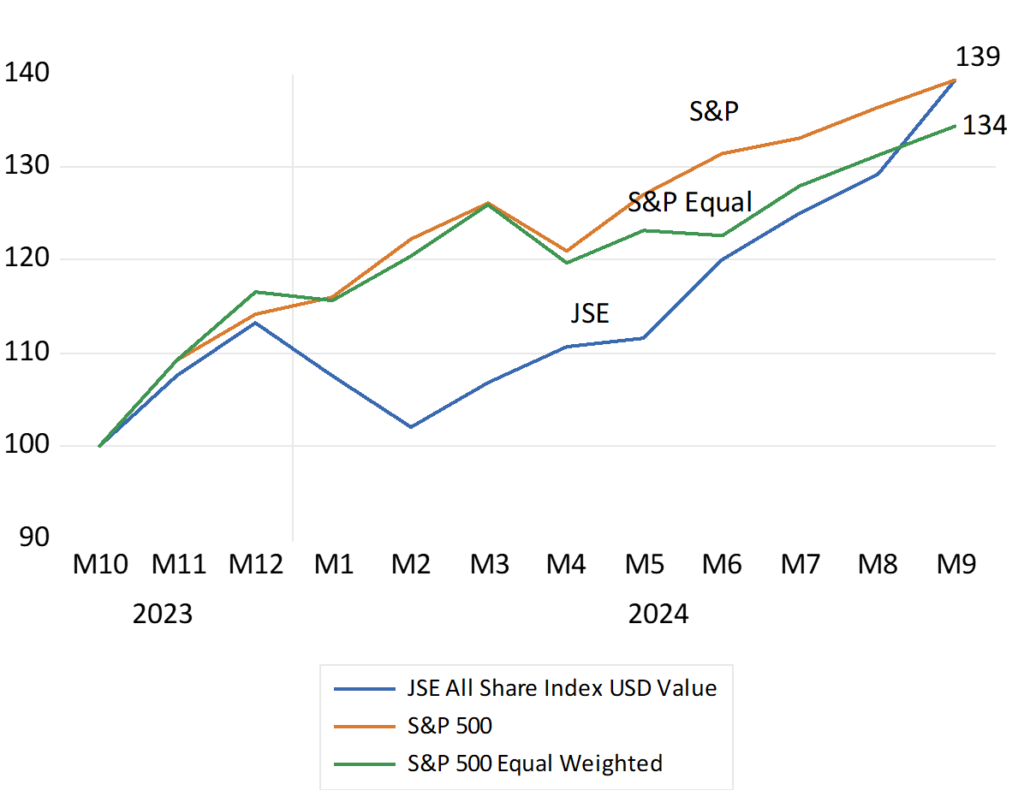
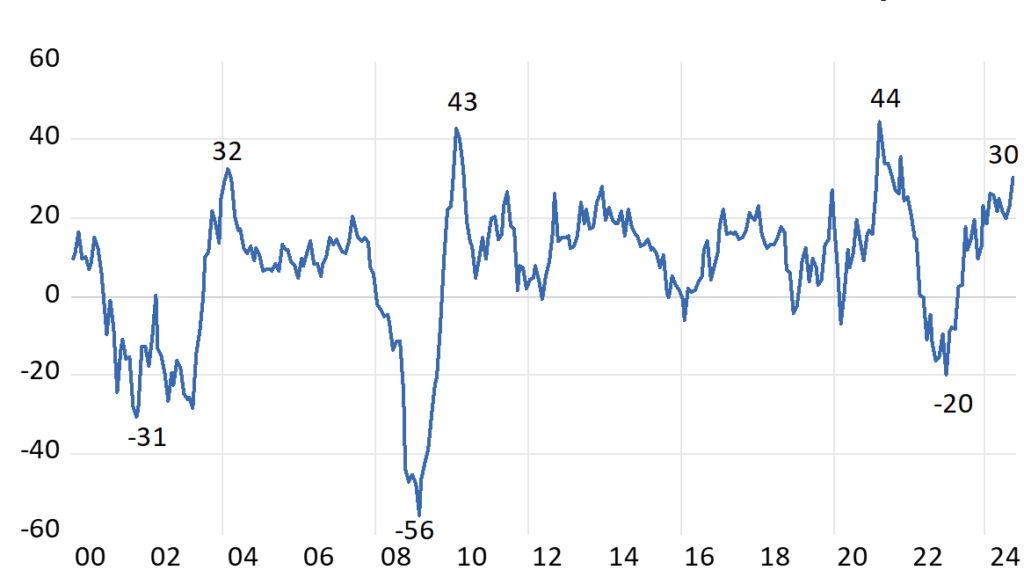
This past year the S&P 500 delivered the best annual returns this century. Comparable to the recovery from the panic drawdowns of 2008 (GFC) or 2020 (Covid) The Index, up 30 % in the twelve months to September 2024 was very generously valued a year ago -at 21 times earnings. It is now even more expensive and valued at 25 times reported earnings. The average S&P P/E since 2000 has been 19.7 times. Unusually It has not taken a draw down to lead a strong recovery. This time has been different. Strength on Strength.

The S&P 500 Index Annual Returns – calculated monthly 2000-2024

Source; Bloomberg and Investec Wealth and Investment.

The upward direction of the S&P Index recently has been dominated by a few stocks- the so described magnificent seven- making the Index unusually concentrated, less diverse and therefore more risky than usual.  The top three by market value Microsoft Corp., Apple, Inc., and Nvidia Corp., constituted 20% of the S&P 500 this year, while the top seven stocks accounted for 32%. 

Yet while the S&P 500 is up 22% this year to September, the equal-weighted S&P 500, the average listed company, is up by less – a mere 14.9%.  During the first half of the year, the S&P 500 rose by 15.2%, and by 5.9% in Q3, while the equal-weighted S&P 500 increased by only 5% over the same period. This greater than 10% performance gap between the weighted and unweighted indices was the widest in nearly 30 years. Only about a quarter of S&P 500 stocks kept pace with the market’s overall return during the first half of this year, with over a quarter experiencing negative returns. If you did not own the very largest stocks and own them in size, you likely underperformed the indices. Risk (less diversification) and return were as usual well correlated.  

The “magnificent seven” and so the market are valued for the prospective growth in the demand for artificial intelligence that they supply the backbone for. But their investment case so strongly appreciated will only be fully revealed over time. This makes their valuations less dependent on near term earnings and so on the essentially short-term business cycle. They are valued much more idiosyncratically than your average value company on their own recognizances. They have also grown earnings and cash flows at well above the average rate to date. These super growers with impressive track records are allocating truly massive volumes of internally generated cash flows to supplying the essential facilities that the average firm will be drawing upon and hopefully paying up for.  They also have the financial strength to pay dividends and buy back shares. In contrast, the average S&P 500 company is valued more heavily on the short-term outlook for the U.S. economy.  About which there has been and perhaps will always be considerable uncertainty.

The S&P 500 Index, the equally weighted S&P Index and the JSE All Share Index. Total returns to October (2023=100) USD Values

Source; Bloomberg and Investec Wealth and Investment.

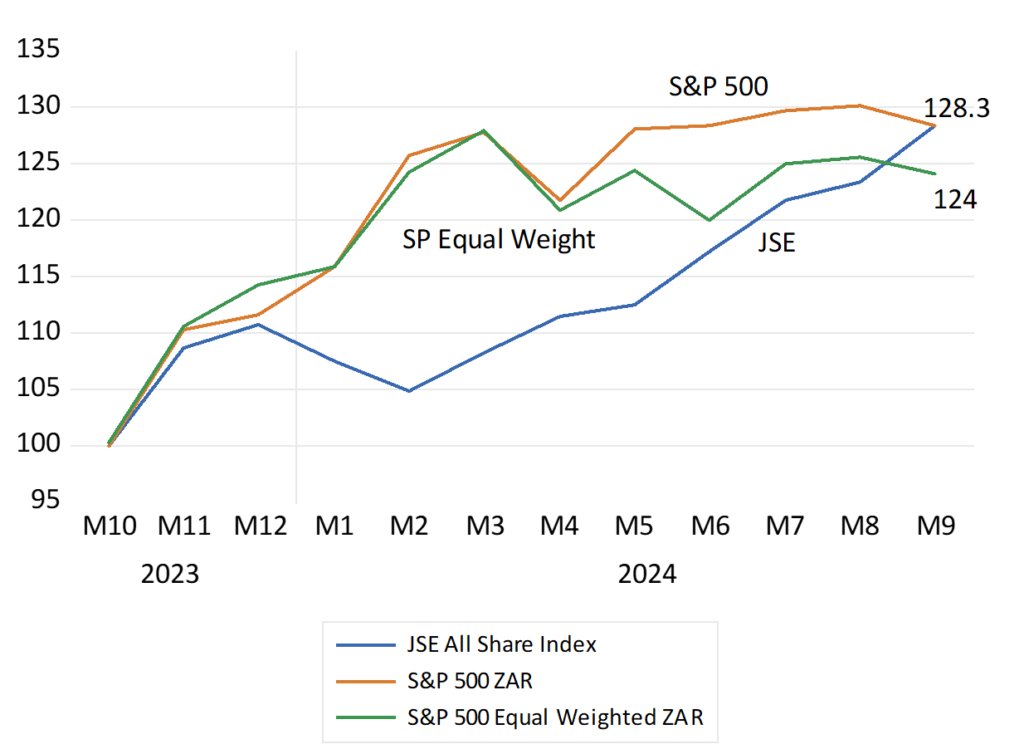
The JSE has also enjoyed a very good year. Up by as much as the S&P since October 2023. 40% in USD and still impressively 28% higher in the mighty ZAR. The JSE All Share Index measured has added as much to SA portfolios as would have holding the S&P Index. A wealth adding outcome for old-fashioned reasons. The prospect of faster growth has fired up the share market and the value of RSA bonds and the exchange rate. Less inflation, lower interest rates and faster growth in GDP and government revenues has been very heady stuff. Enough perhaps to add to the prices bid at the Wine Guild Auction and deserving of an early toast to the GNU.

The S&P 500 Index, the equally weighted S&P Index and the JSE All Share Index. Total returns to October (2023=100) Rand Values

Source; Bloomberg and Investec Wealth and Investment.

Looking Back -to Look Forward to the outlook for Monetary Policy and the SA Economy.

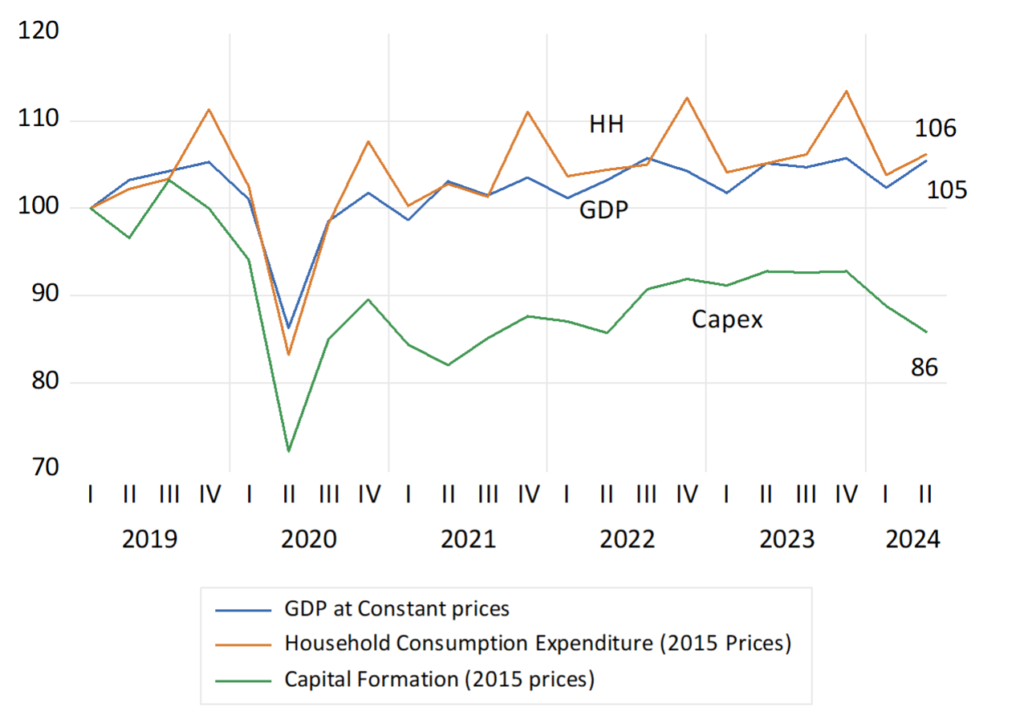
Looking back at the economy reminds how tough it has been in recent years for households and businesses dependent on the state of the SA economy. Since those pre-Covid days the economy has hardly grown at all. Compared to Q1 2019 GDP by June 2024 had gained a mere 5% over the five and a half years. (growth of less than 1% p.a)  Households are spending but 6% more than they did then and capital formation is down by about 14% in real terms. How could such a deterioration be allowed to take place?

Vital SA Economic Statistics. Supply and Demand. (2019=100) Quarterly Data.

Source; SA Reserve Bank and Investec Wealth and Investment.

Clearly the supply side of the economy performed poorly – led by the well documented, confidence sapping failures of the State-owned enterprises and of government generally, including those of the provinces and municipalities. But demand management by the Reserve Bank can also be held  responsible for at least some of the weakness. Much of the period since 2021 has been accompanied by much higher interest rates both absolutely and relatively to inflation. That is despite the grave weakness of demand for goods services and labour.

The Reserve Bank’s Monetary Policy Committee provides a full explanation on a regular basis for these interest rate settings. It has been fighting inflation and only inflation that rose after 2021 as the rand weakened so significantly after 2021. The idea of a dual mandate of the US Fed kind – low inflation and employment growth being the combined objective of monetary policy – has been  anathema to our determined inflation fighters.

Shocks to the price level caused by exchange rate weakness – unrelated to immediate monetary policy settings and inflation trends – are clearly not ignored when interest rates are set. Yet such shocks- decidedly not of the Reserve Bank’s doing-  lead inevitably to more inflation – then higher interest rates – and in turn still weaker demand – already under pressure from higher prices. Higher prices have their complex causes- but they also have (rationing effects) on the willingness to spend more- given minimal growth in income

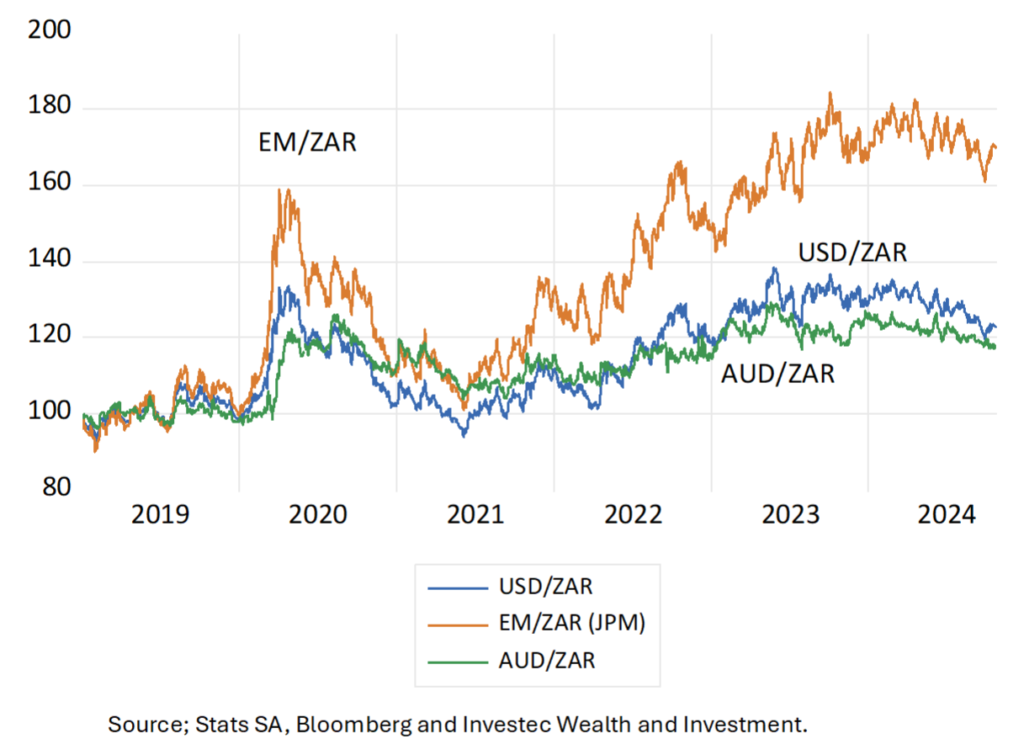
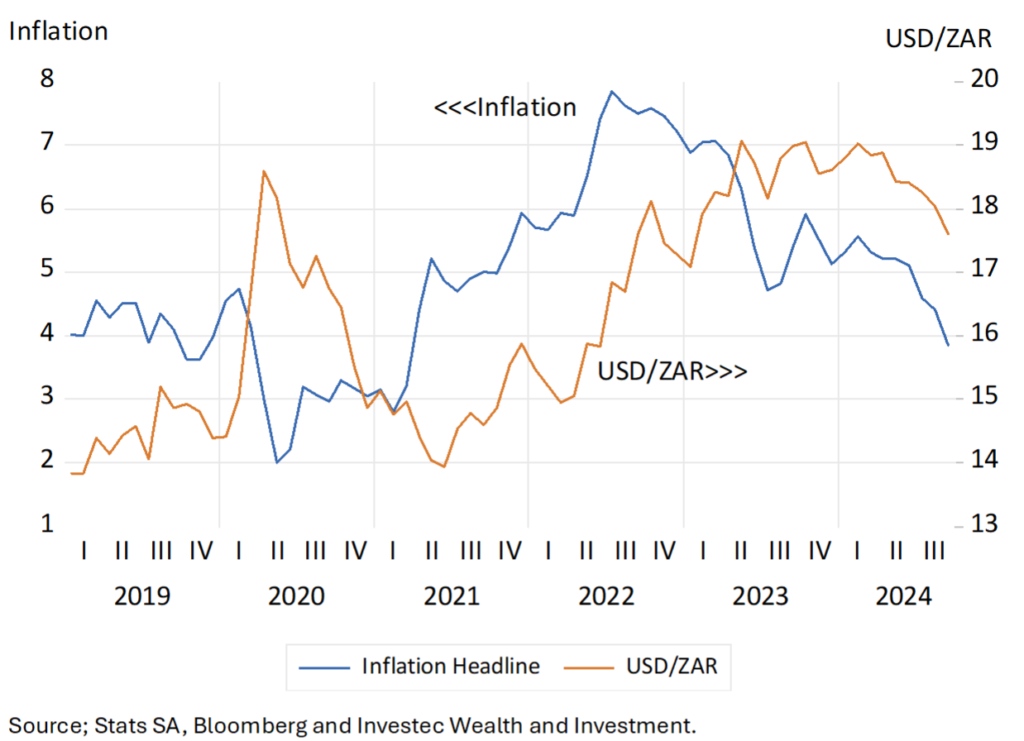
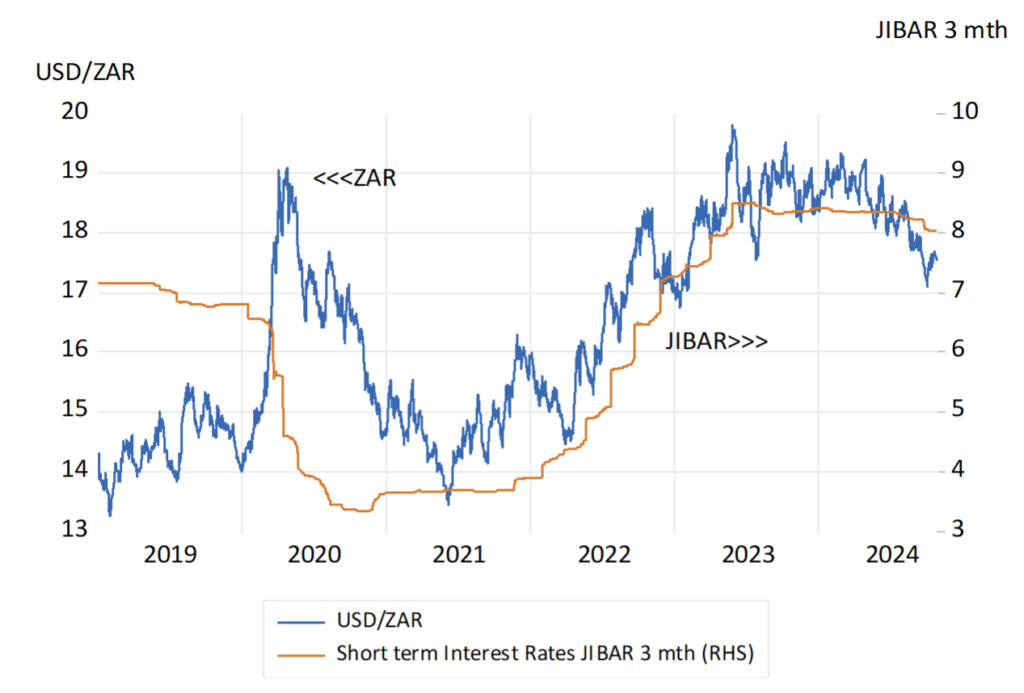
The problem for SA and the Reserve Bank was that the ZAR weakened decidedly after 2021- and weakened against not only the US dollar but also vs other EM and commodity currencies. It was SA specific in nature clearly linked to the failures of government and the failure of the economy to grow that added to SA specific risks. The USD/ZAR, as had the average EM/ZAR and AUD/ZAR had recovered well from the Covid linked risk aversion that brought pressure on the ZAR and the market in SA Bonds. SA appears particularly vulnerable to Global Risk aversion. It may be recalled that the USD/ZAR had recovered to as little as R14 in early 2021. But then the sense of South African failures to realise economic growth took over the currency and Bond markets . And the weaker rand inevitably forced prices higher at a faster rate. Given the MO of the Reserve Bank.

The ZAR Vs the USD, the EM Basket and the Aussie Dollar. Daily Data 2019-2024 (2019=100)

                Source; Stats SA, Bloomberg and Investec Wealth and Investment.

Interest rates and the USD/ZAR 2019-2024. Monthly Data to September 2024

Source; Stats SA, Bloomberg and Investec Wealth and Investment.

The ZAR and Short-term Interest Rates. Daily Data (2019-2024)

Source; Stats SA, Bloomberg and Investec Wealth and Investment.

The connection between the foreign and domestic exchange value of the ZAR and the outlook for the SA economy has never been clearer. The GNU has raised the prospects for growth and the ZAR and the bond and equity markets have responded accordingly. Inflation is therefore on the way down. Over the past three months it has averaged but 2.4% p.a. Interest rates at the short end of the market have come down and will come down further provided the ZAR holds up. Not so much vs the US dollar, that may be getting a Trump boost, but also against the other currencies similarly affected by the USD. We should not expect the Reserve Bank to change its pro-cyclical approach. We should but insist and hope that the supply side weaknesses of the SA economy are well addressed. Raising the GDP growth rates to a modest 3% p.a. will not only promote economic and political stability, it will bring lower interest rates and less inflation.