US Tax reform- how to respond effectively

The leaked “Paradise Papers” reveal how global companies minimize their tax payments by (legally) routing revenue and taxable earnings through low tax or no tax jurisdictions. Such revelations should not be a surprise given the significant differences in company tax rates and tax systems across tax regimes that influence corporate actions.

The obvious solution to this reality is not to tax companies at all. Rather to tax all the income generated by business operations for their many dependents, where they reside at the personal income rate. Though the very highly income taxed may still decide to live in Monaco, the Bahamas or Mauritius – a freedom they should not be denied and where they may well be subject to high expenditure and property taxes.

The owners of businesses can be taxed on the dividends received and the wealth (capital) gains, realized and unrealized gains generated for them. Their lenders can all be taxed on the interest received from business borrowers. All landlords including institutional owners can be taxed on their rental income.

And those employees receiving benefits in cash or kind, including contributions the firms make on their behalf to pension plans and social security funds, can as usual have taxes withheld from them by their employers and passed on to the government. Indeed fuller use of businesses  as tax collectors. Forcing them to withhold income of all kinds, for which the individual income tax payer is only later credited. Collection rates are likely to be as good as they are with PAYE and could fully make up for any loss of taxes from companies.

The costs incurred by companies collecting taxes for the government are (understandably) allowed as a deduction from their taxable income. Usually also allowed as a deduction from taxable company income are the interest, rental and employment costs incurred by the firm – though not all interest incurred may be treated the same way. Also allowed as a deductible expense will be a rate of depreciation of the purchase price of plant and equipment, though with different rates applied to similar asset classes in different jurisdictions.  These allowances may or may not approximate the actual loss of market value incurred by the company. And if not will add to or deduct from the economic income being generated.

All companies and individuals have every incentive to manage their tax liabilities as best they can and not only where they best report revenue and income. They may well structure their balance sheets with more risky debt to take advantage of the taxes saved. Debts that may (wrongly) appear cheaper than equity, the opportunity cost of which, is not allowed as a tax expense.

With the elimination of taxes on the income of businesses, all this tax structuring and gaming will disappear. Companies and their auditors would have to determine the measure of income as well as assets and liabilities to report. And so owners and managers would more rationally incur expenses, including interest and depreciation and location costs, regardless of their tax implications.

The US Congress is currently proposing a dramatic reduction in its federal corporate tax rate to 20% to make its companies more competitive. A reduction intended to keep more of them and their taxable income and investment and employment activity at home. There are also tax reforms on the agenda. Among them is to allow firms to fully deduct all capital expenditure (whatever its life) from taxable income- a very important way to increase economic income after taxes. A further proposal is to disallow all interest incurred as a business expense.

This would take the US company tax system close to a very low company tax rate – much lower than 20% in economic effect, given how income is to be defined. It is a new competitive challenge that all other economies will have to confront. The ideal way to compete with the US and all the tax havens is to eliminate the company tax system.

The market and the bookmakers inform us about the ANC succession battle (Update)

Below follows an update on this piece from Monday. 

The immediate outlook for the economy depends on who governs SA after December 2017. Will it be the Zuma faction or some other ANC coalition calling the shots? That is the essential question for the economic outlook and the value of the financial claims on it.  The market in SA assets has made its preferences for much less of President Zuma very clear. RSA risk premiums rise and fall as the expected Zuma influence on policy gains or loses momentum.

On Thursday and Friday last week the market suddenly came to reverse recently very unfavourable trends to register less SA risk. The rand strengthened, not only against the USD, but more meaningfully, also gained against other EM exchange rates.[1] Furthermore not only did RSA bond yields decline late last week – they declined relative to benchmark US yields. Still less SA risk has been registered this week in the foreign exchange markets. The ratio of the USD/ZAR to the USD EM basket (Jan 1st 2017=1) had moved out to 1.104 on the 13th November is 1.065 a relative SA gain of 3.6%

The behaviour of these foreign exchange indicators in 2017 is shown in figure 1 below. As may be seen, despite this recent improvement in sentiment, 2017 has not been a good year for the ZAR. The USD/ZAR weakened relative to its EM peers when Finance Minister Gordhan, in public dispute with the President over spending plans, was sacked in March 2017. It also suffered in response to the Budget statement presented by his successor, Milusi Gigaba in late October, as may also be seen.

The budget disappointment was perhaps not in the details about the revenue shortfall  – this was well telegraphed – but that no revised plan to address the widening fiscal deficit was offered. The concern was presumably that Zuma and his cohort would soon announce more government spending, on nuclear power or students, rather than less,  regardless of the fiscal constraints.

Fig.1; The USD/ZAR and the USD/EM exchange rate basket in 2017. Daily Data January 1st=100 to November , 23rd  OR ratio (LHS) =1

b1Source; Bloomberg and Investec Wealth and Investment

Though perhaps a little longer perspective on SA risk indicators is called for, as is provided in figure 2 below. There it may be seen that the ratio of USD/ZAR exchange rate to the USD/EM currency basket, weakened significantly in December 2015, when Finance Minister Nene was so surprisingly sacked. However as may be seen in the figure, the rand in a relative and absolute sense did very much better in 2016. Perhaps because the decision Zuma made under pressure from colleagues and the business community to immediately reappoint Pravin Gordhan, indicated less rather than more power to the President. A sense perhaps that the market had gained of Zuma overreach and a degree of vulnerability.   Just how vulnerable is President Zuma remains to be determined- hence market volatility.

Fig 2; The ratio of the USD.ZAR to the USD/EM currency basket (January 2017=1) Daily Data

b2Source; Bloomberg and Investec Wealth and Investment

The indicators derived from the Bond market make the same statements about SA risk. As shown in figure 3 below the spread between RSA and USA government bond yields, the so called interest rate carry that reveals the expected depreciation of the USD/ZAR exchange rate, widened sharply as the rand weakened in late 2015. They then narrowed through much of 2016, stabilized in 2017 until the Budget disappointment pushed them higher. The difference however between RSA rand bond yields however has widened gain to 7.2% p.a. and is back to levels recorded on the 14th November. The default risk premium attached to five year RSA dollar denominated bonds though has declined further from 208 b.p on the 14th November to 187 b.p on the 23rd November

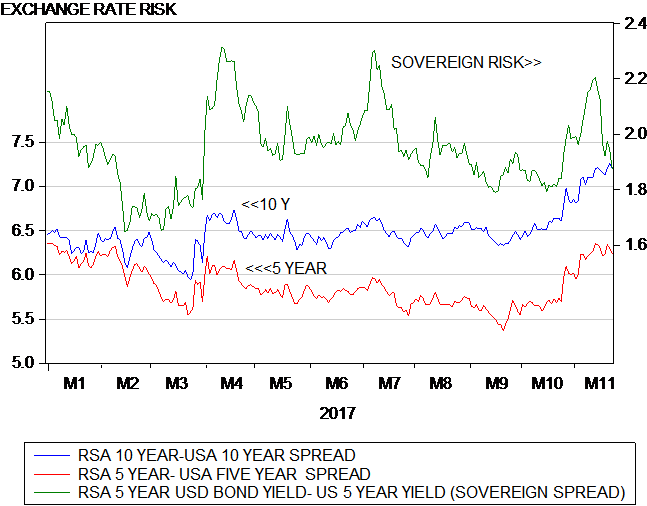
In figure 4 it may also be seen how the RSA sovereign risk premium has behaved in 2017. Sovereign risks are revealed by the spread between the yield on a USD denominated RSA (Yankee)  Bond and its US equivalent. As may be seen this spread has been variable in 2017 – that it increased by 40 b.p. in October – and then declined sharply in the week ending on November 17th.  These spreads indicate that SA debt is already being accorded Junk Status by the market place, ahead of any such ruling by the rating agencies. The spread on the lowest Investment Grade debt would be of the order of 1.6%.

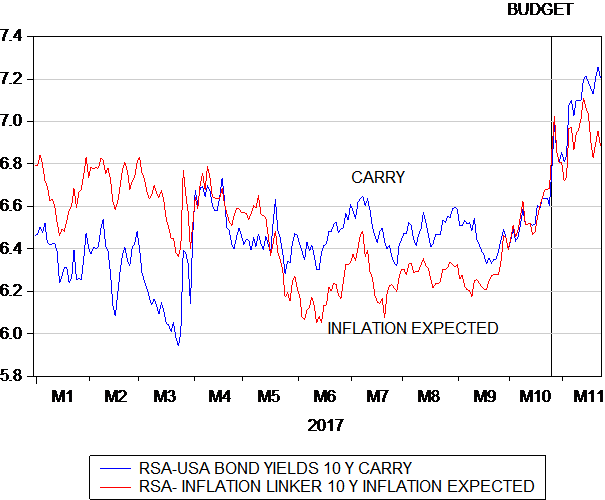
In figure 5 we show the interest carry- the rate at which the USD/ZAR is expected to weaken over the next ten years and inflation expectations. These are measured as the spread between a vanilla bond that carries inflation risk and an inflation linker of the same duration that avoids inflation risk. As may be seen more inflation expected is strongly connected to the rate at which the ZAR is expected to weaken. It should be recognized that the weaker the rand the more it is expected to weaken further. It will take a stronger rand to reduce inflation expected- a welcome development that is beyond the influence of interest rates themselves.

Fig.3; The USD/ZAR and the Interest Rate Spreads. Daily Data 2015 to November 23, 2017

b3Source; Bloomberg and Investec Wealth and Investment

Fig.4; The RSA sovereign risk premium and the interest carry. Daily Data 2017.

b4Source; Bloomberg and Investec Wealth and Investment

Fig.5: The interest rate carry and inflation compensation in the RSA bond market. Daily Data 2017.

b5


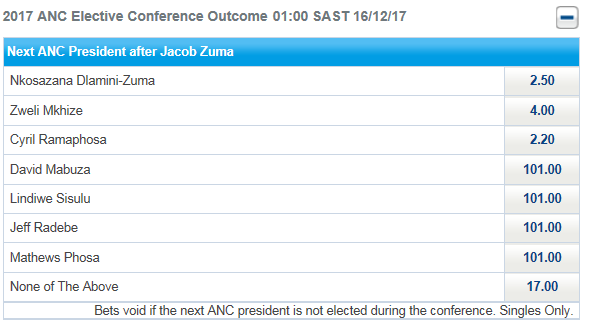
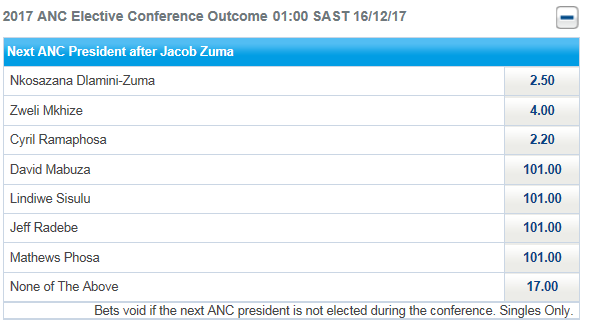
The market place, as well as the bookmakers, will continuously update the odds of one or other candidate for the Presidency of the ANC ( now very probably) being determined in December 2017.  The odds offered by Sportingbet at 13h00 on November 20, 2017 are shown in the Table below. (www.sportingbet.co.za ) They have not changed since- indicating perhaps a lack of betting activity. These odds imply a 40% chance of Dlamini-Zuma winning the nomination and a 45% chance for CR. As they say in racing circles- the favourite does not always win- but don’t bet against it.

Lower South African risks and the stronger rand and lower interest and inflation rates associated with rand strength are good for the economy and all the businesses and their stakeholders dependent on the economy. One prediction can be made with some degree of conviction. That is without less SA risk any cyclical recovery in the SA economy is unlikely.

b6


Additional Figures

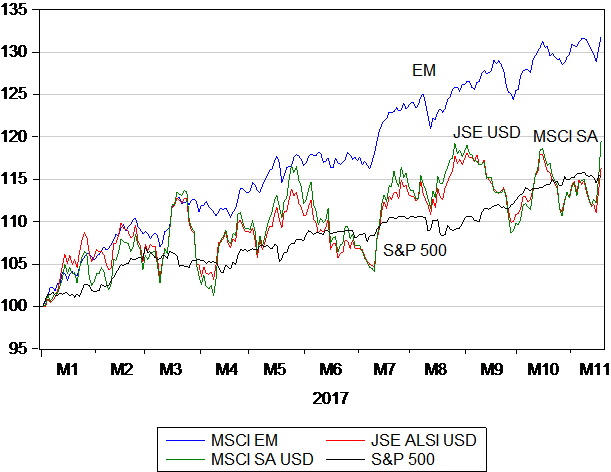
Equity performance in 2017 to November 17th Daily Data

b7

Credit Default Swap Spreads over US Treasuries 5 year;  Daily Data 2015-2017

b8

Credit Default Swaps over US Treasuries, 5 year Daily Data to November 17th 2017.

b9

[1] Our construct for Emerging Market exchange rates that exclude the ZAR  is an equally weighted nine currency basket of the Turkish Lire, Russian Ruble, Hungarian Forint, Brazilian Real, Mexican, Chilian and Philippine Pesos, Indian Rupee and Malaysian Ringit


The market tells us about the ANC succession battle

 The outlook for the SA economy depends on who governs after December 2017. Will it be the Zuma faction or some other ANC coalition calling the shots? That is the essential question for the economy and the value of the financial claims on it.  The market in SA assets has made its preferences for much less of President Zuma very clear. RSA risk premiums rise and fall as the expected Zuma influence on policy gains or loses momentum.

On Thursday and Friday last week the market registered less SA risk as the rand strengthened, not only against the USD, but more meaningfully the rand also gained against other EM exchange rates.[1] Furthermore not only did RSA bond yields decline late last week – they declined relative to benchmark US yields. The political developments that actually moved the market are however not that obvious.

The behaviour of these indicators in 2017 is shown in figure 1 below. As may be seen 2017, despite this recent improvement in sentiment, has not been a good year for the ZAR. It weakened relative to its EM peers when highly respected Finance Minister Gordhan was also sacked in March. It also suffered in response to the Budget statement of his successor in late October, as may also be seen.

The budget disappointment was perhaps not in the details about the revenue shortfall  – that were well telegraphed – but that no revised plan to address the widening fiscal deficit was offered. The concern was presumably that Zuma and his cohorts would soon announce more rather than less government spending regardless of the fiscal constraints.


Fig.1; The USD/ZAR and the USD/EM exchange rate basket in 2017. Daily Data January 1st=100 or ratio (LHS) =1


a1


Source; Bloomberg and Investec Wealth and Investment


Though perhaps a little longer perspective on SA risk indicators is called for, as is provided in figure 2 below. There it may be seen that the ratio of USD/ZAR exchange rate to the USD/EM currency basket, weakened significantly in December 2015, when Finance Minister Nene was so surprisingly and ignominiously sacked. However as may be seen in the figure, the rand in a relative and absolute sense did very much better in 2016. Perhaps because the decision Zuma made under pressure from colleagues and the business community to immediately reappoint Pravin Gordhan, indicated less rather than more power to the President. A sense perhaps that the market had gained of Zuma overreach and a degree of vulnerability.   Just how vulnerable remains to be determined- hence market volatility.

Fig 2; The ratio of the USD.ZAR to the USD/EM currency basket (January 2017=1) Daily Data

a2Source; Bloomberg and Investec Wealth and Investment


The indicators derived from the Bond market make the same statements about SA risk. As shown in figure 3 below the spread between RSA and USA government bond yields, the so called interest rate carry that reveals the expected depreciation of the USD/ZAR exchange rate widened sharply as the rand weakened in late 2015. They then narrowed through much of 2016, stabilized in 2017 until the Budget disappointment pushed them higher. In figure 4 it may also be seen how the RSA sovereign risk premium has behaved in 2017. Sovereign risks are revealed by the spread between the yield on a USD denominated RSA (Yankee)  Bond and its US equivalent. As may be seen this spread has been variable in 2017 – that it increased by 40 b.p. in October – and then declined sharply in the week ending on November 17th.  These spreads indicate that SA debt is already being accorded Junk Status by the market place, ahead of any such ruling by the rating agencies. The spread on the lowest Investment Grade debt would be of the order of 1.6%.

In figure 5 we show the interest carry- the rate at which the USD/ZAR is expected to weaken over the next ten years and inflation expectations. These are measured as the spread between a vanilla bond that carries inflation risk and an inflation linker of the same duration that avoids inflation risk. As may be seen more inflation expected is strongly connected to the rate at which the ZAR is expected to weaken. It should be recognized that the weaker the rand the more it is expected to weaken further. It will take a stronger rand to reduce inflation expected- a welcome development that is beyond the influence of interest rates themselves.


Fig.3; The USD/ZAR and the Interest Rate Spreads. Daily Data 2015-2017

a3Source; Bloomberg and Investec Wealth and Investment
Fig.4; The RSA sovereign risk premium and the interest carry. Daily Data 2017.

a4Source; Bloomberg and Investec Wealth and Investment 

Fig.5: The interest rate carry and inflation compensation in the RSA bond market. Daily Data 2017.

a5

The market place, as well as the bookmakers, will continuously update the odds of one or other candidate for the Presidency of the ANC ( probably) being determined in December 2017.  The odds offered by Sportingbet at 13h00 on November 20, 2017 are shown in the Table below. (www.sportingbet.co.za ) As they say in racing circles- the favourite does not always win- but don’t bet against it.

Lower South African risks and the stronger rand and lower interest and inflation rates associated with rand strength are good for the economy and all the businesses and their stakeholders dependent on the economy. One prediction can be made with some degree of conviction. That is without less SA risk any cyclical recovery in the SA economy is unlikely.

a6


[1] Our construct for Emerging Market exchange rates that exclude the ZAR  is an equally weighted nine currency basket of the Turkish Lire, Russian Ruble, Hungarian Forint, Brazilian Real, Mexican, Chilian and Philippine Pesos, Indian Rupee and Malaysian Ringit

A world of exchange rate volatility – tough on trade and central banks

SA is very open to international trade. The aggregate value of imports and exports in any year is equal to 50% of GDP. Yet all this great volume of trade across borders is subject to highly volatile exchange rates. This volatility adds considerable risks to exporters, importers and those who compete with imports and exports in the local market.

What matters for the operating margins of businesses is exchange rates adjusted for differences in inflation between trading partners. These are known as real exchange rates. An undervalued exchange rate will add to profit margins, while an overvalued one – should the exchange rate change by less than the differences in inflation – will depress margins.

When the offset is complete, or when what is gained or lost on the exchange rate is equal to the difference in inflation rates, purchasing power parity (PPP) exchange rates are said to hold. In such a case, the prices of common goods or services delivered in any market place will be about the same when expressed in any common currency. Real exchange rates above 100 indicate overvalued exchange rates while real exchange rates below 100 indicate the opposite: an undervalued or generally competitive exchange rate.

It is however changes in nominal exchange rates that are the predominant force behind changes in the real exchange rate. In SA and elsewhere, frequent shocks to the exchange rates lead the process and inflation rates follow.

However the SA experience with real exchange rate volatility is by no means unique. The trade-weighted real US dollar exchange rate has been even more variable than the real rand exchange rate. And those of Europe and the UK are similarly variable.

In figure 1 below we show the performance of the US dollar rate of exchange against its developed market peers (DXY). We also show the real dollar exchange rate against its major trading partners. The pattern has been a highly unstable and destabilising one for the global economy, which relies on the US dollar as a reserve currency and unit of account.


We compare below in figure 2 a variety of trade weighted real exchange rates for the period 1995- 2017. As may be seen, all these real exchange rates are highly variable. Not co-incidentally, the real trade-weighted rand moved in very much the opposite direction to the real US dollar. The real euro and real sterling have also been highly variable since 1995. A consistently overvalued, less competitive real sterling between 1996 and 2007 can be identified. More recently, with Brexit in sight, sterling has become much more competitive.


Moreover none of the real exchange rates considered above can pass a statistical test for mean reversion. The Chinese and Japanese real exchange rates trends shown below conspicuously do not revert to the theoretical PPP 100. The real yuan has had a distinct and persistently stronger trend (off what was a very undervalued base in the mid-90s) while the real yen moves persistently weaker off what was presumably a very overvalued base in 1995.


How should monetary policy react to exchange rate shocks?

This global nominal and real exchange rate volatility – as well as the lack of mean reversion to trade neutral purchasing power parity exchange rates – has greatly inconvenienced global trade. It has also greatly complicated the reactions of central banks.

We would argue the best approach central banks should adopt to exchange rate shocks is to ignore them. This is because such shocks are unpredictable and largely beyond their control. They have little to do with competitiveness in international trade and almost all to do with capital flows responding to changes in expected returns across different economies. If such exchange rate shocks are temporary – even perhaps rapidly reversible – the impact they have on inflation will be as temporary. They therefore will not be expected to permanently add to inflation and therefore will not add to expected (forecast) inflation.

It should be recognised that dollar strength and other currency weakness in response to persistent capital flows can persist for an extended period of time. Persistent US dollar strength – against its developed economy peer currencies and against most emerging market currencies – explains much of the nominal and real rand weakness and also emerging market currency weakness observed between 2014 and mid-2016. Ditto the higher inflation rates that followed.

But to react to exchange rate shocks as if they threatened permanently higher inflation is to make monetary policy hostage to the unpredictable US dollar exchange rate. Monetary policy in the emerging market world would do better to moderate rather than exaggerate the shocks to spending intentions and confidence that may emanate from the market in foreign exchange.

Unfortunately the SA Reserve Bank, from early 2014, added higher interest rates to the contractionary forces emanating from a weaker exchange rate. We regard this as an error of monetary policy that unhelpfully further reduced growth rates without any obvious reduction in inflation rates or inflation expected.

The implications of exchange rate volatility for investment portfolios

Monetary policy in the US understandably does not react to the exchange value of the dollar. Thus when investing abroad (investments that always carry extra risks given exchange rate volatility) a bias in favour of US-based investing seems appropriate. Or, in other words, the risks posed by a volatile real and nominal US dollar to monetary policy and real economic activity everywhere else are best hedged by investing in the US rather than in more macro policy error prone economies. 9 November 2017

The Bond market anticipates Reserve Bank reactions to a higher oil price- more bad news for the SA economy.

The bond market anticipates Reserve Bank reactions to a higher oil price – meaning more bad news for the SA economy.

The RSA bond market and the rand weakened on Friday: the yields on RSA bonds rose markedly across the yield curve. The RSA five-year yield added 22bps (0.22 percentage points) and the 10-year yield 24bps.


The spread between RSA yields and their equivalent US Treasury Bond yields (the carry) also widened by about the same number of basis points – indicating that not only did the rand weaken on the day but still more rand weakness was expected on the day.

The gap between RSA five-year and 10-year vanilla bonds and their inflation-linked alternatives also widened, indicating more SA inflation expected over the next five and 10 years, about two tenths of one per cent per annum more inflation expected over the next five and 10 years, with inflation now expected to average almost 7% over the next five and 10 years (see figure 3 below). The real yield on the inflation-linked five-year bond, at 2.43%, was unchanged on Friday, indicating that the higher nominal bond yields reflected a changed view of the outlook for inflation.

Further confirmation that it was inflation expected rather than real forces at work was that the sovereign risk spread was largely unchanged on the day. The extra yield offered on an RSA US dollar-denominated bond edged up only marginally, while the cost of a CDS swap that insures RSA debt against default, actually declined on the day (see below).


A large part of the rand weakness on Friday can be attributed to global rather than SA-specific forces at work, in the form of a degree of US dollar strength against both its peers (the euro et al) and against an Index of emerging market currencies that accords an 8.33% weight to the rand (see below).


Having identified more inflation expected behind the higher RSA bond yields and spreads, it remains the task to explain why inflation should have been expected to increase. Perhaps it has something to do with higher oil and metal prices. A combination of a higher oil price in US dollars and a weaker rand would be expected to add to inflationary pressures and depress domestic spending. The rand and US dollar price of a barrel of oil did spike higher on Friday. We can only hope that this supply side shock for inflation will be ignored by the Reserve Bank. Past performance alas makes it likely that the Reserve Bank would raise rather than leave interest rates alone in such circumstances. Perhaps this was also behind the spike in RSA interest rates across the yield curve. Short rates also rose on Friday, indicating an expectation that the Reserve Bank is more likely to increase the repo rate.

Our argument is not with the market but with the Reserve Bank that continues to treat supply side shocks to inflation as if they are permanent rather than temporary. Given all else that plagues the economy, such possible monetary policy reactions can make even the strongest still standing feel very weak. 7 November 2017