The improved return on capital invested by SA business

By Brian Kantor and David Holland

Why it is good economic news even though the new darling of the left, Thomas Piketty, thinks that high returns on capital raise income inequalities and thus should not be encouraged.

A success story – improved returns on capital realised by JSE listed companies

If a company can generate a return on capital that beats the opportunity cost of the capital it employs, it will create shareholder value. The market will reward the successful company with a value that exceeds the cash invested in the company.

The inflation-adjusted cash flow return on operating assets, CFROI®, for listed South African firms has improved consistently and impressively since the 1990s. Using CFROI® we have been able to demonstrate that political freedom has proved fruitful for SA businesses and their shareholders.

The economic return on capital has improved spectacularly over time, with today’s median firm reporting a very healthy CFROI of 10%. Until 1994, the average South African company was sporting a CFROI at or below the global average of 6%. South African companies were generally destroying shareholder value before 1994, especially when considering how much higher the real cost of capital would have been in those highly uncertain times.

Since 1994, the median CFROI has sloped upwards and remained above 6%. The new South Africa has been a value-creating South Africa! Note that at the peak of the commodity super cycle in 2007-8, the median CFROI was a stunning 12%. The top and bottom quintiles have also sloped upwards, indicating greater value creation for the best firms and less value destruction for the worst firms. Presently, 20% of South African firms are generating economic returns on capital above 15%, which is world-class profitability.

The benefits of efficient business and excellent returns on capital can be widely shared in inclusive share ownership, through pension and retirement plans as well as perhaps via a sovereign shareholding fund that can be built up to fund genuine poverty relief and opportunities for the poor. Broad-based empowerment in the form of employee- and community-based share options can be used to turn outsiders into insiders.

Such attempts to broaden the ownership of productive capital perhaps accord well with the recently revived critics of capitalism, following Piketty, who have found new reasons to question the advantages to society of high returns on capital. It is argued that such high returns on capital may well increase inequalities of income because they go mainly to the wealthy. Even should such high returns raise the rate at which national income is increasing, it makes such outcomes a mixed blessing, especially for those who have come to regard income equality as an important goal of economic policy.

Some facts about the distribution of SA incomes, taxes and government expenditure.

Let us give a South African nuance to this debate. Any discussion of the causes and consequences of economic growth and the distribution of benefits always has a distinctly racial bias in that white South Africans, on average, enjoy significantly higher incomes than black South Africans.

The distribution of wealth in South Africa is even more unevenly distributed in favour of white South Africans, given the much higher past incomes and the savings realised from them. The middle and higher income classes, those who are likely to become important sources of savings and contributors to pension and other funds, are increasingly made up of black South Africans. The times are changing and dramatically so, Loane Sharp, labour market analyst writing for Adcorp, indicates:

“Changes in the labour market after the end of apartheid have worked spectacularly well for blacks. Since 1995, on a like-for-like basis adjusting for skills, qualifications and work experience, blacks’ wages have been rising at 15% per annum whereas whites’ wages have been rising at just 4% per annum. Average wages for blacks and whites should converge as early as 2021 though, admittedly, average wages for entire race groups belie vast variations between individuals. The number of high-earning blacks – that is, those earning more than the average white – has increased from 180,000 in 2000 to 1.5 million today, with more than 40% of these employed in the public service, which has been used to great advantage, much like the predecessor apartheid state, to promote the welfare of a particular racial group.” (Source: Adcorp Employment Survey.)

According to the UCT Unilever Institute, the black middle class went from 1.7 million in 2004 to 4.2 million in 2012 to 5.4 million in 2014. The white middle class has been roughly stagnant: 2.8 million in 2004 to 3.0 million in 2014 (Source: UCT Unilever Institute). The number of high-earning blacks (i.e. those earning more than the average white) went from 120,000 in 2001 to 1.9 million in 2014 – 77% of these were in the private sector (Source: Adcorp).

The income differences within the different racial groups have probably widened with the rapid growth in the black middle class and the transformation of the public service that now provides much less protection for low-skilled whites. Most important, the unemployment rates indicate that a regrettably low percentage of the potential black labour force is not working in the formal sector and therefore not earning or reporting any income.

The income statistics and the GINI coefficient that measures income inequalities in SA do not indicate the important role the SA government plays in ameliorating poverty and therefore supporting consumption expenditure. The distribution of expenditure, including the benefits of expenditure by government agencies, especially if divided by racial categories, will look very different to the distribution of income or wealth. Of all government expenditure, equivalent to 33% of GDP, some 60% is classified as social services, that is spending by government on health, education and protection services. Much of these budgets are allocated to the improved employment benefits of the black middle class who work for government, supplying so-called social services. But measuring the quality of delivery is much more difficult than measuring how much is spent on them.

Yet of this expenditure on welfare, spending that constitutes 60% of all government expenditure, some 15% or nearly 5% of GDP, consists of cash supplied on a means tested basis to the identified poor. That is cash paid monthly as old age pensions, child support grants or disability grants. These payments have been growing strongly over the years, keeping up fully with inflation, and have provided an important form of poverty relief.

The taxpayers who have paid for this relief (and other government expenditure) are to an important degree income tax payers. Of all government revenues, which amount to about 30% of GDP, some 55% come from taxes on income and profits of businesses. Registered companies are budgeted to contribute nearly 35% of these income and profit taxes, or nearly 20% of all government revenue, in this financial year 2014-15. Of the personal income taxpayers, the highest income earners, those expected to earn over R750,000, will pay over 40% of all the income tax collected, while earning about 24% of all personal incomes – which include all reported income, interest, dividends and rents generated from assets.

These relatively high income earners constitute only 4.6% of all the 15.254 million potential income tax payers on the books of the SA Revenue Service (SARS). Of these registered for income tax purposes, some 8.835 million will fall below the income tax threshold of R70,000 income per annum and so will not contribute income tax. These low income earners will generate only 11.5% of all expected reported incomes in fiscal year 2014/15. (Source: Budget Review 2014, National Treasury, Republic of South Africa, Table 4.2).

These statistics from SARS confirm how unevenly distributed income is in South Africa and also how much redistribution of income is taking place via income taxes as well as via the distribution of government expenditure, which is biased in favour of the poor.

Higher income South Africans, it should be recognised, will be consuming and paying for almost exclusively private education, health care and will also employ privately supplied security services. The relationship between taxes paid and benefits received is not at all as balanced as it may be in the developed world where the biases in spending are often in favour of the middle class, who make up a large proportion of the electorate. To stay competitive in the global market for skills, this relatively unfavourable balance of taxes paid for benefits received by the high income earners and income tax payers has to be made up in the form of higher pre-tax salaries – purchasing power adjusted – compared to employment benefits and government services available for scarce skills in the developed world.

The scope for raising income or wealth tax rates would seem very limited – given the mobility of skilled South Africans and their capital. Higher tax rates, at some point, would inevitably mean lower tax revenues. The government appears well aware of this trade off, given that the Budget plan for the next three years is to maintain hitherto very stable ratios to GDP of government expenditure (33%) and government revenues (30%). Clearly the limits to government expenditure and redistribution of incomes will be set by the rate of economic growth. Redistribution with growth, to which efficient use of capital will play an important part, would seem the only realistic option.

Economic reality means tradeoffs, not least for economic policy

That growth in SA historically has occurred unfairly, with unusual degrees of income and wealth differences, is a fact of economic life that even SA governments, whose best intention is to reduce income and wealth inequalities, would have to take account of. Policies designed to achieve greater equality of economic outcomes may restrict growth rates and thus growth in government revenues that support redistribution of income and wealth. These are developments that would make achieving a greater degree of equality of economic outcomes and (what is not the same thing at all) realising less absolute poverty, that much harder to achieve.

South Africans have only to look north to Zimbabwe to recognise how the aggressive redistribution of wealth (without compensation) can destroy wealth creation and economic growth. While perhaps achieving greater equality it has also resulted in significantly greater poverty.

The consequences of income redistribution and transformation in SA: more consumption spending and lower savings.

The transformation of the income levels and prospects of the black middle class in SA as well as the income and welfare support provided for poor South Africans has had the effect of raising consumption spending as a share of GDP and reducing the gross savings rate. Gross savings, of which more than 100% are now made by the corporate sector from cash retained and invested by them, have fallen from around 25% of GDP in the early 1980s to current levels of about 14%. Fortunately the rate of capital formation, encouraged by high returns on capital has held up much better to the advantage of economic growth and tax revenues.

But the difference between domestic capital formation and savings has to be made up by infusions of foreign capital. By definition the difference between national gross savings and capital formation is the current account deficit on the balance of payments (see below).

South Africans have had to rely on foreign capital to an important degree, in order to maintain their consumption expenditure, much influenced as it has been by the transformation of the economy, in the form of the rise of the new middle class and the redistribution of income and government expenditure towards the poor. Foreign investors, essentially attracted by high returns, have become very important shareholders in JSE-listed corporations and rand-denominated government debt. Some 40% of SA government debt denominated in rands is now held by foreign investors. South Africans have been significant net sellers of SA equity and debt and foreigners net buyers over recent years.

Raising consumption expenditure rates has been no free lunch for South African wealth owners. They have had to gradually give up a share of their wealth and income from capital invested in JSE -listed companies, mostly held in the form of pension and retirement funds managed for them, to foreign share and debt holders. Of the current account deficit, which is running at about 6% of GDP, an increasing proportion, now equivalent to about half or 3% of GDP, is accounted for by net payments of interest and dividends abroad.

High returns on capital have made higher levels of real expenditure by lower income South Africans and previously disadvantaged black South Africans not only possible, but relatively painless for the wealthy share and debt holders who have gained directly from a rising share and debt market. The tax outcomes, and strongly rising government revenues, have not destroyed this growth process.

The implications for South Africa seem clear enough: to encourage economic growth so as to be able to redistribute more income and wealth to the poor. Any bias in favour of redistribution without growth would be destructive of wealth and incomes. Local and foreign investors, upon whom we depend to maintain our current levels of income and expenditure, don’t like uncertainty and much prefer transparency in government and corporate policy.

If global risk appetite is diminished, then shareholders in all countries will suffer. But those with the least uncertainty when it comes to corporate governance, government policy, inflation, and tax policy will be perceived as safe and suffer less. There are immense benefits to aligning policy with uncertainty reduction. A lower real cost of capital will increase market values, and make marginal investments more attractive. This fuels growth and reinvestment, which create more jobs and tax revenue. Typically, a 1% change in the cost of capital or required returns for investors means a 20% change in equity valuation! This is the old fashioned goal: less risk, more growth should be the aim of economic policy, rather than the chimera of enough income equality.

Pat on the back but much work needs to be done

South African companies should continue to focus on generating world beating returns on capital while government focuses on minimising uncertainty for them. In particular the government should remove the constraints on employment growth in South Africa and encourage labour intensive entrepreneurs to compete with the labour-shy formal business. More competitive labour markets (and the lower labour costs that would come with it) might allow smaller businesses, with less easy access to capital markets, to compete more effectively with formal business, if only they were allowed to do so.

Most important is that South Africans should recognise what should be obvious to all but the ideologically blind. When it comes to delivery, SA business has proved successful and our society should be building on this success. Business to business relationships in SA – subject to competitive forces – work well. By contrast, positive government to business relationships have been profoundly compromised and government delivery of services, despite an abundance of resources provided mostly by taxpayers, has been gravely inadequate.

If we can beat the world in managing businesses for return on capital, we can complete the job in building a South Africa where all prosper. South Africa is its own worst enemy by not according successful business enterprise the respect it deserves from policy makers.

The successes of business can be widely shared beyond current shareholders in the form of higher incomes and in revenues for the state, as well as increased employment. Growth with distribution is a worthy goal for policy and high returns on capital can contribute to this.

David Holland is Senior Adviser, HOLT and adviser to Credit Suisse. The views expressed are his own and not necessarily those of HOLT or Credit Suisse
Bernanke’s legacy: The great (and ongoing) monetary experiment

Ben Bernanke has now retired as Fed chairman, having rewritten the book on central banking.

He has done this not so much by what he and his fellow governors (including his successor Janet Yellen) did to address the Global Financial Crisis (GFC) that erupted in 2008, but by the enormous scale to which he supplied cash to the US and global financial system as well as in injecting new capital to shore up financial institutions whose failure would pose a risk to the financial system.

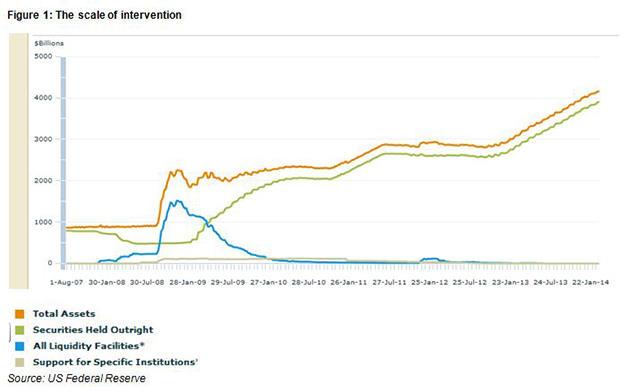
The scale of Fed interventions in the financial markets is indicated in the figure below which highlights the explosive growth in the asset side of its balance sheet. The initial actions taken after the collapse of Lehman Brothers in September 2008, what may be regarded as classical central bank assistance for a financial system in a crisis of liquidity, was superseded by further massive injections of cash into the US and global financial system as the figure makes clear. The cash made available by the central bank in exchange for securities supplied (discounted) by hard pressed banks, when only cash would satisfy depositors and other lenders to banks, alleviated the panic and allowed normally sound financial institutions to escape the run for cash. But Quantitiative Easing (QE) thereafter became much more than a temporary help to the financial system.


Chairman Bernanke recently took the opportunity to explain his actions and the reasoning behind them in a valedictory address to his own tribe (that of professional economists) gathered at the annual meeting of the American Economic Association (AEA) in early January 20141. On the role of a central bank in a financial crisis, he said:

“For the U.S. and global economies, the most important event of the past eight years was, of course, the global financial crisis and the deep recession that it triggered. As I have observed on other occasions, the crisis bore a strong family resemblance to a classic financial panic, except that it took place in the complex environment of the 21st century global financial system. Likewise, the tools used to fight the panic, though adapted to the modern context, were analogous to those that would have been used a century ago, including liquidity provision by the central bank, liability guarantees, recapitalization, and the provision of assurances and information to the public.”

Furthermore:

“The Federal Reserve responded forcefully to the liquidity pressures during the crisis in a manner consistent with the lessons that central banks had learned from financial panics over more than 150 years and summarized in the writings of the 19th century British journalist Walter Bagehot: Lend early and freely to solvent institutions. However, the institutional context had changed substantially since Bagehot wrote. The panics of the 19th and early 20th centuries typically involved runs on commercial banks and other depository institutions. Prior to the recent crisis, in contrast, credit extension …….. Accordingly, to help calm the panic, the Federal Reserve provided liquidity not only to commercial banks, but also to other types of financial institutions such as investment banks and money market funds, as well as to key financial markets such as those for commercial paper and asset-backed securities. .Because funding markets are global in scope and U.S. borrowers depend importantly on foreign lenders, the Federal Reserve also approved currency swap agreements with 14 foreign central banks.

“Providing liquidity represented only the first step in stabilizing the financial system. Subsequent efforts focused on rebuilding the public’s confidence, notably including public guarantees of bank debt by the Federal Deposit Insurance Corporation and of money market funds by the Treasury Department, as well as the injection of public capital into banking institutions. The bank stress test that the Federal Reserve led in the spring of 2009, which included detailed public disclosure of information regarding the solvency of our largest banks, further buttressed confidence in the banking system.”

In the accompanying notes to his speech, the following explanations of shadow banking as well as the special arrangements made to boost liquidity were specified as follows:

“Shadow banking, as usually defined, comprises a diverse set of institutions and markets that, collectively, carry out traditional banking functions–but do so outside, or in ways only loosely linked to, the traditional system of regulated depository institutions. Examples of important components of the shadow banking system include securitization vehicles, asset-backed commercial paper conduits, money market funds, markets for repurchase agreements, investment banks, and nonbank mortgage companies.

“ Liquidity tools employed by the Federal Reserve that were closely tied to the central bank’s traditional role as lender of last resort involved the provision of short-term liquidity to depository and other financial institutions and included the traditional discount window, the Term Auction Facility (TAF), the Primary Dealer Credit Facility (PDCF), and the Term Securities Lending Facility (TSLF). A second set of tools involved the provision of liquidity directly to borrowers and investors in those credit markets key to households and businesses where the expanding crisis threatened to materially impede the availability of financing. The Asset-Backed Commercial Paper Money Market Mutual Fund Liquidity Facility (AMLF), the Commercial Paper Funding Facility (CPFF), the Money Market Investor Funding Facility (MMIFF), and the Term Asset-Backed Securities Loan Facility (TALF) fall into this category.”

The initial injections of liquidity by the Fed to deal with the crisis was followed by actions that did write a further new page to the central bankers’ play book. That is, in the form of very large and regular additional injections of additional cash into the financial system, made on the Fed’s own initiative, in the form of a massive bond and security buying programme, which accelerated in late 2011 and early 2013 (QE2 and QE3) that was undertaken not so much to shore up the financial system that had stabilized, but undertaken as conventional monetary policy to influence the state of the economy by managing key interest rates and especially mortgage rates.

Usually, monetary policy focuses on changes in short term interest rates, leaving long term interest rates and the slope of the yield curve to the market place. But in the US, the mortgage rate, so important for the US housing market, is a long term fixed rate of interest linked to long term interest rates and US Treasury Bond Yields. These long term fixed mortgage rates (30 year loans) available to homeowners are made possible only with the aid of government, in the form of the government sponsored mortgage lending bodies Fannie Mae and Freddy Mac, whose lending practices did so much to precipitate the housing boom and bust and were particularly in need of rescuing by the US Treasury. Their roles in the crisis do not feature in the Bernanke speech made to the AEA.

The state of the US housing market is a crucial ingredient for improving the state of US household balance sheets that are so necessary if households are to spend more in order that  that the US economy can recover from recession. Households account for over 70% of all final demands in the US and only when households lead can firms be expected to follow with their own spending plans. These household balance sheets had been devastated by the collapse in house prices, by 30% on average from the peak in 2006 to the trough in average house prices in 2011. It was this boom in house prices followed by a collapse in them that was the proximate cause of the financial crisis itself.

This bubble and bust, after all, happened on Bernanke’s watch as a governor and then as chairman of the Fed, for which the Fed does not take responsibility. A fuller explanation of the deeper causes of the GFC was offered by Bernanke in his speech to the AEA:

“The immediate trigger of the crisis, as you know, was a sharp decline in house prices, which reversed a previous run-up that had been fueled by irresponsible mortgage lending and securitization practices. Policymakers at the time, including myself, certainly appreciated that house prices might decline, although we disagreed about how much decline was likely; indeed, prices were already moving down when I took office in 2006. However, to a significant extent, our expectations about the possible macroeconomic effects of house price declines were shaped by the apparent analogy to the bursting of the dot-com bubble a few years earlier. That earlier bust also involved a large reduction in paper wealth but was followed by only a mild recession. In the event, of course, the bursting of the housing bubble helped trigger the most severe financial crisis since the Great Depression. It did so because, unlike the earlier decline in equity prices, it interacted with critical vulnerabilities in the financial system and in government regulation that allowed what were initially moderate aggregate losses to subprime mortgage holders to cascade through the financial system. In the private sector, key vulnerabilities included high levels of leverage, excessive dependence on unstable short-term funding, deficiencies in risk measurement and management, and the use of exotic financial instruments that redistributed risk in nontransparent ways. In the public sector, vulnerabilities included gaps in the regulatory structure that allowed some systemically important firms and markets to escape comprehensive supervision, failures of supervisors to effectively use their existing powers, and insufficient attention to threats to the stability of the system as a whole.”

The obvious question for critics of Bernanke is why the Fed itself did not do more to slow down the increases in the supply of credit from banks and the so called shadow banks? Perhaps the Fed could not do more, given its lack of adherence to money and credit supply targets and its heavy reliance on interest rates as its principal instrument of policy.

Given what happened in the housing price boom, it seems clear that policy determined interest rates should have been much higher to slow down the growth in credit. But it may also be argued that interest rates themselves are insufficient to moderate a credit cycle. This is an essentially monetarist point not addressed by Bernanke. In other words, to say there is more to monetary policy than interest rates. The supply of money and bank credit is deserving of control according to the monetarist critique. The Bernanke remedy for protecting the system against the prospect of a future financial crisis is predictably familiar: better regulation and more equity on the books of banks and other lenders. It may be argued that there will always be enough capital, regulated or not, in normal times, and too little in any financial crisis regardless of generally well funded financial institutions. Prevention of a financial crisis may prove impossible and the attempt to do so may be costly in terms of too little, rather than too much, lending and leverage in normal conditions (when lenders are appropriately default risk-conscious and do not make bad loans on a scale that makes for a credit and asset price bubble that ends in tears). The cure for a crisis should always be on hand and the Bernanke recipe will hopefully not be forgotten in the good times.

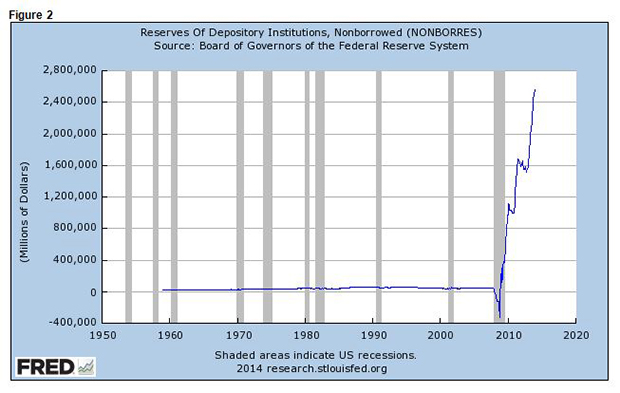
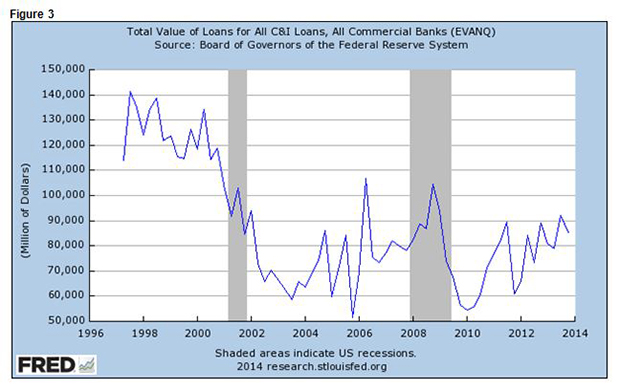
Any current concern about monetary aggregates would have to be on the liabilities side of the Fed balance sheet, conspicuous not so much for the volume of deposits held by the member commercial banks with the Fed, but with the historically unprecedented volume or ratio of deposits (cash) held by these banks with the Fed, in excess of their regulated cash reserve requirements. Also conspicuous is the lack of growth in bank lending to businesses – despite the abundance of cash on hand (see figures 2 and 3).


As Bernanke explained:

“To provide additional monetary policy accommodation despite the constraint imposed by the effective lower bound on interest rates, the Federal Reserve turned to two alternative tools: enhanced forward guidance regarding the likely path of the federal funds rate and large-scale purchases of longer-term securities for the Federal Reserve’s portfolio. Other major central banks have responded to developments since 2008 in roughly similar ways. For example, the Bank of England and the Bank of Japan have employed detailed forward guidance and conducted large-scale asset purchases, while the European Central Bank has moved to reduce the perceived risk of sovereign debt, provided banks with substantial liquidity, and offered qualitative guidance regarding the future path of interest rates.”

The use of forward guidance to help the market place forecast the path of interest rates more accurately, so reducing uncertainties in the market place leading hopefully to better financial decisions, predates the Bernanke chairmanship of the Fed. However, he should be credited with taking the Fed to new levels of transparency and much improved communication with both the marketplace and the politicians. In Bernanke’s words:

“The crisis and its aftermath, however, raised the need for communication and explanation by the Federal Reserve to a new level. We took extraordinary measures to meet extraordinary economic challenges, and we had to explain those measures to earn the public’s support and confidence. Talking only to the Congress and to market participants would not have been enough. The effort to inform the public engaged the whole institution, including both Board members and the staff. As Chairman, I did my part, by appearing on television programs, holding town halls, taking student questions at universities, and visiting a military base to talk to soldiers and their families. The Federal Reserve Banks also played key roles in providing public information in their Districts, through programs, publications, speeches, and other media.

The crisis has passed, but I think the Fed’s need to educate and explain will only grow.”

Historically US banks held minimum excess cash reserves, meeting any demand for cash by borrowing reserves in the Federal Funds market (the interbank market for cash), so making the Fed Funds rate the key money market rate and the instrument of Fed monetary policy. Holding idle cash is not usually profitable banking – but it has become so to an extraordinary degree. Furthermore, the large volume of excess reserves means that short term interest rates fall to zero from which they cannot fall any further. The reason they have remained above zero is that the Fed has been willing to reward the banks for their excess reserves by offering 0.25% p.a on their deposits with the Fed.

Every purchase of bonds or mortgage backed securities made by the Fed in its asset purchase programme must end up on the books of a bank as a deposit with the Fed. But before the extra phases of QE, the banks would make every effort to put their cash to work earning interest rather than holding them largely idle (as they are now doing). But it would appear that the Fed expects the demand for excess cash to remain a permanent feature of the financial landscape and can cope accordingly.

According to Bernanke:

“Large-scale asset purchases have increased the size of our balance sheet and created substantial excess reserves in the banking system. Under the operating procedures used prior to the crisis, the presence of large quantities of excess reserves likely would have impeded the FOMC’s ability to raise short-term nominal interest rates when appropriate. However, the Federal Reserve now has effective tools to normalize the stance of policy when conditions warrant, without reliance on asset sales. The interest rate on excess reserves can be raised, which will put upward pressure on short-term rates; in addition, the Federal Reserve will be able to employ other tools, such as fixed-rate overnight reverse repurchase agreements, term deposits, or term repurchase agreements, to drain bank reserves and tighten its control over money market rates if this proves necessary. As a result, at the appropriate time, the FOMC will be able to return to conducting monetary policy primarily through adjustments in the short-term policy rate. It is possible, however, that some specific aspects of the Federal Reserve’s operating framework will change; the Committee will be considering this question in the future, taking into account what it learned from its experience with an expanded balance sheet and new tools for managing interest rates.”

It seems clear that the market is not frightened by the prospect that abundant supplies of cash will in turn lead to more inflation as the cash is lent and spent, as monetary history foretells. The market clearly believes in the capacity of the Fed to remove the proverbial punchbowl before the party gets going. Judged by the difference between yields on vanilla Treasury bonds and their inflation protected alternatives, inflation of no more than 2% a year is expected in the US over the next 20 years. According to Bernanke, who is much more concerned with the dangers of deflation, arguing that inflation of less than 2% should be regarded as deflation (given the hard to measure improvements in the quality of goods and services). Therefore if inflation is less than 2% this becomes an argument for more, rather than less, accommodative monetary policy by the Fed.

The market clearly finds the Bernanke arguments and guidance highly convincing. These expectations are a measure of Bernanke’s success as a central banker. He has surely helped save the financial system from a potential disaster and has done so without adding to fears of inflation.

The US economy has not however enjoyed the strong recovery that usually follows a recession. Bernanke has some explanation for this tepid growth:

“In retrospect, at least, many of the factors that held back the recovery can be identified. Some of these factors were difficult or impossible to anticipate, such as the resurgence in financial volatility associated with the European sovereign debt and banking crisis and the economic effects of natural disasters in Japan and elsewhere. Other factors were more predictable; in particular, we appreciated early on, though perhaps to a lesser extent than we might have, that the boom and bust left severe imbalances that would take time to work off. As Carmen Reinhart and Ken Rogoff noted in their prescient research, economic activity following financial crises tends to be anemic, especially when the preceding economic expansion was accompanied by rapid growth in credit and real estate prices.16 Weak recoveries from financial crises reflect, in part, the process of deleveraging and balance sheet repair: Households pull back on spending to recoup lost wealth and reduce debt burdens, while financial institutions restrict credit to restore capital ratios and reduce the riskiness of their portfolios. In addition to these financial factors, the weakness of the recovery reflects the overbuilding of housing (and, to some extent, commercial real estate) prior to the crisis, together with tight mortgage credit; indeed, recent activity in these areas is especially tepid in comparison to the rapid gains in construction more typically seen in recoveries.”

He also blames the slow recovery on the unintended consequence of unplanned government fiscal austerity:

“To this list of reasons for the slow recovery–the effects of the financial crisis, problems in the housing and mortgage markets, weaker-than-expected productivity growth, and events in Europe and elsewhere–I would add one more significant factor– – 18 – Since that time, however, federal fiscal policy has turned quite restrictive; according to the Congressional Budget Office, tax increases and spending cuts likely lowered output growth in 2013 by as much as 1-1/2 percentage points. In addition, throughout much of the recovery, state and local government budgets have been highly contractionary, reflecting their adjustment to sharply declining tax revenues. To illustrate the extent of fiscal tightness, at the current point in the recovery from the 2001 recession, employment at all levels of government had increased by nearly 600,000 workers; in contrast, in the current recovery, government employment has declined by more than 700,000 jobs, a net difference of more than 1.3 million jobs. There have been corresponding cuts in government investment, in infrastructure for example, as well as increases in taxes and reductions in transfers.

“Although long-term fiscal sustainability is a critical objective, excessively tight near-term fiscal policies have likely been counterproductive. Most importantly, with fiscal and monetary policy working in opposite directions, the recovery is weaker than it otherwise would be. But the current policy mix is particularly problematic when interest rates are very low, as is the case today. Monetary policy has less room to maneuver when interest rates are close to zero, while expansionary fiscal policy is likely both more effective and less costly in terms of increased debt burden when interest rates are pinned at low levels. A more balanced policy mix might also avoid some of the costs of very low interest rates, such as potential risks to financial stability, without sacrificing jobs and growth.”

Bernanke then went on to paint an optimistic picture of the US economy:

“I have discussed the factors that have held back the recovery, not only to better understand the recent past but also to think about the economy’s prospects. The encouraging news is that the headwinds I have mentioned may now be abating. Near-term fiscal policy at the federal level remains restrictive, but the degree of restraint on economic growth seems likely to lessen somewhat in 2014 and even more so in 2015; meanwhile, the budgetary situations of state and local governments have improved, reducing the need for further sharp cuts. The aftereffects of the housing bust also appear to have waned. For example, notwithstanding the effects of somewhat higher mortgage rates, house prices have rebounded, with one consequence being that the number of homeowners with “underwater” mortgages has dropped significantly, as have foreclosures and mortgage delinquencies. Household balance sheets have strengthened considerably, with wealth and income rising and the household debt-service burden at its lowest level in decades. Partly as a result of households’ improved finances, lending standards to households are showing signs of easing, though potential mortgage borrowers still face impediments. Businesses, especially larger ones, are also in good financial shape. The combination of financial healing, greater balance in the housing market, less fiscal restraint, and, of course, continued monetary policy accommodation bodes well for U.S. economic growth in coming quarters. But, of course, if the experience of the past few years teaches us anything, it is that we should be cautious in our forecasts.”

It can be argued by his critics that the Bernanke innovations have been part of the problem rather than the solution. It would be very hard to argue that injecting liquidity and capital into the financial system to avert an incipient financial crisis in 2008-09 was the wrong thing to do. But it may yet be asked, then, if QE2 and QE3 were also necessary? Would not a sooner return to monetary normality have been confidence boosting, rather than undermining, business confidence, which is essential to any sustained recovery? Further bouts of QE have led to large additions to the excess cash held by banks, rather than additional lending undertaken by them that would have helped the economy along. Would the banks and the US corporations have put more of their strong balance sheets to work to help the economy along had monetary policy been less innovative, or at least had QE not been advanced as strongly as it was? Growth in bank credit and money supply (M2) has slowed down rather than picked up in recent years, despite the creation of so much more base money (see the figure on bank lending). That the banks have been able to earn 0.25% on their vast cash balances has surely encouraged them to hold rather than lend out their cash.

Furthermore, while fiscal policy could have been less restrictive in the short run, would any political failure to implement a modest degree of austerity at Federal and State level, not have made households even more anxious about their economic futures and the tax burdens accompanying them, leading to still less private spending?

The performance of the US economy over the next few years will be the test of the Bernanke years. If the US economy regains momentum without inflation, the Bernanke innovations will have proved their worth. They would then provide the concrete evidence that it is possible to create money, à outrance, and then take away the juice when that becomes necessary. Tapering of QE, the initial thought of which that so disturbed the markets in May 2013, is but a first tentative step to the actual withdrawal of cash from the system and the shrinking of the Fed balance sheet. The monetary experiment, conducted with deep knowledge of monetary history and theory that fortunately characterised the Bernanke years, remains an experiment. We must hope for the sake of continued economic progress both in the US and elsewhere that it proves a highly successful experiment.

1The Federal Reserve: Looking Back, Looking Forward, Remarks by Ben S. Bernanke, Chairman Board of Governors of the Federal Reserve System at
Annual Meeting of the American Economic Association
Philadelphia, Pennsylvania
3 January 2014
Source: Federal Reserve System of the United States, Speeches of Governors. All quotations referred to are taken from the published version of this speech.

Easter effects and the economy: A moveable feast

That moveable feast, Easter, is always a complicating factor for economists relying on monthly updates, coming as it often does at different times in either March or April.

Easter is late this year, and this can cause problems for economists, forecasters and policymakers. The President of the European Central Bank, Mario Draghi, informed an interrogator accordingly at his most recent press conference last week of Easter effects – when discussing the of the timing of ECB quantitative easing, an all important issue for the market place.

Question: Can you describe a little bit more what kind of information you are looking for on whether or not these latest inflation figures are changing your medium-term outlook? If you’re not going to act when its 0.5%, what does it take to get you to act on some of these things? And my second question is: you clearly changed the rhetoric a little bit in terms of your willingness to act swiftly – being resolute – but do your rhetoric and your easing bias lose credibility each passing month that you do nothing in the face of these very low inflation rates?

Draghi: On the first point: there are a couple of factors that somehow clouded the analysis of whether this latest inflation data would actually be a material change in our medium-term outlook or not. One has to do with the volatility of services prices and the fact that Easter time this year comes remarkably later than last year. The explanation is that, around Easter time, services expenditure usually goes up – demand for services goes up – especially travel, and this affected last year’s prices and it’s going to affect this year’s prices. So you have a base effect which produced much lower inflation data in March and may well produce higher inflation data next month.

Easter holidays always have an impact on spending in South Africa and flows through shops and show rooms. With Easter coming later this year, economic statistics for March 2014, especially when compared to March last year need to be treated with particular caution. Perhaps the best approach to reading the state of the economy around Easter time would be to take an average of March and April activity.

Our Hard Number Index (HNI) of the state of the SA economy at March month end combines these two very up to date releases – vehicle sales and the notes issued by the Reserve Bank (adjusted for CPI). Both are hard numbers not compromised in any way by the vagaries of sample surveys.

The HNI, as the chart below shows, captures the turning points in the Reserve Bank Coinciding Business Cycle Indicator. This indicator has only been updated to December 2013, making it not very useful as a measure of the current state of the economy. Two months can be a long time in economics as well as politics. The HNI for March is barely changed from the February reading, indicating that the economy has neither picked up nor lost momentum. It remains as it was on course for slower growth.

The HNI turned lower in the third quarter of 2013 while the Reserve Bank Indicator for December was still pointing higher. Numbers above 100 for either Index indicate that the economy is growing, but the HNI suggests that the forward momentum of the economy has slowed down. If present trends continue, the growth rate of the economy will slow down further in the months ahead.

As we also show below, the HNI does a good job approximating the growth trends in real Household Consumption Spending and Gross Domestic Spending (GDE). These add spending by the government sector and spending on capital goods and inventories to the all important household spending category, which accounts for over 60% of all spending. Both growth rates appear to be tracking lower in line with the HNI.

The rand however, as the past weeks have demonstrated, will not have to wait for smaller trade and current account deficits on the balance of payments – it will respond to movements of capital in and out of emerging markets. The best hope for the SA economy over the next two years will be a revival in emerging bond and equity markets that leads to a stronger rand and less inflation. Less inflation, accompanied by (at worst) stable short term interest rates and accompanied by lower rates further along the yield curve, could revive household spending, an essential ingredient if the economy is to grow faster in a sustained way.

A reprise of a rand recovery, accompanied by lower interest rates and less inflation, which led to the boom of 2003-2008, may seem as unlikely now as it did then. Such a scenario may be improbable, but it is not impossible. We must hope for such a fertile egg from the Easter Bunny.

Economic reality and the MPC – coming together?

The first and second meetings of the Monetary Policy Committee (MPC) of the Reserve Bank in 2014 have come and gone and been accompanied by very different reactions in the money market.

The first meeting on 29 January produced a significant interest rate surprise on the upside when the MPC decided to raise its key repo rate by 50bps. The second meeting on 27 March produced a much smaller surprise in the other direction. Note in the chart below that the first upside interest rate surprise in January 2014 was associated with a significantly weaker rand while the surprising downside move in short term interest rates in March was accompanied by a stronger rand. Short term rates are represented in the figure by the Johannesburg interbank rate (Jibar) expected in three months – that is the forward rate of interest implicit in the relationship between the three month and six month JIBAR rate. Changes in this rate indicate interest rate surprises. Hence the inflation outlook deteriorated as interest rates moved higher and improved as interest rates were kept on hold.

This inconsistent and essentially unpredictable relationship between movements in SA interest rates and the rand is clearly coincidental – it is not a causal relationship because the value of the rand is determined by global or (more particularly) emerging market economic forces rather than domestic policy decisions. As we show below, where emerging market equities go, the rand follows. And emerging equity and bond markets are led by global risk appetite. The more inclined global investors are to take on more risk, the better emerging market equities and bonds perform, including those listed on the JSE. The behaviour of SA stocks and bonds and the exchange value of the rand is highly consistent with that of emerging markets genrally as we show in the chart below. The rand follows the Emerging Market Equity Index (MSCI EM) as does the JSE All Share Index (both in US dollars) while both the rand and the JSE respond to the spread between RSA and US Treasury 10 year bond yields that can be regarded as a measure of SA specific exchange rate risk. The wider the spread the more exchange rate weakness expected.

But what does this all mean for monetary policy in SA and for the direction of short term interest rates? As we are all well aware Reserve Bank interest rate settings are meant to hold inflation within its target band of three to six per cent per annum. But inflation takes its cue mostly from the direction of the rand, which is beyond any predictable influence of interest rates – as has been demonstrated once more.

And so the Reserve Bank remains essentially powerless to manage inflation in the face of exchange rate shocks (over which it has no obvious or predictable influence). Interest rates can influence spending in SA, causing the economy to grow faster or slower without necessarily influencing the direction of prices. In other words inflation can rise, as it has done recently, even though the economy has operated well below its potential and will continue to do so. Therefore higher interest rates can  slow the economy down further without causing inflation to fall. This is a painful dilemma of which the MPC seems only too well aware. To quote its statement of 27 March:

“The Monetary Policy Committee is acutely aware of the policy dilemma of rising inflation pressures in a subdued economic growth environment.

“The main upside risk to the forecast continues to come from the exchange rate, which, despite the recent relative stability, remains vulnerable to global rebalancing. The expected normalisation of monetary policy in advanced economies is unlikely to be linear or smooth, and the timing and pace is uncertain.

“The rand is also vulnerable to domestic idiosyncratic factors, including protracted work stoppages, electricity supply constraints, and the slow adjustment of the current account deficit. Pass-through from the exchange rate to prices has been relatively muted to date but there is some evidence that it is accelerating. However, the forecast already incorporates a higher pass-through than has been experienced up to now.

“At the same time, the domestic economic outlook remains fragile, with the risks assessed to be on the downside. Demand pressures remain benign as consumption expenditure continues to slow amid weakening credit extension to households and high levels of household indebtedness. The upward trend in the core inflation forecast is assessed to reflect exchange rate pressures rather than underlying demand pressures.”

So then how should the MPC respond to exchange rate-driven price increases? The obvious answer would appear to be to accept the limitations of inflation targeting in the absence of any predictable reaction of exchange rates to interest rate settings. That is to ignore completely the exchange rate shock effect on inflation and focus on domestic forces that influence the inflation rate: lowering rates when the economy is operating below potential and raising them when spending (led by money and credit growth) is growing so rapidly as to add to inflationary pressures. And to explain very clearly why it would be acting this way.

But this unfortunately is not the way the MPC is still inclined to think. It worries about the inflationary effect of inflationary expectations. To quote its recent statement again:

“Given the lags with which monetary policy operates, the MPC will continue to focus on the medium term inflation trajectory. The committee is aware that too slow a pace of tightening could undermine inflation expectations and may require more aggressive tightening in the future. Consistent with our mandate, a fine balance is required to ensure that inflation is contained while minimising the cost to output”.

The MPC would be well advised to accept another bit of SA economic reality, which is that not only does the exchange rate lead inflation, but inflation itself leads inflation expectations – not the other other way round. There is no evidence that inflationary expectations lead inflation higher or lower. More SA inflation leads to more inflation expected though, as the MPC is well aware, inflation expected has remained remarkably constant over the years: around six per cent per annum that is the upper end of the inflation target band.

The MPC did the right thing this time round not to raise its repo rate. It made a mistake to raise its repo rate at the January meeting. The money market made the mistake of immediately anticipating a further 200bp increase in interest rates by January 2015. The Governor has done very good work guiding the market away from such interest rate expectations that, if realised, would be even more costly to the economy. The money market now expects only a 100bp increase in short term rates by early next year. The market may again be very wrong about this, dependent as the direction of inflation and interest rates are on the behaviour of the rand over the next 12 months. But even good news for the exchange rate will still leave monetary policy in SA on a fundamentally wrong tack. The interest rate cycle in SA, as in any normal economic state of affairs, should be led by the state of the domestic economy, not by the direction of unpredictable global capital.