Bond markets: Fair winds from Tokyo for the bond market

Last week was a poor week for equities. JSE listed equities underperformed their emerging market peers and the rand also weakened in sympathy (see below). The trade weighted rand lost about three per cent by the end of the week.

Somewhat surprisingly – given rand weakness that ordinarily implies more inflation to come – the market in rand denominated fixed interest securities, across the yield curve, had a very strong week. The forward rate agreements offered by the banks moved sharply lower (and bond prices higher) implying, in the market’s view, that there was no chance of an increase in the repo rate over the next 18 months.


The yield curve represented by the zero coupon bonds also moved sharply lower beyond six years’ duration – by over 40 basis points. The implication of this move is that the RSA one year interest rate, while still expected to move higher over the years, is now only expected to breach the 7% level in 2020.

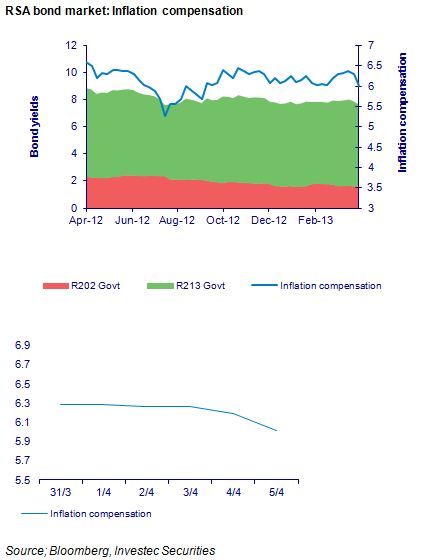
Consistently with these moves lower (in actual and expected interest rates), inflation expectations have declined. These expectations are implicit in the difference between vanilla RSA bonds that are exposed to the risks of higher inflation and the inflation linkers that are fully protected against inflation. This measure ofinflation expected, or more literally compensation for bearing inflation risk, is given much attention by the Reserve Bank. The argument is that inflation expected causes inflation itself, for which incidentally there is little evidence. The feedback loop is from higher inflation to more inflation expected, not the other way around. This measure of inflation expected has remained stubbornly and very consistently above 6% for much of the past few years. That it declined last week will be welcome news to the Reserve Bank and provides further strength to the argument being reflected in the money market that the next move in the repo rate is down rather than up.

The one consolation in the weaker rand is that it is being accompanied by consistent weakness in commodity prices. Generally a trend from which precious and other metals as well as oil have not escaped, so implying less inflationary pressure.

It is the weakness in commodity and metal prices and in emerging equity markets that have weighed on the rand and other emerging and commodity currencies. As we show below, the rand has made some small gains against the Aussie dollar and the Brazilian real since early March, though it did weaken marginally last week.

For global bonds, including the RSA bonds, the commitment to extraordinary money supply growth in Japan and the intention to weaken the yen, brings about the so-called yen carry trade. The difference between interest rates in Japan and almost everywhere else is thus a primary reason for downward pressure on global interest rates. Borrowing in yen and buying rand denominated securities was a poor trade in the first week of April, but a much better one over the past two weeks, notwithstanding the weaker rand against most currencies last week, the yen excepted. Brian Kantor

Monetary policy: A movable feast

Easter is the bane of those who attempt to measure the temperature of an economy. Without a good fix on current activity it is very difficult to forecast the future. The trouble with the Easter festivals is that unlike Christmas celebrations, they come at different times of the year. An early Easter for the average retailer will add to sales in March and reduce them in April and vice versa when Easter falls in April.

For motor dealers the opposite is true. For some reason, obscure to us, probably due to the regulation of their hours of trading, they stay closed on public holidays and Sundays. In other words, unlike your ordinary retailers who stay open on holidays for the convenience of customers and to the advantage of their part time employees, the motor dealers lose trading days over Easter.

This makes the essential seasonal adjustment more difficult to estimate. For retail sales in South Africa, the Christmas influence on spending at retail level, combined as it with the summer holiday effect on spending is very large. For the average South African retailer December month sales on average account for 35% more than the average month. To get a good idea of how good or bad retailers have done in December compared to past Decembers or to November, sales revenues of the average retailer have to be reduced (divided by) a factor of 1.35. For the motor dealer new vehicle unit sales have to be scaled up by 0.85 (ie divided by a factor of 0.85).

Over the longer run March and April on average have proved to be a slightly below sales months for the average retailer: the scaling factor is 0.98 or 0.97. But life is more complicated for the motor dealer. March is usually an above average month, with a scaling factor of 1.08, and presumably March becomes an even stronger month when Easter does not reduce showroom hours as they did this year. Meanwhile April, presumably because Easter usually but not always falls in April, is a below average month with a scaling up factor of 0.87.

This year, with Easter in March, will be a more difficult year to interpret sales trends for the motor dealers and perhaps also for retailers generally. To get at the underlying trend in sales and sales volumes we would have to scale up for the motor dealers and scale down for the orinary retailers by more than usual, but just how much would be a matter of some guess work. We will have to wait for sales in April to be confident in our measures.

Estimates of retail sales provided by Stats SA are only up to date to February. As we show below, the estimate of sales volumes in February were encouraging, suggesting that , on a seasonally adjusted basis, it was a better month for retailers than January 2013. On a seasonally adjusted basis retail volumes declined by 1.75% in January compared to December 2012 and grew by 2.7% in February compared to January. February volumes, compared to February 2012, were up 7.4%.

However despite this pick up in February sales volumes, extrapolating recent trends, appropriately seasonally adjusted and smoothed, suggests that the growth in retail volumes will continue to slow down marginally over the next 12 months. However this forecast growth in retail sales volumes can still be regarded as satisfactory. Real growth is predicted to be 4% in February 2014. With retail inflation currently running at a 4.6% year on year rate and predicted to rise to 5.2% in February 2014, this suggests that retail sales in current prices may be running at a close to 10% rate this time next year.

What the hard numbers say

We do however have actual vehicle sales volumes for March from the National Association of Automobile Manufacturers (Naamsa). These must be interpreted with caution. We also know from the Reserve Bank the value of its notes in circulation at March month end. We use these hard numbers to compile our up to date Hard Number Index (HNI) of economic activity which is an equally weighted combination of the real note issue and new unit vehicle sales. As we show below, this Index compares very well in its turning points with the delayed Business Cycle Indicator provided by the Reserve Bank. The Index, updated to March, indicates that the economy continued to grow faster in March but that the rate of forward momentum was more or less constant and maybe slowing down.

Values above 100 indicate economic growth. The Index was helped by strong growth in the note issue. This growth too was influenced by the early Easter and the spending intentions associated with it. The demand for cash is itself a coinciding rather than a leading indicator of economic activity. Households hold more cash when they intend to spend more on goods and services. However the advantage of measuring the note issue is that it provides a much more up to date indicator of spending intentions than spending itself. Spending, for example at retail level, is an estimate made from a sample survey, not a hard number, and moreover is only available with a lag. It will only be well into May before we can update our estimate of retail spending.

The close statistical relationship between growth in the note issue and growth in retail sales at current prices is shown below. Both series are on a slower growth trend and are predicted to remain so.

Should such negative trends in domestic spending materialise, more aggressive monetary policy would surely be justified. High rates of inflation that threaten the inflation targets have inhibited such monetary policy responses to date and may continue to do so. However, high rates of inflation cannot be ascribed to excessive domestic demand for goods and services. The trends moreover suggest that the growth in demand will be slowing down, rather than speeding up. The recent inflation in SA have had little to do with excess demand and much more to do with weakness in the rate of exchange and so the costs of imports that reflect also global commodity price trends. These trends, for example in the US dollar price of petroleum, suggest less rather than more inflation to come from this source (independent of exchange rates).

The problem for an inflation concerned Reserve Bank is that there is little predictable connection between interest rates and the exchange value of the rand and therefore very little direct influence the Bank can exert on inflation rates. Higher interest rates, if they implied slower economic growth, might well discourage capital inflows and encourage capital outflows, so weakening the rand and thus add to inflation, even as higher interest rates and a weaker rand discourage domestic spending.

Lower interest rates, where they boost economic growth, might in turn attract portfolio flows to the JSE and lead to a stronger not weaker rand. Faster growth with less inflation then becomes a highly desirable possibility.

Inflation targeting, without being able to predict the direction of the rate of exchange when policy action is undertaken, makes little sense. It may come to pass that the Reserve Bank accepts that the most it can hope to do with its monetary policy is to stabilise domestic spending, without regard to the outcomes for inflation. Recent policy actions by the Reserve Bank strongly indicate that in practice the Bank is following a dual mandate – targeting growth as well as inflation.

If only the rand would behave itself in the months ahead (implying no upward pressure on inflation rates) this dual mandate could lead it to lower interest rates. Recent movements in short and long term interest rates indicate that the money and bond markets are according a higher probability to a reduction in the repo rate over the next 12 months. Brian Kantor

Anglo’s parting chief: How not to say goodbye

Published by Business Day, Friday April 19th 2013. Opinion and Analysis Section, p11

Taking leave of her long suffering shareholders, Cynthia Carroll chose to admonish rather than commiserate with them.  As the Financial Times reported:

In a parting shot at shareholder demands for greater cash returns, Cynthia Carroll told the FT that there was a “disconnect” between mining companies and investors, adding that the latter need to understand better “what it really takes to deliver projects”.

“Some [shareholders are] under severe pressure and want a return tomorrow.  They’re going to be hard-pressed to get them because it’s not going to happen that way.  We have to be ruthless in terms of what [costs] we’ve got to cut but we have to be mindful we’re in a long-term industry.”[1]

 The truth about the recent behaviour of investors in Anglo is that far from any alleged short term disconnect between price and performance, as alleged, Anglo shareholders  are demonstrating remarkable patience in the face of a simply disastrous performance of the company in recent years that has seen Anglo’s earnings collapse. Blaming the global slowdown and super cycle bust ring hollow when judged by Anglo’s poor performance relative to that of its large diversified mining house peers. BHP Billiton, Rio Tinto and Anglo American are all listed on the FTSE in London. Since 2007 when Ms Carroll became CEO, BHP Billiton has beaten the FTSE by a factor of 1.95; Rio Tinto has beaten it by 1.31 and Anglo has returned only 0.61 relative to every £1 invested in the FTSE. This is a sad case of sterling underperformance.

The price to earnings multiple for Anglo has shot up lately in response to a collapse in reported earnings after taxes and write offs. Thus indicating very clearly that shareholders are hopeful that earnings will recover in due course. Let us hope that their confidence in the newly appointed Anglo management to affect a recovery in the mining house operations will be justified. Far from being short cited in the face of very poor recent results investors are proving remarkably loyal to Anglo.

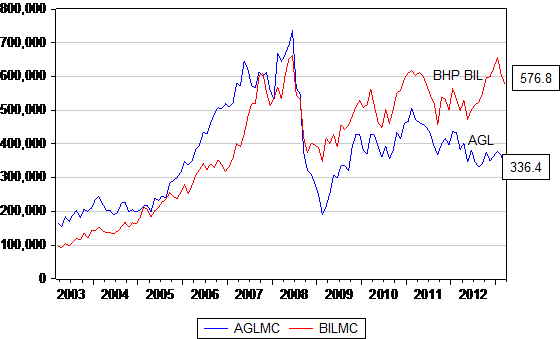
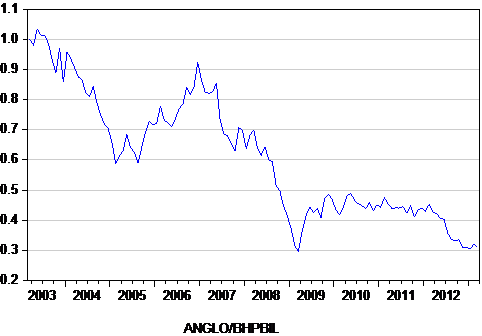
The sad news about Anglo’s (AGL) performance under Ms Carroll’s watch is easily captured in a few more diagrams.  We show that while AGL was once worth more than BHP Billiton (BIL), its market value is now considerably lower. From a peak market value of over R700b in 2007 before the Global Financial Crisis struck, the company was worth less than half R336.4b by March 2013. As we show BIL held up much better over the period and is now worth significantly more than AGL (approximately R230b more at the March 2013 month end). Compared to early 2003 before the commodity super cycle shareholders would have done about three times better holding BIL than AGL shares.

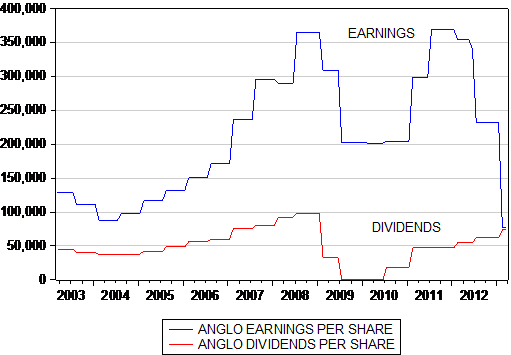
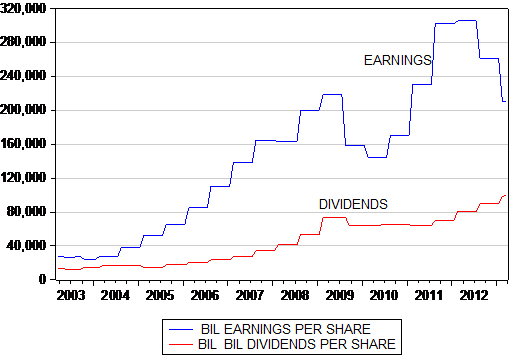
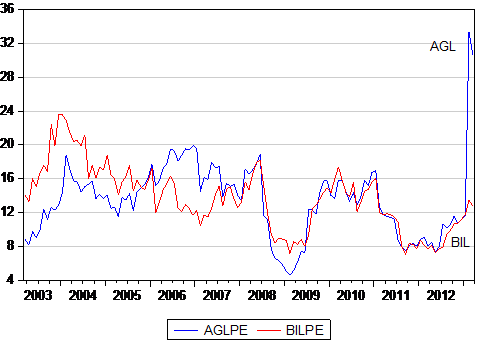
Such relative performance is well explained by earnings and dividends per share. Anglo’s after tax earnings per share having collapsed in the past financial year to December 2012 is now below its level of early 2003. BIL earnings per share, while also under strong downward pressure, grew much faster over the ten year period and are well above 2003 levels as we show.  The upshot of all this history is that AGL was selling at the March 2013  month end for a highly generous and forgiving multiple of over 30 times its reported earnings while BHP Billiton commands a much more sober multiple of 12.8 times. The average price to reported earnings multiples for both companies over the past ten years has been about 13.5 times. Based on this measure, Anglo is priced for a recovery and normalisation of its earnings.

Anglo American and BHP Billiton Market Value (R’ 000m)


Ratio Market value of Anglo/ BHP Billiton 2003=1


Anglo American Earnings and Dividends per share  (2003- 2013; South African cents )


BHP BILLITON Earnings and Dividends per share (2003- 3013 sa cents)


Anglo American and BHP Billiton Price/Earnings Multiple


While price earnings multiples give an impression of the long term expectations that inform market values, we can take a closer look at the South African mining industry to judge more accurately what the market expects of the mining houses in terms of operating profitability and value creation.

Contrary to Ms Carroll’s statements and those of many other pundits unsympathetic to market forces  investors have long-term expectations about growth, return on capital and risk when they value the anticipated future cash flow from companies.  They take a long term view because it is the value adding viewpoint to adopt. Smart investors and corporate executives back into and analyse market expectations to understand current valuations before they buy or sell shares. If expectations appear too optimistic then the investment shouldn’t be made.  Two much pessimism about the long term provides a buying opportunity.

Using CFROI[2], which is a measure of the real cash flow return on operating assets,  we investigate the return on capital implications implicit in the current values attached to the mining companies listed on the JSE.

The average real return on capital (CFROI) for global industrial and service companies is 6%.  Firms that can generate operating returns that beat this level can generally be said to be creating shareholder value.  Firms that generate real operating returns less than 6% are destroying shareholder value.  South Africa (defined as firms listed on the JSE) has one of the highest median CFROI values in the world at 10%.  This is something to be very proud of.  In general, South African companies are very well managed and create shareholder value. If they can continue to generate returns that beat their cost of capital, they should re-invest their earnings and grow.  It is not a lack of cash that stops companies from investing more in SA mining operations , but rather uncertainty about the risk and economics of future earnings from those investments.  The government should do all it can to welcome investment and decrease uncertainty if it truly wishes to unleash growth.

Unfortunately, the South African mining sector has not generated a particularly attractive return on capital.  The median CFROI for the aggregate South African mining industry is 6.2% over the past 20 years. It has exceeded 9% in only two years, 2001 and 2006.  Many miners did very well during the commodities super cycle from 2006 to 2008 but have generated value destructive operating returns since. Platinum mining has provided a  particularly disappointing return on capital since the super cycle collapsed as has much of the acquisition activity undertaken by the diversified miners.

 SA Miners All Regions All Sectors – Weighted

And so what are the current expectations implied by current market values?  The aggregate CFROI for the South African mining industry implicit in current valuations is expected to remain well below 6%, which is below the real cost of capital or the returns normally demanded of risky mining operations.  Spiralling costs and low commodity prices are squeezing profitability, and this squeeze (undemanding expected returns) is baked into today’s lower share prices.  If we compare forward expectations over the next five years for BIL, Rio Tinto and AGL, BIL is priced for its CFROI to go from 10% to 7%; Rio Tinto from 7% to 5%; and AGL from 5% to a value destructive 2%. Such low expectations indicate that AGL is either cheap or the market has decided it is a value trap. The onus is on management to prove the market wrong by improving operational control, not to blame the market for losing faith in the industry.

The share market doesn’t expect growth from the mining houses. It is rather demanding that the mining houses pay much closer attention to cost control and operational excellence. These low market expectations should act as a warning to managers, workers and the government responsible for mining policy. The lower profits and reduced growth expected is not in synch with demands for higher wages, electricity prices and government interference with mining rights and the taxation of mining profits.  If these low expectations can be countered by sober management and relations, then these companies and their returns stand a stronger chance of recovering their status with investors. In the long run it will be the real return on the cash invested by the mining companies that will be decisive in determining their value to shareholders. In the long run economic fundamentals will trump what may be volatile expectations. The mining companies can manage for the long run with complete confidence in the willingness of the share market to give them time but must bear in mind that actions speak louder than words.

 Brian Kantor and David Holland


[2] Follow this link for more information about CFROI: https://www.credit-suisse.com/investment_banking/holt/en/education/popup_tutorial1.jsp 

Equity markets: The stock market always has a message for us – reading the market signs

Published in Investec Wealth and Investment Private View Quarter 2 2013

There is perhaps only one observation one might make with great confidence about the value of a firm: that over the long run its market value will be aligned to its economic performance. The better the realised performance, the more valuable the firm or a share in it will be.

In the long run economic fundamentals account for share values

There is perhaps only one observation one might make with great confidence about the value of a firm: that over the long run its market value will be aligned to its economic performance. The better the realised performance, the more valuable the firm or a share in it will be.

The problem for the analyst or investor is that the market is always attempting to value the expected rather than the realised performance of a company. These expectations can change from day to day, while it is only over the very long run that performance and its valuation will converge in an understandable way. The market does however provide consistent clues about the expectations implicit in market valuations. These clues then allow the investor to make judgments about the realism of these expectations of performance. They may be judged too optimistic (therefore providing reasons to lighten exposure to the market) or too pessimistic (making a case for increasing exposure to equities, that is for taking on more risk).

A firm’s economic performance might be calculated using a variety of metrics: accounting earnings per share (after interest and taxes paid) would be the most obvious measure of performance; dividends per share or operating profits might serve better as a measure of business success or the lack of it; so might cash flow – so called EBITDA (earnings before interest, taxes, depreciation and amortisation) – be preferred as a measure of the economic performance of a company; free cash flow (that is cash flow after investment activity) might indicate how well the company is doing.

These performance measures might best be normalised to exclude extraordinary temporary additions to or subtractions from bottom line accounting earnings. This would give rise to the so called headline earnings reported by JSE listed companies or even normalised headline earnings reported by some companies. The deepest insights into how well a company is performing are most likely to be found in measuring the cash flow return on capital (the return on the cash invested by the firm, suitably adjusted for inflation).

When we aggregate the performance of all the firms that make up a stock market, we find that all of these different measures of performance prove to be highly correlated. They will all tell a very similar story about how well the firms that make up the stock market have done over time.

Expected rather than past performance accounts for the short run behaviour of the market place

The problem for the investor is that while realised performance will be decisive in determining the value of a company over the long run, the market place does not sit by patiently waiting for economic performance to unfold. The day to day value of a company or the share market is determined by expected rather than past performance. And as investment advisors are constantly obliged to remind their clients, past performance is not necessarily a guide to future performance – even though it may be the only useful guide available.

Future economic performance implicit in current market values can as easily be overestimated as underestimated. If such estimates are proven (by subsequent events) to have been too optimistic, market values will tend to fall into line with disappointing economic outcomes. If the estimates of performance are too pessimistic then share prices will tend to rise and thus fall into line with the unexpectedly good economic outcomes.

Prices fall in line with performance – or performance catches up with prices

In any longer run view of the relationship between values and performance, either prices will fall into line with disappointing performance or unexpectedly good performance will drive prices higher. In the long run prices and performance will track each other.

The environment also matters – as reflected in the discount rate applied to future performance

There is a related issue when the value of a firm or a market has to be determined. This is the rate of discount which should be applied to expected performance, measured as a flow of earnings, dividends or free cash flow over time. Clearly future expected benefits from the ownership of an asset or firm are less valuable than current benefits gained from owning any asset or a share. Any market value can be logically regarded as being the result of a present value calculation. A similar calculation will be made by any firm contemplating capital expenditure. Future expected benefits have to be discounted to derive their present value.

This discount rate wlll be very much influenced by interest rates prevailing in the market place. Investing in a share is an alternative to investing in cash or short or long dated government bonds paying a fixed rate of interest with a certain money value. When investing in the shares or the debt of companies, a risk premium will be added to these interest rates to compensate for risk of default or failure.

But it is not only the risk to the firm that will be taken into account when values are estimated. It is the risks posed by government to the economic outcomes for firms and share owners that will be reflected in interest rates offered by government borrowers. For example the risks of higher or lower inflation will be revealed in these minimal interest rates, as will risks that government will tax interest income more heavily or will come to rely more heavily on debt than tax revenues to fund additional expenditure.

Furthermore interest rates will also rise or fall in response to a real shortage of savings. If the demand for savings or capital strengthens, from firms and the government itself, then real, after (expected) inflation interest rates will rise and vice versa. The greater the competition for capital, the higher will be real interest rates, and so the less valuable will be the present value of an asset as benefits are discounted at a higher rate.

Good news and bad news reasons for higher discount rates

This lower present value would occur with higher interest rates (all other things remaining equal). In this case the expected performance of the companies would have to be expected to remain unchanged in the face of higher interest rates. Often however the competition for capital will be most intense when companies are doing well and expect to do well.

These conditions would provide good news reasons for higher interest rates and could lead to higher values, despite higher costs of capital. The bad news reason for higher interest rates is when governments are thought more likely to misbehave by adopting less encouraging economic policies for the firms that make up the economy. Bad news about government policy or about the performance of a firm inevitably translates into higher interest rates and hence less valuable companies. Good news about improving government policies and or better managed firms usually means the opposite.

We may not be able to predict share prices in the short run, but we can know when the market place is optimistic or pessimistic about the economic future.

However accurately predicting the day to day moves in share prices is very difficult because expectations can change significantly as information, the news and its interpretation, percolate through the market place moving market values in a largely random way. Yet it is possible to observe when the market is more or less optimistic about the future. The best that the informed investor can hope to do is to use market values to infer how optimistic or pessimistic the market currently is about the prospects and to agree with or take issue with the prevailing sentiment. We undertake such an exercise for the value of the key share market index, the S&P 500 (representing the largest 500 companies shares listed on the New York and Nasdaq stock exchanges).

In the figure below we show the results of a simple regression equation which explains the value of the S&P 500 with reported dividends and long term US Treasury Bond Yields. This is equivalent to a present value calculation, with long term US government interest rates used as the discount rate.

As may be seen from the figure below, the explanatory power of this model is very good with actual and predicted values closely aligned in general. The goodness of fit of the model, measured by its R squared, is of the order of 95%. Thus the model may be regarded as providing a very good long term explanation of the value of the S&P 500. The S&P 500 over the long run is well explained by reported dividends and long term interest rates.

It should also be noticed that the fit was generally even closer before 2000 than since then, given the influence of the dotcom/tech bubble in the early 2000s and the Global Financial Crisis late in the decade.

The most striking conclusion to be drawn from this exercise is that the S&P 500 at the March 2013 month end, despite its recent strong gains, is still deeply undervalued by its own standards: in percentage terms about 40% below its predicted value. If the past were the guide to current performance, then the S&P 500 (given current dividends and interest rates) would have a predicted value of 2440 rather than the current (still record) level of 1560. In other words, it may be concluded that the market currently remains about as pessimistic about earnings and dividend prospects as it was at the height of the financial crisis in 2009. The same model estimated in May 2009 indicates that the market was then undervalued by 47%. As the chart shows, the S&P 500 recovered very strongly from these depressed 2009 levels over the next 24 months as prices caught up with the improved fundamentals of rising dividends and low interest rates. The same model, when estimated at the height of the stock market boom in May 2000, indicated that the market was then as much as 55% overvalued. Those times were times of extreme optimism about the prospects for listed US companies, an optimism that was not at all borne out by subsequent performance of earnings or dividends per share.

The S&P 500 Index: Actual and predicted values

Source: I-Net Bridge, Investec Wealth & Investment

We use easily calculated dividends per share rather than earnings per share as the measure of shareholder benefits. This is because S&P 500 earnings per share collapsed so precipitously during the Global Financial Crisis of 2009 as financial corporations had to write off their many bad loans. Dividends and operating profits held up much better over this period, as we show below, and therefore provide a much better reflection of the economic performance of the companies valued between 2008 and 2013. Both series have recovered very strongly and are close to or above their pre crisis levels.

S&P 500 Earnings and dividends per share in US cents (log scale)

Source: I-Net Bridge, Investec Wealth & Investment

It may therefore be concluded that if the past is anything to go by, the S&P 500 continues to offer value. By the standards of the past the market is very undervalued for current dividends and interest rates. Pessimism, rather than optimism about economic prospects for the S&P 500, appears to dominate sentiment. The potential investor in the market can make his or her own judgments about whether such essential pessimism is still justified.

It should be appreciated that, by these measures, the market can remain undervalued for an extended period of time. It is also possible that earnings and dividends may collapse to justify such pessimism. Interest rates in the US may also rise for bad news reasons, such as less faith in the US government. They may also rise for good news reasons because US firms become more willing to undertake capital expenditure and compete, pushing up interest rates accordingly. If so, the US economy and the global economy, as well as earnings and dividends that flow from the economy, are unlikely to disappoint. Stock market valuations would then play further catch up through realised performance.

It may be of some comfort to those with a bias in favour of buying and holding shares for the long term to know that by its own standards, that is relative to past performance and current interest rates, the US equity market remains deeply undervalued despite the recent gains made.

 Brian Kantor

From Tokyo to Johannesburg – a move in interest rates and the rand

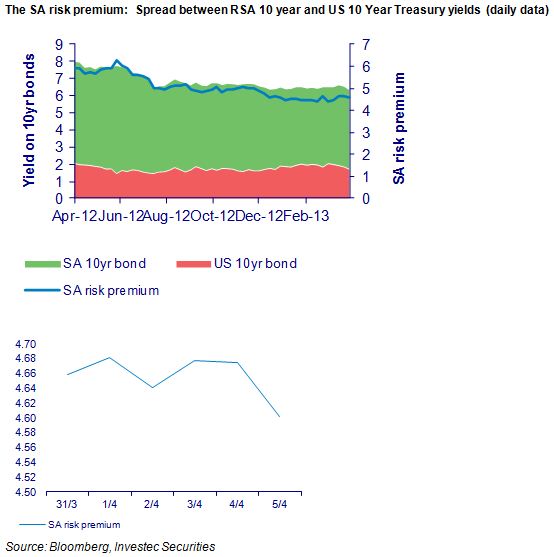
There were some interesting developments on the SA interest rate front late last week. Long term rates in SA declined by more than they did in the US. Thus the spread between the rand yields on long dated RSAs over US Treasury Bonds narrowed.

This spread is equivalent to the rate at which the rand is expected to depreciate against the US dollar over the next 10 years or so. It is notable that as the rand weakened over the past 12 months the spread actually narrowed, indicating less (rather than more) rand weakness to come in the years ahead. This spread, which we describe as the SA risk premium, was over 6% this time last year; last week it had fallen to 4.58% (see below).

The gap between long dated vanilla RSA bonds and their inflation linked equivalents remains stubbornly around the 6% plus range, though this compensation for bearing inflation risk (implicit in long dated fixed interest) also narrowed marginally.


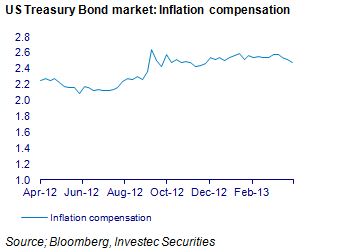
Inflation expected in the US, calculated similarly as the difference in yields on vanilla bonds and inflation linkers of similar duration, is of the order of 2.5%. This spread has widened marginally over the past 12 months (see below).


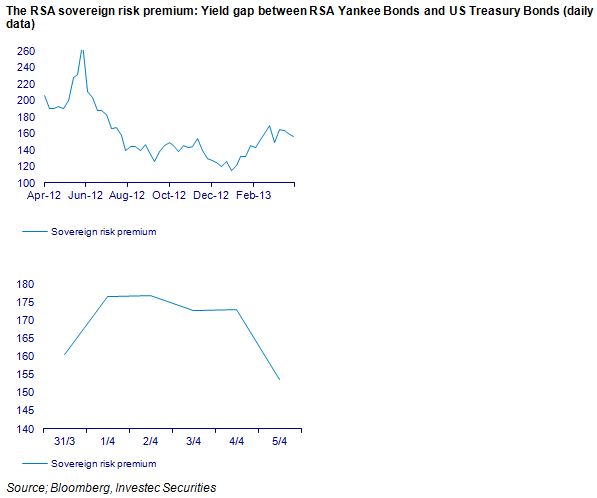
The spread between RSA US dollar-denominated (Yankee) bonds and US Treasuries also narrowed last week to about 150bps. The spread was below 120bps in December 2012.


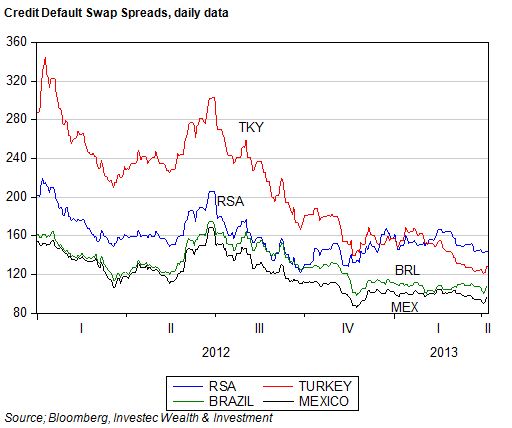
RSA US dollar bonds have not performed as well as most of their emerging market peers over the past 12 months. Turkey now enjoys a superior credit rating to SA. Mexican and Brazilian bonds have been in particular favour with global investors as we show below.

A fair wind from Japan


The force dominating developments on the global interest rate front last week was the carry trade in the yen. Despite the markedly weaker yen – in response to aggressive money creation in Japan – interest rates in Japan remain below yields everywhere else. Thus borrowing yen to buy higher yielding securities everywhere else, including in SA, must have seemed like a good idea late last week. It has certainly proved to have been a good trade this week and may well be judged to offer further advantages in the weeks ahead. The rand and bond yields in SA will benefit from any such further yen carry trade – as should the interest rate plays on the JSE. Brian Kantor