Retailers: Making sense of retail sales volumes and the value of JSE Retail counters

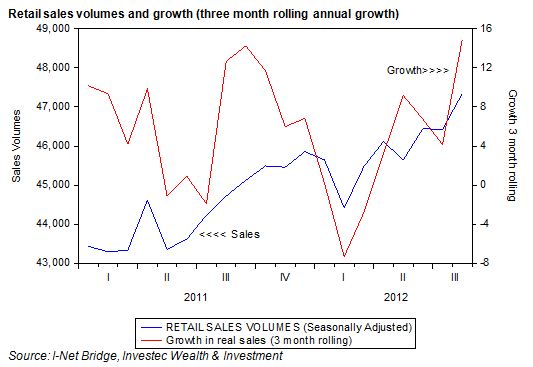
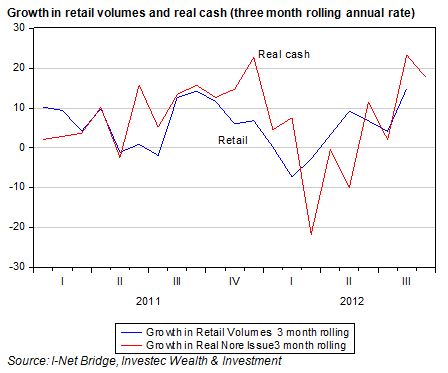
Retail sales volumes in August 2012 were up nearly 2% in August when measured on a seasonally adjusted basis, or 6.5% ahead of their December 2011 volumes. (See below)


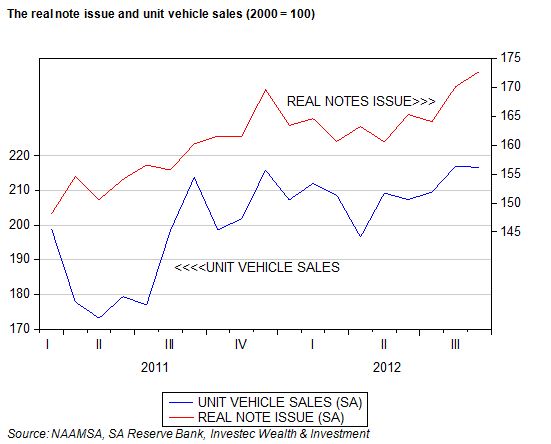
Apparently the buoyancy of sales took economists somewhat by surprise. However observers of the note issue and unit vehicle sales (updated to September 2012 month end) that make up our Hard Number Indicator of the state of the SA economy, should have been less surprised. The retail volumes follow the pattern established by both vehicle sales and the real note issue. That is, growth in volumes, seasonally adjusted, when calculated on a three month rolling basis, picked up strongly towards year end 2011, then fell back sharply in early 2012, whereafter growth accelerated again. (See below)

As we have suggested, and has been confirmed by the strength in retail sales volumes, the SA economy has had more life in it than has generally been appreciated.

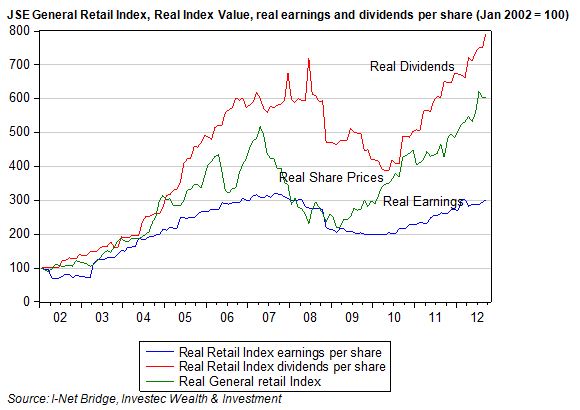
The stock market was perhaps less surprised by the strength in retail sales, given the recent strength of the General Retail and Food and Drug Indexes on the JSE. The value of the JSE General Retail Index, in real CPI adjusted terms, has increased by 35% between January 2011 and 17 October 2012 with much of this strength coming in 2012. Real sales volumes grew by 10% between January 2011 and August 2012.

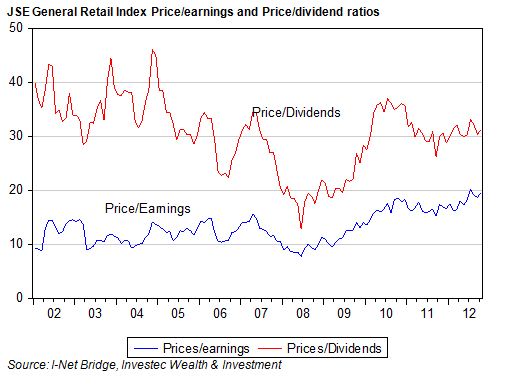
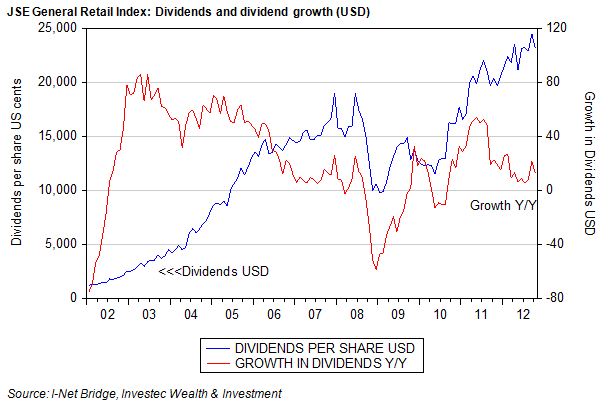
The valuations of retail companies have clearly improved significantly faster than those of real sales. They have also outpaced real retail earnings per share, leading to elevated ratios of share prices to earnings of the retail counters, as has been well documented. However what has not been as well recognised is the extraordinary growth in real dividends distributed by the retail companies. Dividends per retail index share have grown much more rapidly than earnings per share. Dividends in fact have not only grown faster than earnings – 2.64 times as rapidly since 2002 – they have also outpaced the increase in the retail Index as we show below.

Thus, while the price to earnings multiple attached to the general retailers in SA has increased significantly since 2002 (from 9.32 in early 2002 to the current 19.6 times) the price to dividend ratio has in fact fallen since 2002, from R40 paid for a rand of dividends in January 2002 to a mere 31.3 times today.


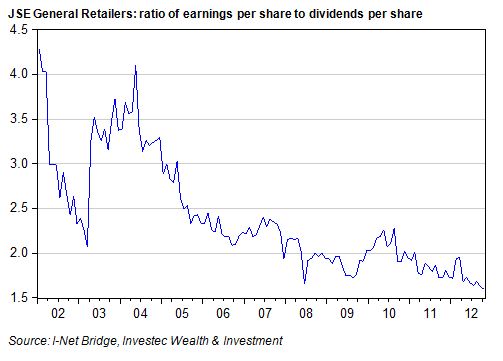
Retail companies listed on the JSE have benefitted from strong growth in sales and stronger growth in bottom line earnings as operating margins have improved. But they have also been able to generate strong growth in free cash flow – that is cash generated after increases in investments in working and fixed capital. The strength of their balance sheets, or perhaps an inability to find sufficient opportunities to deploy cash inside their businesses, has encouraged the retailers to pay out cash to their shareholders in the form of share buybacks and a reduction in earnings cover. The ratio of earnings to dividends per share has declined dramatically over the years, a decline that appears to be accelerating.


These dividends per retail share (in US dollars) have grown at an average compound rate of about 27.1% p.a since 2003 and have clearly had great appeal for foreign investors who have come to hold an increasing proportion of the shares in issue while SA fund managers have (regrettably) reduced their stakes. The Index in US dollars (excluding dividends) has increased at an average compound rate of 24.9% p.a over the same period.


Dividend yield and growth in dividends that SA retailers have been able to generate have had particular appeal in a world of very low interest rates. The exceptional returns provided by SA retailers in recent years are therefore not at all surprising in the circumstances. Their valuations – seen as a dividend rather than an earnings plays – make every sense. Brian Kantor

Outrageous pricing is bad for economy’s competitiveness

SOUTH African Airways (SAA) is a wholly owned subsidiary of the Republic of South Africa, as is Airports Company South Africa (Acsa).

SAA has run out of cash and has been given authority to raise R6bn in debt guaranteed by taxpayers to keep flying.

Acsa, by contrast, is awash with cash. For the financial year to the end of March, it generated R2.9bn in cash flows on customer revenues of R5.8bn — compared with R1.7bn on revenues of R4.6bn the year before. Last year, SAA generated just R278m of cash flow on income of R22.8bn.

This very different state of affairs is not coincidental. Acsa’s gains have been the losses or sacrifice of revenues that SAA and other airlines have had to make in favour of Acsa’s tariffs. SAA is almost certainly Acsa’s largest customer — the collector of the bulk of the fees paid by airlines and their passengers for the use of Acsa’s airports. These fees have risen significantly in recent years and account for a large proportion of what we pay to fly. The revenues the airlines can collect from their passengers is constrained by competition between them. There is no such constraint on the charges Acsa can levy given its near monopoly over all the airports in South Africa.

Acsa has not been shy to exploit its pricing power and neither the regulator nor the Competition Commission has acted as much of a constraint on the exercise of this monopoly power. An increasing proportion of the gross price per passenger flight that the market for air travel will bear, is being collected by Acsa at the expense of the airlines.

This is an issue recognised in economics as the pipeline problem. If you own an oil well or a coal or iron-ore mine and somebody else owns the only pipeline to the port, you are at their mercy. The owner of the transport monopoly can extract all the surplus you might otherwise earn from your mining operations — which is why the mine owners would do well to either own the lines to the market or sign very long-term leases for their use on terms that make economic sense.

Failing that, they may have to rely on the mercy of the regulators, who may control tariffs. The regulators, however, may be inclined to exaggerate the returns required by the owners of very low-risk rail, pipelines and ports, and so allow them to charge more heavily than would be the case were the ports and the lines to compete actively with each other for business. There is every reason to suspect the regulators in South Africa of this bias.

The government has invested on the ground and in the air. The airline business is notorious for the poor returns provided for shareholders while passenger numbers have soared over the years. The major airlines would have done much better to have invested in airports as well as fleets of airliners — as indeed the government, which owns SAA and Acsa, has done. It therefore makes economic sense for the government to keep SAA going — if only to collect the fees Acsa is able to charge. It would also make sense for SAA to be competently managed so that it, as well as Acsa, could contribute dividends and taxes to government revenues and help relieve the burden on ordinary taxpayers.

Another wholly owned subsidiary of the government (and also awash with cash) is Eskom. With much higher prices for the electricity it generates and delivers, cash is pouring into the utility. Some ball-park numbers taken from Eskom’s financial statements will help to make the point. In 2009, Eskom’s cash flow from operations was R5.16bn on revenues from electricity sales of R53.09bn. In the year to March, cash flow from operations was R38.7bn on sales of R114.7bn. Since 2009, cash flows from operations have increased 7.5 times on sales revenues that have grown 2.16 times. This shows how freely the cash flows from all the established capacity when prices are allowed to increase as they have done.

Eskom continues to invest in new capacity. In 2009, it spent R44.7bn on new plants and securing fuel supplies. This year it has spent nearly R59bn for the same purpose. But given the abundant supplies of cash delivered from operations (R38.7bn this year), Eskom needed to raise only R16.5bn of additional debt in the past financial year compared with R30.5bn of debt raised in 2009. Eskom’s debt-to-equity ratio is falling significantly. No doubt this is to the satisfaction of Eskom’s management and the Treasury. But whether such extreme trends are good for the economy is moot.

What is the required return on capital invested in monopoly airports or electricity generators? The justification for higher prices is that they are needed to provide an economic return on the additional capital Eskom is investing in more plant and equipment. The principle of charging enough to cover the full costs of additional capital investment in additional capacity desperately needed by a growing economy is entirely valid. Prices have to be only high enough to cover operating costs as well as to provide an appropriate return on the additional capital invested.

A critical consideration is what return on capital is appropriate for this. The National Energy Regulator of South Africa regards a real return of 8% a year as appropriate for Eskom. Such a return is far too high given the nature of a monopoly utility business that is essentially a very low-risk activity. To aim at a return of about half of this would be about right for the owners of airports or power plants with monopoly rights. A real return of 4% is equivalent to a nominal return of about 10% or about 2% a year above the return on an South Africa long-dated bond. A risk premium of 2%, or about half the average equity risk premium, is consistent with a very low-risk enterprise. The global average real return for utilities of all kinds is about 4% a year.

My own spreadsheet on Eskom indicates that if it gets its preferred way for 90c/kWh, compared with the current 60c, the internal rate of return it would realise on its investment in new power stations, Medupi and Kusile, would be an extraordinary and outrageous 20% a year or more. The potential providers of alternative energy or of contributions to the grid will be cheering Eskom all the way to the bank.

Providing for a real return of 8% or more represents very expensive electricity or airports, even assuming best practice in the management of projects and supplies that may not be justified given such a comfortable financial environment. Inappropriately higher charges by state-owned enterprises, designed to realise much higher real returns on capital, while convenient for the boards and managers of Acsa and Eskom, are very bad news for the economy and its competitiveness. The much better alternative would be an agreed and much lower charge for capital — leading to lower prices for essential services and an insistence on best-practice cost management. It would mean less abundant cash flows for the utilities supplying the service and more debt on their balance sheets (guaranteed by the taxpayer), and so a more competitive economy.

It would also represent a pricing policy that is much fairer to current generations. Under the present practice of forcing savings from consumers through excessive charges for utilities, charges that should better be described as taxes, future generations will inherit the capital stock without the debt that they might appropriately be expected to be still be paying off over time.

Perhaps it might also lead to a fairer labour market in which strike action by relatively well-paid workers is apparently being encouraged by inroads being made on their real wages by ever-higher utility charges.

The SA economy: Hard numbers confirm the reliance on spending

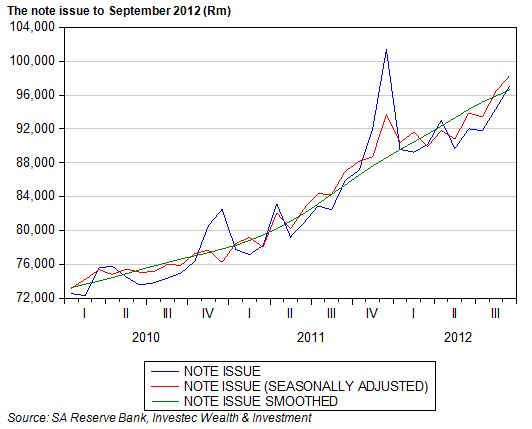
We regard the note issue as a very reliable indicator of spending intentions in SA. It has a particular advantage in that it is updated every month with the release of the Reserve Bank balance sheet, usually within the first week of the next month. The Reserve Bank has now published its balance sheet for September and as we show below, the note issue, on a seasonally adjusted basis, grew strongly towards year end 2011, then moved largely sideways until May 2012 and since then has grown quite strongly. The note issue, seasonally adjusted in September 2012, maintained this strong upward momentum in September and is now well ahead of its level in December 2011.


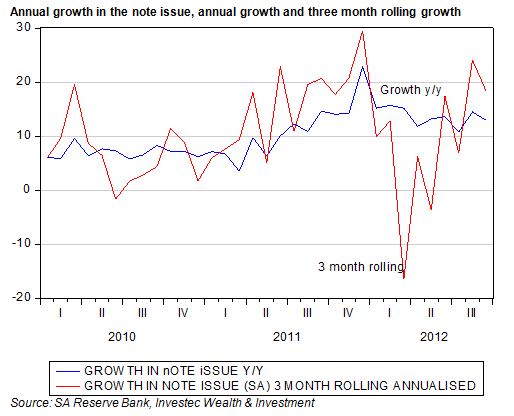
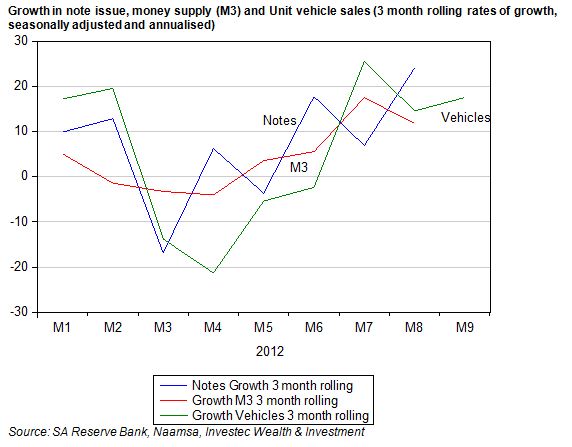
The strong recovery in the note issue is well demonstrated by the growth measured on a three month rolling basis. This three month growth in the seasonally adjusted note issue, when annualised, turned negative in May 2012, picked up to 17% in June, grew by 24% in August and 18% in September 2012.


When adjusted for consumer prices, the recovery in the real note issue is equally impressive, with the three month growth rate recording about 20% in 2012. These trends in the real cash supply are matched very closely by trends in unit vehicle sales. They too were up strongly in late 2012, moved sideways until May and then also recovered strongly (see below).


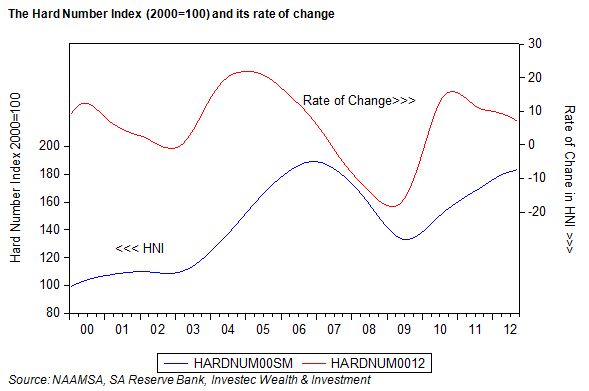
These two series (both up to date hard numbers), rather than based on sample surveys make up our own economic activity indicator that we call our Hard Number Index (HNI). As we show below, supported by the uptick in vehicle volumes and the real note issue, the HNI has continued to move ahead – indicating continued growth in SA economic activity at a more or less stable rate. Numbers above 100 for the HNI indicate the economy is growing and its rate of change, also shown, indicates whether the economy is picking up or losing forward momentum. It would appear that the speed of the economy has slowed down from its peak but has in September almost maintained the speed reached in August 2012. Given the fears of a marked slowdown in activity this outcome should be regarded as highly satisfactory.


It would appear that the SA economy, on the demand side, has shown more strength than is perhaps widely appreciated. Spending appears to have picked up, rather than slowed down, between May and September 2012. These trends have also been confirmed by retail sales and broader money supply trends that we have reported upon. Given the disruptions on the supply side of the economy, this strength in demand is likely to also show up in a wider trade deficit. This might enhance the case for rand weakness – but the underlying strength of demand should also encourage investment and inward capital flows. Brian Kantor

US monetary policy: What Ben may have seen

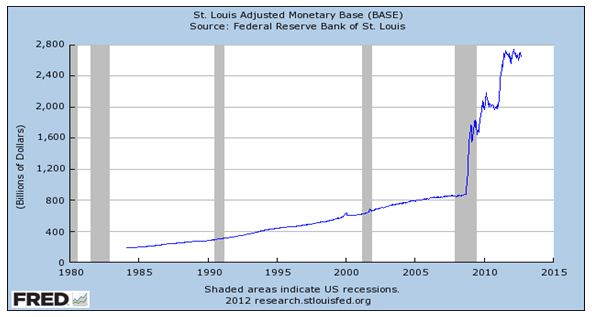
The scale of QE3, that is of further money creation in the US, the promise of an extra injection of US$85b into the US monetary system each month for as long as it takes until the unemployment rate normalises, is impressive indeed. It comes after QE1 and QE2 that has seen the US money base increase enormously from about US$800bn before the financial crisis to nearly US$2.6 trillion today.

The money base, adjusted for reserve requirements, is dollars in the form of greenbacks issued by the Federal Reserve System held by the public and the banks, not only in the US, but all over the world and in the form of deposits held by US banks, which are members of the Federal Reserve System, at their Federal Reserve Banks. Almost all of the extra deposits held by these banks are in excess of the requirement to hold a certain ratio of cash as required reserves. US banks that held no excess cash reserves before the crisis are now hoarding well over $1 trillion of excess reserves.

Fed chairman Ben Bernanke would much rather have these banks reduce their excess cash by making more loans or buying more assets in the market place. This would be good for the US economy, which suffers from too little demand to engage all its available resources, especially potential workers, many of whom have withdrawn from the labour market and no longer seek jobs. Pumping money into the system is meant to encourage more lending and spending. As may be seen in the figure below, the money base, despite all the prompting it has had, stopped growing in mid year. Hence the case for still more cash – cash that costs the Fed almost nothing to create and might yet do much good.


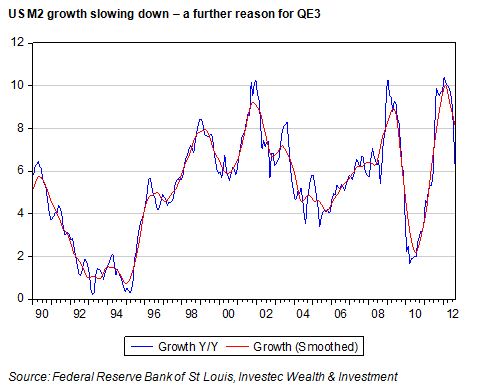
The injections of cash into the banking system have not been without impact on the broader definition of money, M2, which incorporates almost all of the liabilities of the banking system (mostly deposits with retail banks), and which has been growing strongly. This has been helpful for spending growth. However M2 growth also appears to have peaked and is tapering off. This too would concern Bernanke.

Creating cash is intended to increase the supply of money and bank credit (which it has done) but a faster rate of growth would be better under current circumstances. A further reason for QE3 would be to encourage M2 and bank credit growth to accelerate rather than decelerate (see below).

Bernanke will be doing all he can and he has considerable power to issue cash without limit: he can thus keep interest rates down all along the yield curve. This is until and maybe beyond the time that the Fed is confident the economic recovery is gathering strong momentum and unemployment normalises. What he will also be considering is to no longer offer the banks interest on their deposits with the Fed. This might encourage the banks to use rather than hoard their cash. The markets will to judge when rapid growth in central bank cash starts to succeed too well in preventing deflation and in stimulating economic activity and becomes inflationary (as history teaches it always does).

Economic data: Still motoring along

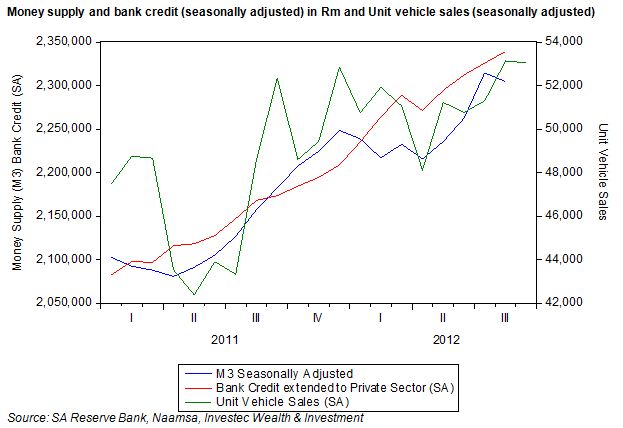
Recently released data on the broadly defined money supply (M3) to August 2012 and new unit vehicle sales updated to September 2012 are consistent with a pattern observed for other indicators of the state of the economy. These include retail sales volumes and the note issue (cash held by the banks and public). The message is that a strong pick-up in activity was recorded in the final quarter of 2011 and was followed by, at best, a sideways trend until May. In June 2012 activity picked up and the higher levels of activity have been sustained since then.

We show this pattern of monthly activity, seasonally adjusted, below. Vehicle sales volumes now exceed the strong sales realised in December 2011 when seasonally adjusted. This recovery in sales volumes should be regarded as highly satisfactory by the industry. The money supply trends, also seasonally adjusted, show a similar pattern, while bank credit extended to the private sector has advanced more steadily as may also be seen in the chart.

Year on year growth rates do not tell the story of what can happen within a 12 month period. That vehicle sales have slowed down (off a higher base) to 1.34% p.a. appears to be something of a disappointment to the Industry but should not be. The growth in vehicle sales on a three month rolling basis – when seasonally adjusted and annualised – tells a much happier story about the state of the vehicle market. It also tells a happier story about the state of the domestic economy more generally when the note issue and the broadly defined money supply, calculated on a three month rolling basis, are taken into account.

The SA economy clearly picked up momentum in mid year while activity appears to be well sustained at higher levels. This strength has perhaps not been widely recognised, given a focus on year on year growth rates. These will come under further pressure from the higher base realised in late 2011. The strength of demand has however shown up in higher imports and (given pressure on export revenues volumes) in a wider trade deficit.

Lower interest rates have been helpful for sustaining domestic demand. Interest rates will need to stay low, and perhaps decline further, to encourage demand in the absence of any likely stimulus for the economy from exports – particularly exports from the disrupted mining sector.

SA bond markets: That steepening curve

There were two important developments last week for the market in rand denominated fixed interest bonds. Firstly, RSA bonds are now included in the Citibank World Government Bond Index – a widely applied bench mark Index for government bonds. This would have encouraged demand for RSA bonds and the rand, even though the intention to include SA in the Index (the result of growing demands for RSA bonds) was announced well before the actual event.

Secondly, and simultaneously negative for SA long term interest rates and the rand, was the announcement by Moody’s that it was joining S&P and Fitch (the other debt rating agencies) in downgrading SA’s credit rating.

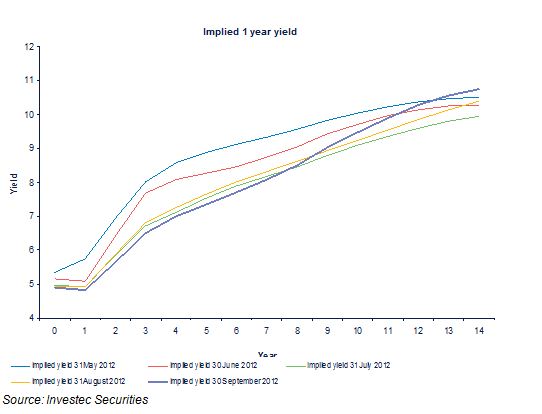
The impact of these events on the bond market was to be seen last week in a steepening of the yield curve beyond three years’ duration. The one year rate of interest expected by the market place in the future can be interpolated from the level and slope of the yield curve. As we show below, the market now expects short rates (one year yields, currently about 5% p.a.) to decline slightly over the next year and a half. They are then expected to increase to 6.5% in three and a half years and thereafter to continue to increase gradually, reaching a level of 10% in 15 years.

By South African standards this forecast or market consensus view would represent low and well behaved short term interest rates. The proactive decision by the Reserve Bank of Australia today to unexpectedly cut its key lending rate by 25bp may well encourage the SA Reserve Bank to follow its example. The market may now well price in a higher probability of an interest rate cut in SA.

The key to interest rates over the long run will be inflation; and the key to inflation will be global inflation coupled to the performance of the rand. In this regard, the markets are registering less expected weakness in the rand over the next 10 years. The gap between 10 year US Treasury yields and RSA 10 year yields has narrowed from about 6.38% a year ago to 4.9% on Friday.

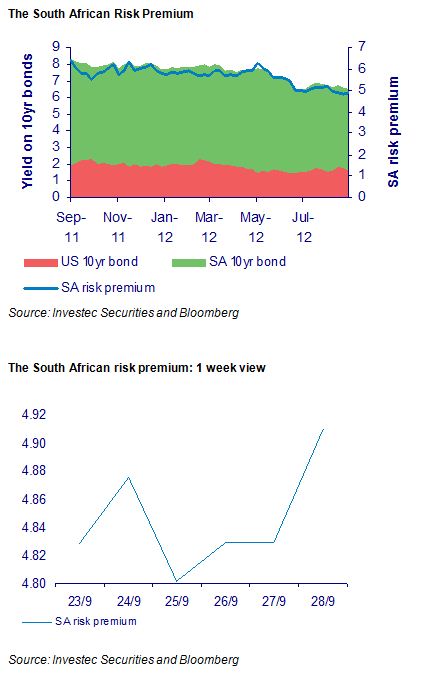
This difference in yields represents break even depreciation of the rand against the US dollar. If the rand depreciates by more than this it would pay to borrow dollars rather than rands (and vice versa if the rand depreciates by less). In other words, the cost of insuring against rand weakness over the next 10 years in the forward exchange market would approximate this difference in interest rates. This difference may also be described as the SA risk premium – nominal returns on SA securities measured in rands would be expected to exceed US dollar returns by this margin. Last week the SA risk premium widened from 4.83% at the beginning of the week to 4.9% by the weekend (see below). This difference is also described as the interest rate carry.

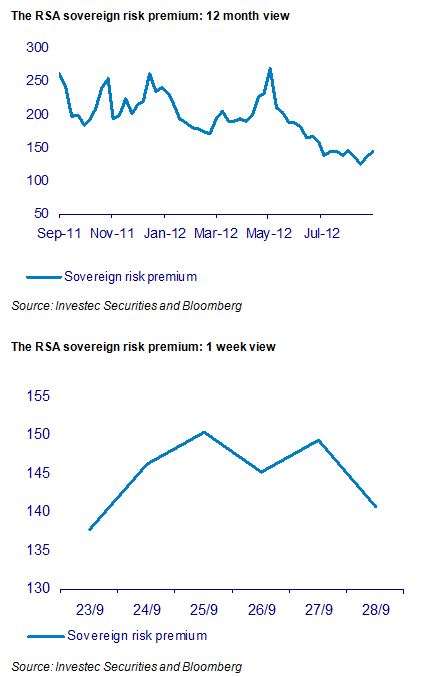
An alternative measure of SA risk is the sovereign risk premium. This is the difference between the yield on RSA US dollar denominated debt and that of US treasuries of similar duration. The reward for carrying RSA default risk has declined over the past year, very much in line with emerging market US dollar-denominated debt generally. Last week, this risk premium ended the week as it started (see below).

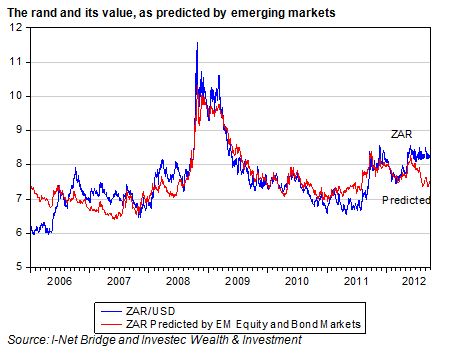
Movements in these bond market spreads on US dollar denominated emerging market debt can go a long way in explaining movements in the rand. However as we show below, the rand is currently significantly weaker than might have been predicted, given the levels of emerging market equities and bonds (about 10% weaker).
Perhaps this extra degree of rand weakness (attributable to SA specific events) is being recognised in less rand weakness going forward – as reflected in the lower interest rate carry. More rand weakness today is associated with less, rather than more, weakness expected tomorrow or next year.

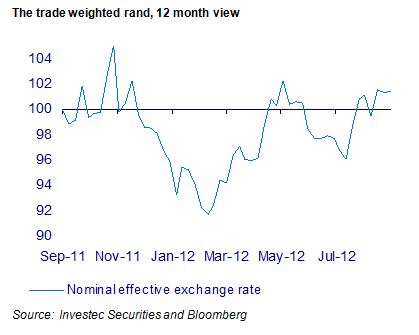
On a trade weighted basis it should be noted that the rand is little changed on a year ago and also was highly stable last week. This implies that little additional pressure on local prices is now being exerted from offshore. Brian Kantor

Why is capital so much more productive than labour in South Africa?

JSE listed companies have an impressive record of generating wealth for their shareholders. We show how they have done so through their excellent management of the capital they have invested. We show also that such impressive performance has been associated with tepid growth in Real Value Added by the SA economy and declines in formal employment.

Click to read the full piece.

Mediclinic (MDC) and Capitec (CPI): The rights and wrongs of a rights issue – revisited

A number of JSE listed companies, most recently Mediclinic (MDC) and Capitec Bank Holdings (CPI) have announced significant capital raising exercises by way of rights issues to its shareholders to subscribe additional equity capital. Mediclinic has planned to raise an additional R5bn from its shareholders, adding 26% to the number of its shares in issue, while Capitec will raise R2.25bn thus increasing its shares in issue by 14%. Both issues are underwritten.

If the rights to subscribe new equity capital are taken up by established shareholders in the same proportion they currently hold shares, their share of the company will be unaltered. They will be entitled to the same share of dividends as before.

There is no change in ownership when a sole owner or all shareholders inject additional capital in the same proportion as their established shareholding.

In the case of a rights issue, established shareholders may however elect to sell their rights to subscribe to additional shares should they prove valuable, in which case they are giving up a share of the company and rewarded for doing so.

The key question for shareholders and the market place is the following: how well will the extra capital raised be employed? Will the capital raised from old or new shareholders earn a return in excess of its opportunity costs? (That is, will it earn a return in excess of the returns shareholders or potential shareholders might expect from the same amount of capital they could invest in businesses with a similar risk character.)

If the answer is yes, the market value of the company could be expected to increase by more than the value of the additional capital injected into the company. If the answer is a no, then distributing cash on the books of the company to shareholders, rather than raising additional cash, would be appropriate.

The dilution factor

The common notion that issuing additional shares will “dilute” the stake of established shareholders, because more shares in issue reduces earnings per share, assumes implicitly that the additional capital raised will not be used productively enough to cover the costs of the capital raised or earn more than the required risk adjusted return.

But this is not necessarily so. Additional capital can be productively employed and can add, rather than reduce, value for shareholders. It will be up to the market place to decide the issue.

In the case of a secondary issue of additional shares (rather than a rights issue) the answer is easily found by observing the share price after the capital raising. A gain in the share price would be evidence of a value adding capital raising exercise for both established shareholders who did not subscribe additional capital and also for those who did.

However to be a truly value adding exercise, these share price gains would have to be compared to market or sector wide gains or losses. If the share price gains were above market average, the success of the capital raising exercise would be unambiguous.

Estimating the value add in the case of a rights issue is more complicated. This is because the rights are typically priced at a large discount to the prevailing share price before the announcement. The reason for pricing the rights at a discount to the prevailing share price is to attract attention to the offer and by so doing to make sure that the rights to subscribe additional capital will have market value and so will be followed and the additional capital secured.

It should be appreciated that the established shareholders would be largely indifferent to the price selected for the rights issue. The lower the price, the more shares would have to be issued to shareholders to raise the same amount of additional capital. In effect, the shareholders are issuing shares to themselves – as would a sole owner injecting more capital into his or her business. For a sole owner the nominal price attached to the shares would be irrelevant. The lower the nominal price attached to the shares the larger the number of additional shares to be issued for the same amount of capital invested. The same is true of a rights issue. What matters is the amount of capital the shareholders are called upon to subscribe to. This can be divided into a larger or smaller number of shares by adjusting the price at which the rights are offered.

In the case of the Mediclinic rights issue, the company has priced the rights at 28.63 cents per share, raising R5bn by issuing 1.76m additional shares. Management might have decided to halve the offer of shares to 14.315 cents per share and issued twice as many shares, without disadvantaging the shareholders on its books. The advantage in offering large discounts is that the rights to subscribe to the new shares are very likely to offer positive value and if so, may more easily be disposed of by those shareholders who are financially constrained.

Simply put, the Mediclinic rights issue will be value adding for established shareholders if, after the capital raising exercise is concluded and the money raised, the company is worth more than an extra R5bn and the Capitec rights issue will be successful if the company is worth R2.3bn after its capital raising processes has been concluded.

Putting it algebraically

Some simple algebra can help make the point (readers without a mathematical bent may choose to skip this part and proceed to the conclusion). The break even condition is that the market value of the company after the conclusion of the capital raising exercise (defined as MC2) will be greater or at least equal to the market value of the company pre the rights issue, defined as MC1 plus the additional capital raised defined as k. That is MC2>MC1+k if the capital raising exercise is to be judged a success.

This equation may also be used to establish a share price that would represent a break even for shareholders after the conclusion of the rights issue. That is, the share price after the event that would satisfy the value add (or rather the no value loss) condition. MC2, the value of the company after the rights issue is concluded, may be derived conventionally by multiplying the share price (post rights issue) by the number of shares in issue (S2), that is the market value of the company after the capital raising exercise MC2 = P2 * S2 and MC1, the value of the company before the announcement, calculated in the same way as P1*S1 where S1 was the number of shares in issue before the rights issue. P2 is the breakeven price after the announcement. Substituting P1*S1 for MC1 and P2*S2 for MC2 and solving this equation for P2, the break even post rights issue price, gives the following formula for the break even share price after a rights issue as: P2 = (S1*P1+k)/S2.

In the case of Mediclinic, P1 was R40.05, the price ruling on the day before the announcement on 1 August. There were 652.3m shares then in issue (S1= 653.1m). After the rights issue, the number of shares in issue will rise to 827m (S2). K, the additional amount to be raised, is R5bn. Thus the break even share price P2 = R37.6.

Mediclinic closed at R40 on 27 September while the value of the rights closed at R11.30. Since shareholders received the right to 26.77 shares per hundred shares owned, these rights were then worth R3.02 per share to each shareholder (11.3*0.2677). Thus the post rights value of a share in Mediclinic was approximately R40.00 plus R3.02, that is R43.02, on the day before the trade in the rights was to close and comfortably in excess of the R37.6 break even share price.

If the price of a Mediclinic share today (1 October) maintains its 27 September value of approximately R43, the company will be worth R35.5bn. This may be compared to its pre-rights value of R26.12bn. In other words shareholders have put in an extra R5bn and have added value of R4.38bn. This rights issue may be regarded therefore as successful.

The break even share price for Capitec, by the same calculation, is R200.6. The share price on 27 September was R215.5. This price incorporates the rights to new shares at R160 that can be traded after 22 October until 2 November. If this value were to be maintained after 2 November, the company (with 114.4m shares then in issue) would have a market value of R2.45bn. This may be compared to its market value of R2.07bn before the announcement of the rights issue. Thus shareholders would be getting an extra R3.956bn for the additional R2.248bn they are investing in the company – a gain of R1.71bn.

Conclusion

Thus the capital raising exercises of both Mediclinic and Capitec may be regarded as very successful, at least so far. They are clearly expected to add value to the companies, that is, the extra capital raised is expected to more than cover its costs, above the risk adjusted required rate of return for investments of a similar character. Brian Kantor