Private sector credit: No joy or danger

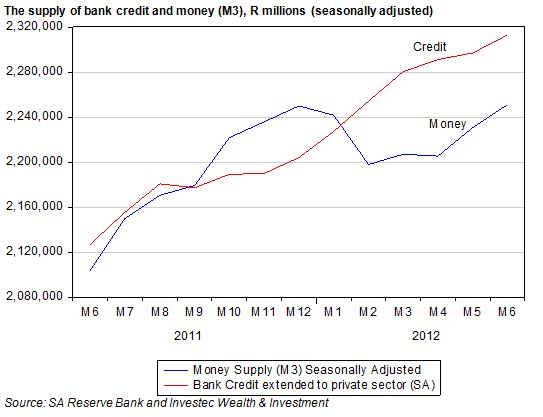
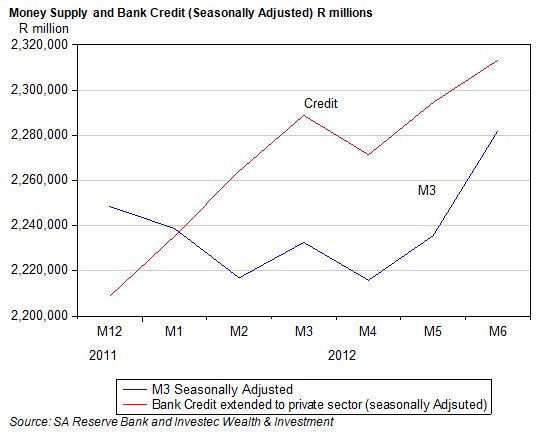
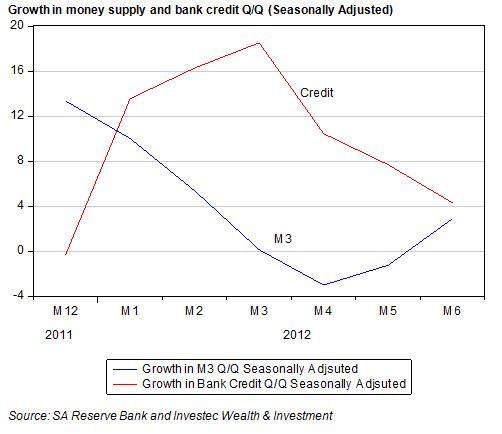
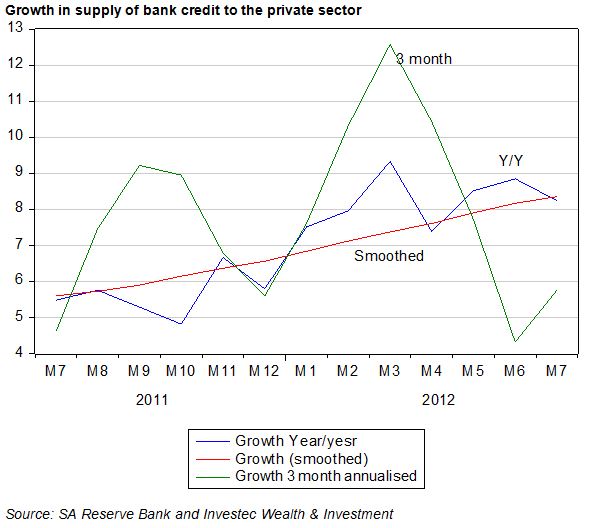
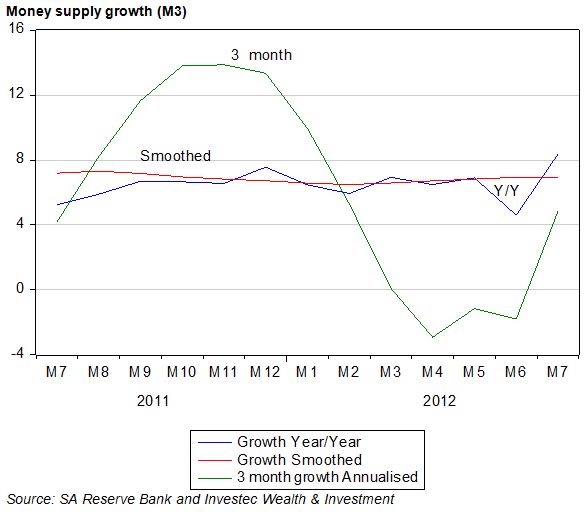
Bank credit and money supply statistics for July 2012, released yesterday, indicate that growth in the demand for and supply of credit and money continues at a sedate pace. The pace of growth appears strong enough to keep the economy moving forward – but at a pace that will not fully engage the economy’s potential.

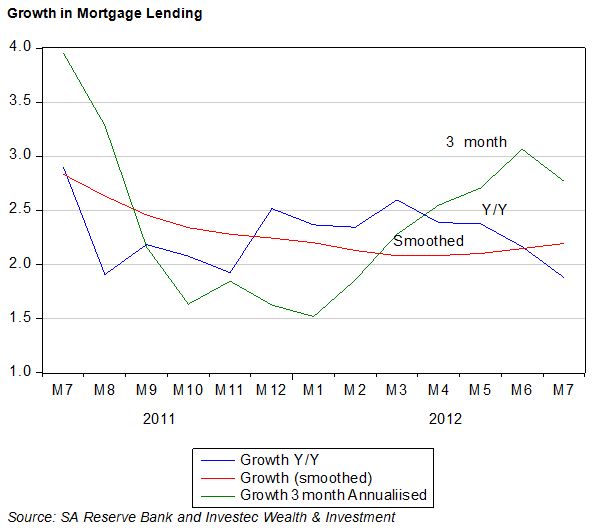
In line with house prices, that are at best moving sideways, mortgage lending by the banks continues to grow very slowly, at about a 2% per annum rate. Growth in mortgage lending over the past three months however did pick up some momentum – perhaps indicating some reversal of recent trends. Without a demand from their customers for secured credit, the interest the banks have in expanding access to unsecured credit will hopefully be sustained, supplying some impetus to the economy that is sorely needed.

These trends confirm that monetary policy will stay on an accommodative course – designed to encourage domestic spending when little help can be expected from the global economy and demand for exports. Credit and money supply trends help make the argument for lower rather than higher short term interest rates. Brian Kantor

You can’t always get what you want: Is platinum mining profitable?

The Rolling Stones captured the disillusion of the 1960s counter culture in their hit song “You Can’t Always Get What You Want”. It was released in 1969 after the initial wave of 1960s optimism had surged to anger and disenchantment. The song offers practical hope by suggesting that we should strive to get what we need since we’re bound to fall short in getting what we want.

The platinum industry has been one of great hope and now disillusionment. Has it been profitable and created value? Is it profitable today and what is implied in the share prices of platinum mining companies? By answering these questions, we can begin realistically to untangle economic wants and needs.

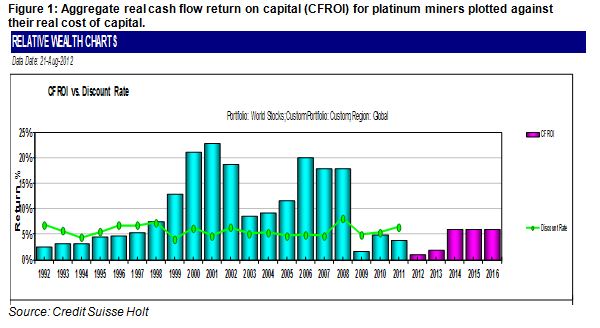
We’ve aggregated the historical financial statements of the four largest platinum miners (Anglo American Platinum, Impala, Lonmin and Northam) and calculated the inflation-adjusted cash flow return on operating assets, CFROI®. From 1992 to 1997, platinum miners were generating an unattractive return on capital, which slipped below the cost of capital. The years 1999 to 2002 provided the first wave of extraordinary fortune for this industry. The real return on capital exceeded 20%, making it one of the most profitable industries in the world at that time. The rush was on to mine platinum and build company strategies around this effort. Lonmin bet its future on platinum.

The second wave of fortune occurred during the global commodities “super cycle” from 2006 to 2008. Again, platinum mining became one of the most profitable businesses in the world as shown in our chart. The good times ended abruptly with the onset of the Great Recession in 2009, and platinum miners saw their real return on capital drop below 2% – well below the cost of capital, i.e., the return required to justify committing further capital to the industry.

Unfortunately, operating returns have not improved much and have remained below the cost of capital throughout the global slowdown due to increasing labour and excavation costs, and lower platinum prices. Suffice to say, platinum miners aren’t producing sufficient returns to satisfy shareholders. This has resulted in cost-cutting, lay-offs and chops to capital expenditure plans. These are natural economic consequences when a business is destroying economic value by not meeting its cost of capital.

And what does the future hold? We’ve taken analyst expectations for 2012 and 2013 and estimated the real return on capital. It remains very poor at a wealth destructive level of 2%. There is no hint of a return to superior profitability in the share prices of platinum miners. At best, the market has them priced to return to a real return on capital of 6%, which is the average real cost of capital.

It looks highly unlikely that platinum miners will be able to satisfy the wants of their stakeholders. All parties should focus on what is realistically possible and economically feasible. The workers and the unions already subject to retrenchment and very poor job prospects would surely be wise to focus on job retention rather than further gains in real employment benefits. Though grave damage to employment prospects in what was once a promising industry has surely already been done, northern Europe’s response to the Great Recession remains a potential template for management and labour. The cold reality is that capital in the form of increasingly sophisticated and robotic equipment will continue to replace labour. Management will have had their minds ever more strongly focused on such possibilities by recent events.

Moreover, SA has a responsibility to the global economy to supply platinum in predictable volume: the motor industry depends on this. Higher platinum prices, while a helpful short term response to disrupted output, would encourage the search for alternatives to platinum for auto catalysts. This would mean a decline in platinum prices over the long term.

Unless the industry can come to deliver a cost of capital beating return, its value to all stakeholders will surely decline. Perhaps they will even decline to the point where nationalising the industry with full compensation might seem a tragically realistic proposition.

Nationalisation will not solve the problem of poor labour relations and the decline in the productivity of both labour and capital in the industry. It would simply mean that taxpayers, rather than shareholders, carry the can for the failures of management. To its financial detriment, government would have to invest scarce funds in a capital-intensive industry that is not generating a sufficient return. Workers might think management (subject to the discipline of taxpayers rather than shareholders) would be a softer touch, but this would lead to the spiral of greater destruction of economic value and ultimately fewer jobs. Government and taxpayers should be very wary of signing a blank cheque. All parties need to focus on what is realistically possible and economically feasible. David Holland* and Brian Kantor

*David Holland is a senior advisor to Credit Suisse and was previously a Managing Director at Credit Suisse HOLT based in London in charge of the global HOLT Valuation & Analytics group.

Interest Rates: The Marcus Put

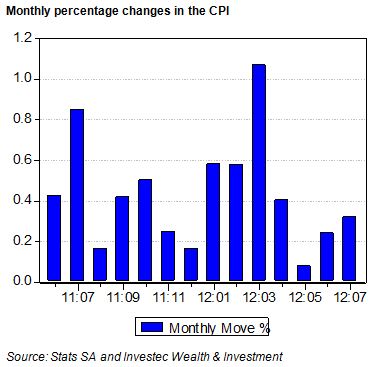
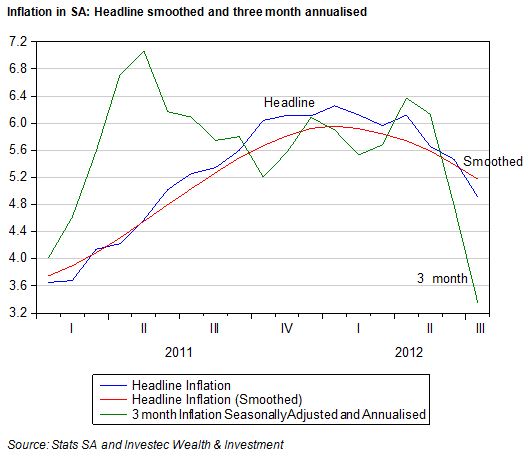
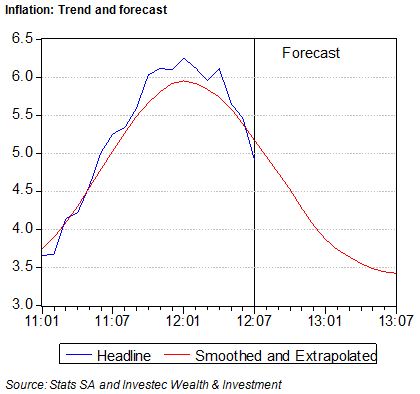
Headline CPI inflation declined to 4.9% for the 12 months to July. This welcome lower rate of inflation does not tell the full story of the direction of prices. A year can be a long time in economic life and what happens to prices in between can be much more revealing about inflation trends. Over the past three months prices have increased very slowly – more slowly than they did a year ago, as we show below. Prices rose by 0.08% in May, 0.24% in June and 0.32% in July.

These relatively small monthly increases compared to a year before have brought down the three month rate of inflation, seasonally adjusted and annualised, sharply lower to well below 4%. ( See below)

If current trends in the CPI persist, the outlook is for an inflation rate of no more than 3.5% this time next year, as we show in the chart below. It should be noticed that monthly increases in the CPI were particularly rapid early this year, thus offering the possibility of seeing year on year inflation come down further in early 2013 (that is, if monthly increases then turn out to be below the rather high monthly increases of early 2012).

These trends could be damaged by a combination of a weaker rand and supply side disruption (drought and war) which might drive global grain and oil prices higher. If global growth gathered enough momentum to drive up metal and commodity prices generally, for demand side reasons, the rand might well strengthen to moderate such influences on the prices of imported and exported goods. Faster growth in export markets would be very helpful to the SA economy. It could bring faster growth without more inflation, because the rand will strengthen.

Slower global growth would be very likely to weaken the rand and cause the inflation numbers and outlook to deteriorate. The domestic economy will also be harmed by such trends. It would mean slower growth and higher inflation. The case for raising interest rates under such adverse circumstances is a poor one. It would mean still slower growth without any predictable impact on the inflation rate.

The Reserve Bank, under present leadership, seems unlikely to raise rates should this adverse scenario materialise. If the economy stays its present course (less inflation and growth that remains below potential growth), the case for lowering rates improves. The more hopeful scenario – the SA economy to benefit from a reviving global economy and higher commodity prices and a more valuable rand meaning no more inflation – the case for lower interest rates also improves.

And so in the light of currently lower inflation, the case for lower interest rates has improved. Furthermore it is hard to contemplate more favourable or less favourable economic circumstances that would drive short rates higher. We might describe the outlook for (lower) interest rates in SA as the Marcus Put. Brian Kantor

SA economy: Growing, but at a decelerating pace

Retail sales help confirm a welcome recovery of spending in June

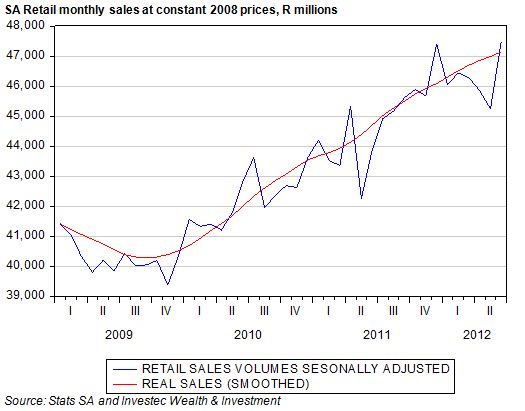
Retail sales volumes reported by Stats SA last week confirm that the SA economy had a rather good month in June. Sales volumes picked up strongly, having grown very little on a seasonally adjusted basis between December 2011 and May 2012. As we show below retail sales volumes(at constant 2008 prices) recovered strongly in late 2009 from their post recession lows, picked up momentum in late 2011, but then fell away rather badly on a seasonally adjusted basis in the first five months of 2012.


We had learned earlier that June 2012 was also a good month for the banks. This is not a coincidence: economic activity tends to lead rather than follow bank lending. The banks respond to demands for credit to fund intended spending decisions by households and firms. Bank credit extended to the private sector grew strongly in June 2012, as did the deposit liabilities of the banking system (known as M3, the broadly defined supply of money). M3 almost flat-lined between December and May while bank credit grew steadily over the period and also picked up momentum in June.

The data for June 2012 may be regarded as encouraging enough to suggest no further cuts in interest rates are necessary to keep the economy going forward at a satisfactory pace. However June is a long time ago. We are more than half way through August and a month can be a long time in economic life.

Updating the state of the economy to July 2012

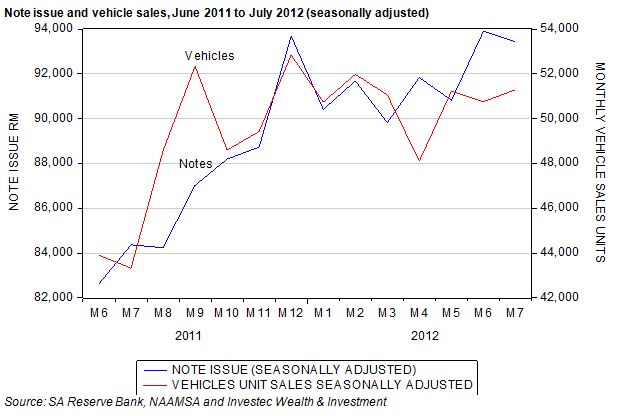
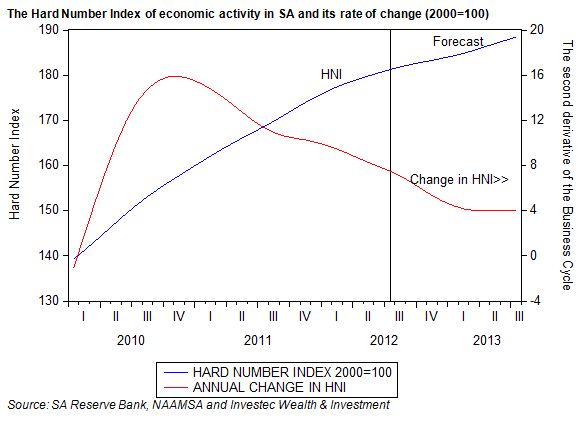
We do however have some useful additional information about developments in July 2012, in the form of vehicle sales and the notes issued by the SA Reserve Bank. These two hard numbers help make up our hard Number Index (HNI) of the immediate state of the SA economy (or, to put it more precisely, combining the vehicle sales with the note issue adjusted for the CPI, equally weighted, gives us the Hard Number Index). As may be seen below, both series show a very similar pattern to that of retail volumes and the money and credit numbers. They show a good recovery in activity in the second half of 2011 that accelerated towards year end. Thereafter activity flat-lined between January and May 2012 as may be seen below. It may also be seen that in July the faster pace was maintained at the higher June levels.

The Hard Number Index (HNI) – an estimate of the state of the SA economy in July

An HNI above 100 indicate growth in economic activity. As may be seen below, economic activity in SA according to the HNI continues to expand but at a slower pace. When these trends are extrapolated further the outlook is for further increases in economic activity and for the rate of increase to slow down further.

Why the HNI is a good leading indicator for the SA economy

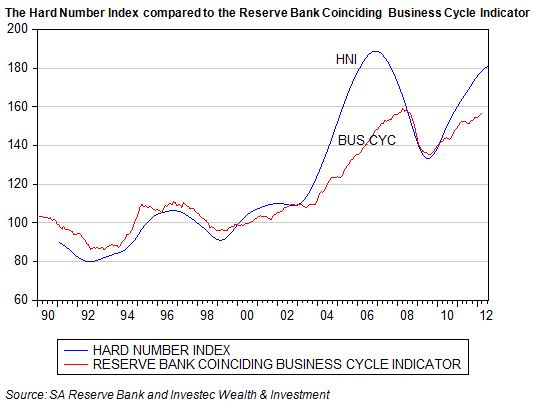
In the figure below we compare our HNI to the Reserve Bank Business Cycle Indicator that is based on a wider number of activity indicators based on sample surveys. Both series indicate very little growth in economic activity before 2003, with numbers that stayed around 100. The measures of economic activity have been consistently well above 100 ever since 2002, indicating that the economy has grown consistently since then, though at a forward pace that accelerated until 2006; slowed down between 2006 or 2007; and then picked up forward momentum in 2010.

The two series have tracked each other very well over the years. They indicate the same time in 2010 when the pace of growth began to accelerate again rather than decelerate. The rate of change of the HNI turned down well before the Coinciding Indicator in 2006 as may also be seen. The advantage of the HNI is that it very up to date – available measured for July 2012 while the Reserve Bank Indicator has only been updated to only.April 2012.

The HNI may therefore be regarded as a very useful and up to date indicator of the SA Business Cycle. There is every indication from it that the SA economy will continue to grow in 2012-2013 but at a decelerating pace that is not likely to threaten any change in current interest rate settings. These have been helpful to date in keeping the economy moving forward, despite a weaker global economy, by encouraging household spending and the extra credit needed to sustain it. Brian Kantor

Keynesian economics and Quantitative Easing: Can they restore economic health?

The economic problem is usually one of unlimited wants and highly limited means to satisfy them. It is a supply side problem that only improved productivity and improved access to capital or natural resources can ameliorate.

Economic growth sustained over the past 200 years or so has helped many to overcome the economic problem, at least to a degree. When obesity rather than starvation becomes the major danger to individual well being in the developed economies considerable economic progress has been made.

But sometimes the economic problem becomes one of too little spending rather than of dismal constraints on spending. Too little demand is now the major problem in many of the developed economies and also for us in SA. Given the current availability of labour, plant and equipment in the US, Europe and SA, more goods and services would be produced and more income would be earned in the process of expanded production, if only economic agents would spend more. More spending is thus possible without the usual trade-offs and choices having to be made between one kind of spending or another. There is no opportunity cost to employing more resources when they are standing idle.

It was a severe lack of demand that severely afflicted the US economy and other economies in the 1930s. The US economy nearly halved its size between 1929 and 1933 and economic activity had not recovered 1929 levels by 1939. These catastrophic economic events gave rise to what has come to be known as Keynesian economics, named after the famous English economist John Maynard Keynes. Keynes in the late 1930s had persuaded much of the economics profession to agree that in the absence of sufficient demand from the private sector (firms and households) governments should fill the gap between potential and actual supply of goods and services by spending and borrowing more. In other words, he argued for expanded fiscal deficits to stimulate demand when aggregate demand was painfully lacking.

Keynesianism today

Such arguments are being made today, most prominently by Nobel Prize winning economists Paul Krugman and Joseph Stiglitz. They argue against the austerity apparently being practised by the US and European governments or recommended for them. In fact the fiscal deficits of the US and UK have widened enormously, and more or less automatically, as government revenues declined with the recession and as government spending, including spending on bailing out banks and other financial institutions, increased. But whether the larger deficits or higher levels of government spending helped to stabilise their economies, as the Keynesians predict, is not at all obvious. Arthur Laffer, in a recent Wall Street Journal article, argued that the opposite has in fact happened: that the stronger the growth in government spending, the slower the growth in GDP. He presented the following table linking changes in government spending to declines in GDP growth as evidence for this:
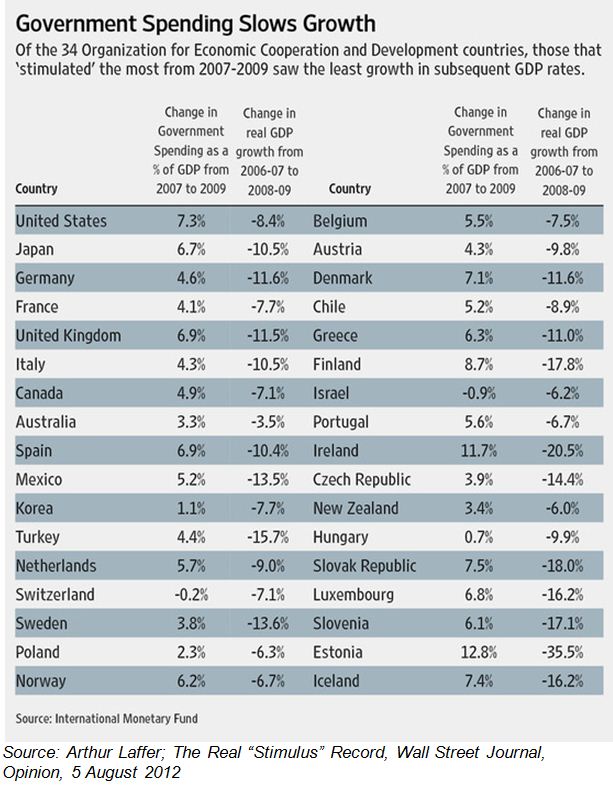
The UK, US, Germany and Japan, despite increased spending and larger deficits and borrowing requirements, have enjoyed one great advantage not available to Greece, Portugal, Ireland, Spain and Italy. The cost of borrowing, even of issuing very long term loans in the US, UK and Germany, has come down dramatically while the interest rates charged to Spain and Italy have risen enough to threaten their fiscal viability.

In contradiction to the Laffer evidence, it may be argued that growth would have been even slower without these increases in government spending. In the case of the Krugman-Stiglitz arguments for less, rather than more UK austerity, there is no way of knowing with any confidence what might have happened to interest rates in the UK in the absence of intended austerity. Higher interest rates would have severely further limited spending by the private and public sectors in the UK, had borrowing costs been forced higher by nervous investors in UK gilts.

The limits to government spending

The essential criticism of the Keynesian approach to recessions is that governments can only ever account for a portion of total spending. Increased spending by the public sector may well be offset by lower levels of spending by households and firms fearful of the impact of extra government spending and borrowing on their own financial welfare.

Higher interest rates associated with more government borrowing may crowd out private spending Higher taxes that will be expected to levied in the future to cover interest to be paid on a much enlarged volume of government debt may induce more private savings. Households and firms may seek to protect their own balance sheets and wealth that they believe may be subject to higher levels of taxation.

The potential limits to the ability of governments to increase total spending and the danger that firms and households and other government agencies may spend less, can be illustrated by reference to the US GDP statistics and Budget.

Of the US GDP of nearly US$14 trillion in 2011, spending by all government agencies, Federal, state and municipal governments on consumption and investment amounted to $3 trillion or 21% of GDP. Of this spending the Federal government accounted for but $1.14 trillion or about 38%.

Even when government spending is a large proportion of GDP, a high percentage of this is in the form of transfers to households and firms. So spending decisions are in the hands of these households and firms, who might feel constrained for the reasons outlined above.

Normal times would have meant no need for QE 1, 2 or 3 or for the very low interest rates that have accompanied QE (quantitative easing). The collapse of Lehman Brothers in September 2008 threatened to bring down the US banking and financial system. Flooding the system with liquidity (cash created by the Fed) is the time honoured method of preventing a financial implosion. The great free marketer and anti-Keynesian, Milton Friedman, with Anna Schwartz in their monumental work Monetary History of the US, had accused the Fed failing to respond in this way in 1930 and by so failing in its mission, allowed a preventable financial crisis to become an economic crisis of disastrous proportions. This was not a mistake Ben Bernanke (well versed as he was in monetary history), was going to make as head of the Fed.

What about the liquidity trap?

But the Bernanke-led Fed, having avoided a financial implosion, is faced with a problem that both Keynes and Friedman were very conscious of. Keynesians wrote of the dangers of a liquidity trap: that cash could be made freely available to the banking system at very low interest rates by the central banks; but if the banks were reluctant to lend and its customers reluctant to borrow or spend, the cash would get stuck with the banks or the public. The system could fall into the liquidity trap and so lower interest rates or increases in the supply of cash would do little to stimulate economic activity.

Keynesians then call for government spending. Friedman and Bernanke in their writing called upon a hypothetical helicopter to by-pass reluctant banks to spread cash around, which would be spent to help the economy recover. Bernanke came to be known disparagingly as helicopter Ben for this idea. The trouble with helicopter-induced money creation is that it would have to be sanctioned by Congress – it would have to be included in the Budget as fiscal policy. This makes it a highly impractical response.

Given an inability to force co-operation from banks to inject cash and spending into the system, the Fed and the European Central Bank have to rely on monetary policy. They would thus continue to make cash available to the banking system and to engage in QE, so keeping the financial system afloat, and to hold interest rates as close to zero for as long as it takes, until confidence and entrepreneurial spirits revive. Moreover, Bernanke has been lecturing politicians on the need to exercise fiscal propriety to help restore business and household confidence. Brian Kantor
Global markets: Becoming more cold-blooded

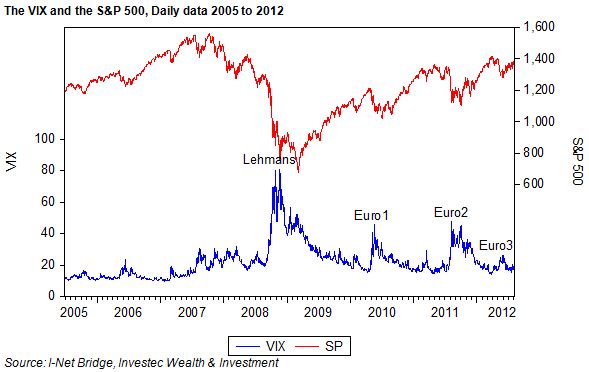
The Volatility Index (VIX), which is traded on the Chicago Board Options Exchange and that reflects the implied volatility of an option on the S&P 500, has been trading at very low levels recently. It has been in the mid teens, or at levels that were common before the Global Financial Crisis triggered by the collapse of Lehman Brothers.

As we show below the VIX rose to as much as 80 in late 2008. We also show how the Euro Crises drove the VIX markedly higher, though never to Lehman type levels of anxiety.

What is noticeable is just how little affected the share markets and the options traders were by the latest flurries in the share dovecote caused by weakness in Spanish and Italian debt. Judged by the behaviour of the VIX this year, the markets have not been nearly as noisy as the commentators.

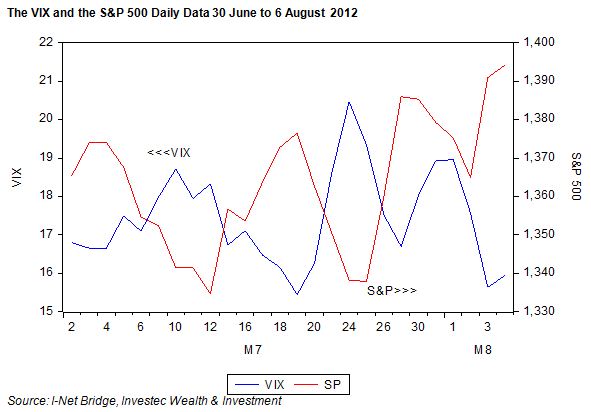
We also show that where the VIX goes, so goes the S&P 500 in the opposite direction. When risks go up (as reflected by actual or implied volatility of share prices) returns (that is share prices) go down and vice versa. The correlation between daily percentage moves in the VIX and the S&P is (-0.80), which is very close to a one to opposite one relationship.

This may (hopefully) mean that we have entered a much more sanguine market place and if sustained, this degree of detachment will remain helpful to shares and what are regarded as riskier bonds. The safe haven bonds, by the same token, will not then attract the same anxious attention to the point where favoured governments have been paid by investors to take their money for up to two years rather than the other way round.

The attention of the market place may turn much more closely to the outlook for earnings and interest rates rather than the the very hard to estimate (small) probability of catastrophic financial events. These probabilities can alter meaningfully from day to day, so adding to share and bond price volatility of the kind observed post Lehman and post the Euro crises

The JSE in July: Interest rates matter

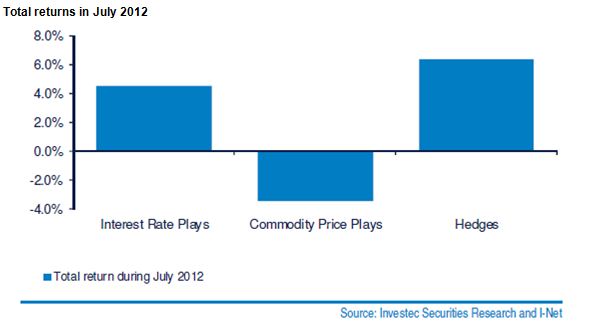
July 2012 proved to be another good month for the Interest rate plays and the Industrial Hedges listed on the JSE Top 40 Index. It was yet another poor month for the Commodity price plays as we show below.

The Industrial hedges are those large cap companies listed on the JSE that are largely exposed to the global economy and whose values are insensitive to both SA interest rates and commodity prices. British American Tobacco, SAB, Naspers and Richemont have proved highly defensive against the risks to the global economy posed by the Eurozone crisis. The cyclical commodity price plays by contrast have been much damaged by these anxieties and share market trends in July proved no exception.

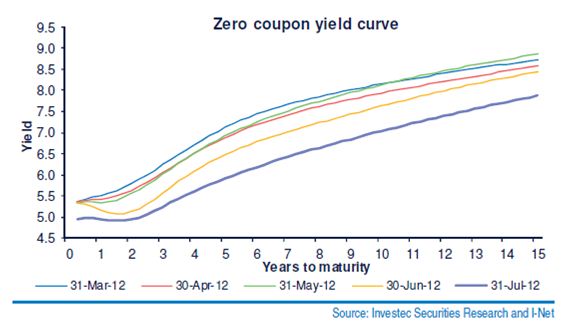
The interest rate sensitive stocks, especially banks, retailers and listed SA property (all of which are highly dependent on the SA economy) have benefitted from the surprising decline in SA interest rates and especially the July cut in the Reserve Bank repo rate. We show below, with the aid of Chris Holdsworth of Investec Securities, just how significantly lower SA interest rates have moved across the yield curve in recent weeks.

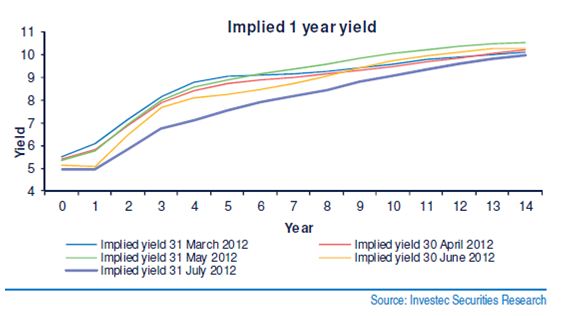
The term structure of interest rates at any point in time makes it possible to infer the short rates expected by the market over the next 15 years. As we show below the rate of interest on RSA bonds with one year to maturity is now expected to remain unchanged over the next year. Then it is expected to increase much more gradually over the next few years and to remain below 7% p.a for another four years. This outlook for interest rates is very encouraging to those companies for whom interest rates are an important influence on their revenues and profits.

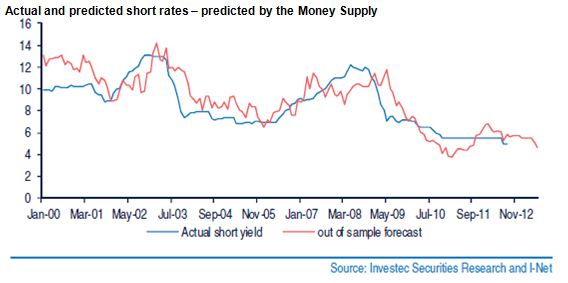
The market in fixed interest securities can change its mind and can be expected to do so again. Holdsworth has developed and successfully tested a theory about the forces that drive the gap between long and short rates in SA. The theory is that money supply growth rates lead interest rate moves by about 12 months. The explanation for this is highly plausible. Given monetary policy practice in SA, the supply of money (defined broadly as M3) and bank credit accommodate the demand for money and credit. Economic activity therefore leads money supply and credit growth and so subsequent moves in interest rates. In other words, economic activity leads and money supply and interest rates follow in due course.

The test of this theory of short term rates is shown below. The money supply has done a good job at predicting short rates and has done better, statistically, than the yield curve itself in forecasting short rates. The Holdsworth prediction, given recent money supply trends, is for still lower short rates to come, of the order of 4.6% p.a in 12 months’ time. The forecast of the three month rate in June 2013, implicit in the Forward Rate Agreements offered by the banks, is currently 4.9% p.a.

Whether these forecasts will prove accurate or not will depend upon the state of the SA economy over the next 12 months. The stronger the economy the higher will be interest rates and vice versa. All will be revealed by the growth in the balance sheets of the banking system, that is in the money supply broadly defined (M3). These constitute most of the liabilities of the banks and the supply of bank credit. These money and credit aggregates as well as the state of the economy will be closely watched by the Reserve Bank.

However when these aggregates are converted into growth over three months (calculated monthly), the picture looks rather different. Growth in credit supply has slowed sharply while growth in M3 remains anemic with both now at about a 4% p.a. rate of growth. Such growth rates, if maintained, would mean lower rather than higher interest rates to come. These aggregates will bear especially close watching over the months to come. Brian Kantor