Interest rates globally have been on a sharply upward tack in recent weeks. Whether this is good or bad news depends on the reasons for the higher interest rates. If the higher rates are largely a response by markets and central banks to expectations of permanently higher inflation, it will be bad news for all but short-term lenders. The increases however could be caused by something else, by an increase in the real productivity of capital and in the willingness of borrowers to pay up for now more valuable capital.
Higher rates driven by increased demands for capital portends faster growth in incomes. More supply to come, perhaps even with less inflation, as increased debt funds income and output enhancing plant and equipment and value adding R&D. And the response to market determined interest rates in the marketplace for assets, including the value of the companies that invest in plant and equipment and R&D, will depend on the causes of higher interest rates, and their effects.
The market determined present value (PV) of any company will depend in part on estimates of the flow of operating profits over time and after taxes. The stronger these expected flows of revenues less costs, and the longer the period over which the estimated operating profits will flow, the more valuable any company will be. But since operating profits earned in the future are less valuable than profits now, the value of future profits will be discounted by an appropriate rate of interest, by the opportunity cost of capital. The higher these costs, the higher this discount rate, the less valuable the company- for any expected flow of operating profits and taxes. A 100 worth of operating profits after taxes to be received in ten years’ will be worth 39 today given with a discount rate of10% p.a. and worth only 25 should the discount rate be 15% – close to the cost of capital in SA.
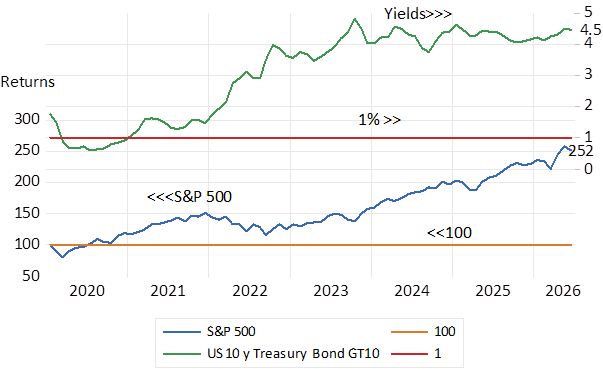
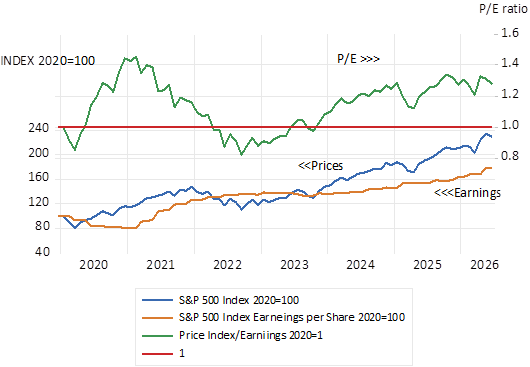
But the discount rate for such a PV calculation will not be established independently of the top line for the average company. The more growth in revenues and costs expected across the wider global economy, perhaps aided by inflation and real growth, the stronger the top line of the PV calculation, the more demand for capital to invest, and so the higher the discount rate is likely to be. It is very possible, as is the case this year In the US, for returns on equities to be positive while returns on bonds are negative. The numerator of the PV calculation, the growth expected operating profits, has been more powerful recently than the denominator, the higher discount rate. This outcome, a positive correlation between equity and bond market returns is by no means unusual. [1]
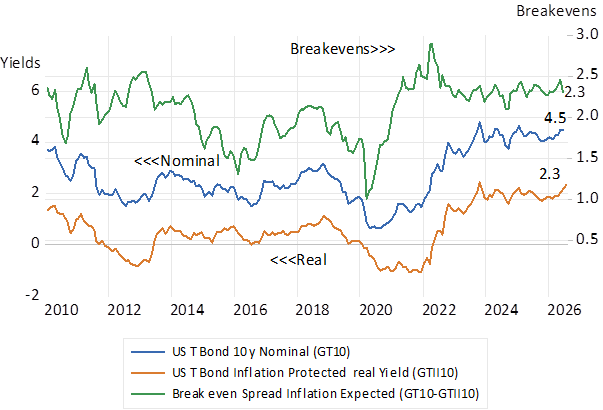
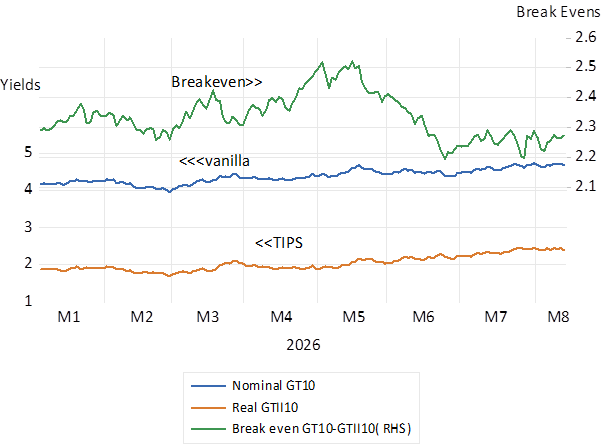
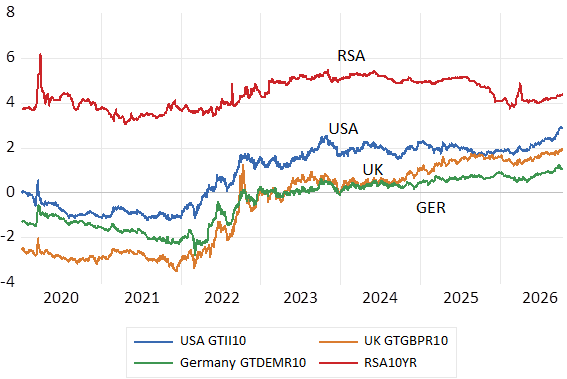
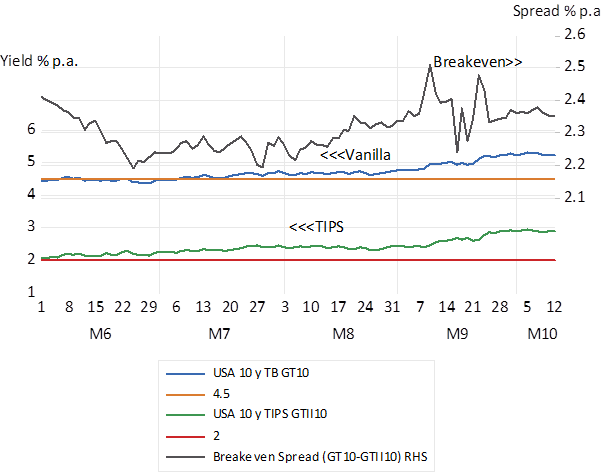
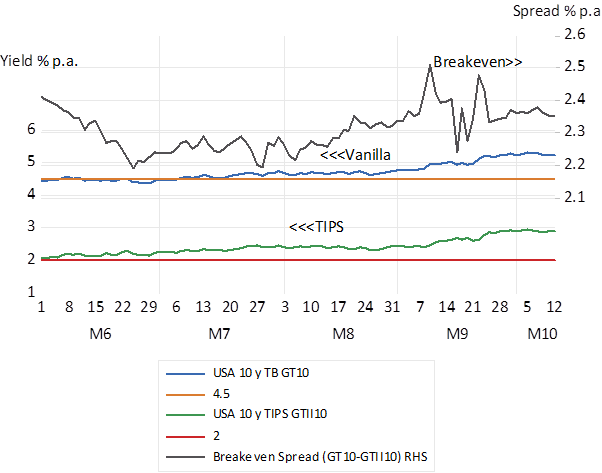
When real inflation protected yields rise it should be regarded as the response to a real increase in the demand for capital. When the nominal yields on a vanilla bond increase, it could be because more inflation is expected. And or because real yields have risen. The recent increase in the yield provided by the key US 10-year Treasury Bond from 4.45% p.a. in early June to well over 5.2 % p.a. by October 12th, some 79 basis points, has been accompanied by an even larger increase in the equivalent inflation protected bond (TIPS) of 84 basis points. That is the increase nominal interest rates in the US have been driven by an even larger increase in real yields in the US.
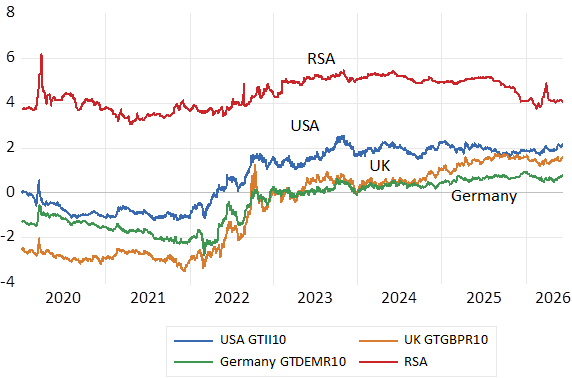
Fig. 1; Real Interest Rates in different Currencies. 10-year Inflation Protected Bond Yields
Source; Bloomberg and Investec Wealth & Investment
The difference between the respective yields, the lower initial real yield on a fully inflation protected bond, and the higher yield on a vanilla bond, exposed to the risk of inflation, can be assumed to reflect inflation expectations. These differences in yields are described as breakeven yields that compensate the lender for expected inflation. inflation expected is little changed this year and close to but still above the inflation target of 2% in the US. Real 10-year yields in the US are now close to 3% p.a. It is a real rather than an inflation story driving higher long term interest rates in the US.
Fig. 2; US Nominal and Real Inflation Protected Bond Yields and their Differences. Daily Data June-October 2026
Source; Bloomberg and Investec Wealth & Investment
Which given the importance of the US in the market for capital has driven interest rates higher across the globe. Higher real yields in the US are highly consistent with the underlying strength of the US economy. Revealed by highly buoyant indexes that measure economic activity, especially activity in the service sectors (PMI’s) and by the very strong growth in bottom line earnings. The huge growth in capex spending by the IT superscalars now more than exhausting still very large internally generated cash flows, has become a source of much newly issued debt. Borrowing to fund growing fiscal deficits is another important source of demand for capital. And a now stronger USD is consistent with an increased flow of foreign capital to the US.
When real inflation protected yields rise it should be regarded as the response to a real increase in the demand for capital. When the nominal yields on a vanilla bond increase it could be because more inflation is expected. And or because real yields have risen. The recent increase in the yield provided by the key US 10-year Treasury Bond from 4.45% p.a. in early June to well over 5.2 % p.a. by October 12th, some 79 basis points, has been accompanied by an even larger increase in the equivalent inflation protected bond (TIPS) of 84 basis points. That is the increase nominal interest rates have been driven by an even larger increase in real yields in the US. It is the real demand for capital that is driving interest rates higher in the US. Indeed, good news about the US economy.
Fig.3; US Production Managers Composite Index. Monthly Data and Long-term Interest Rates
Source; Bloomberg and Investec Wealth & Investment
A postscript – Some reflections on interest rate spreads. Real and Nominal rates
The sustained differences in real yields between the different currencies, including the much higher real yields on offer in SA, is explained by expected exchange rate movements. The real yields on offer are realised in different currencies. The return from the inflation linker in a foreign currency will be reduced or increased for a foreign currency investor by movements in exchange rates. The expected real fully inflation protected returns therefore depend in part on the expected movement in exchange rates. Higher real yields offered in a domestic currency may be offset by exchange rate weakness. Furthermore, judged by past performance, there can be no presumption of exchange rates following purchasing power parity. (PPP) The movements in exchange rates are very unlikely to closely match differences in inflation. Independent currencies therefore carry real exchange rate risk. The risk that is of deviations from PPP.
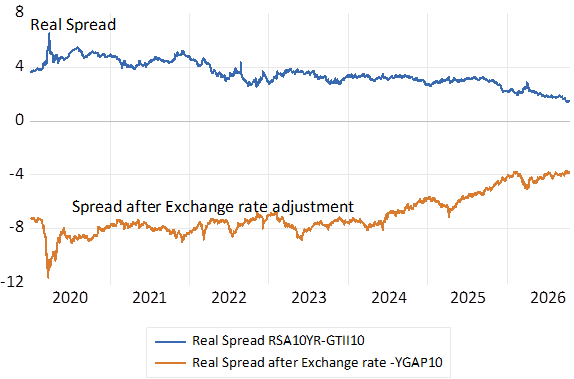
The same expectations of exchange rate movements made explicit in the market for vanilla bonds may be applied to the market in independent currency inflation linked bonds. For example, the higher real rand yield on an RSA inflation linker (4.2% + SA inflation) when compared to the lower 3% p.a. USA TIPS yield of the same term, 93% plus US inflation) will be reduced for a USD investor, by a weaker USD/ZAR exchange rate. The difference in 10- year interest rates available on vanilla RSA Bonds when compared to the lower yields offered by 10-year US Treasury Bonds, indicates that the rand is currently priced to weaken Vs the USD by an average 3.8% p.a. rate over the next ten years. If such exchange rate expectations prove accurate, the expected dollar returns from the 4% plus inflation real rand return are not relatively attractive. The risks of exchange rates not complying with PPP are not easily hedged. Inflation linkers eliminate the risk of inflation – but only in the domestic currency.
Fig.4; RSA-USA Real interest rate spread – before and after expected ZAR weakness.
Source; Bloomberg and Investec Wealth & Investment
A consolation for investors in RSA Bonds -the carry has narrowed recently.
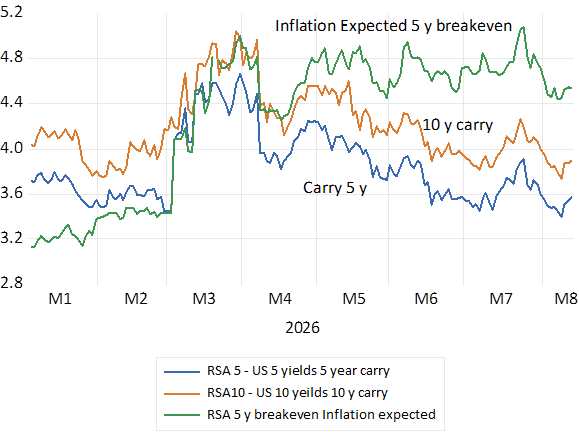
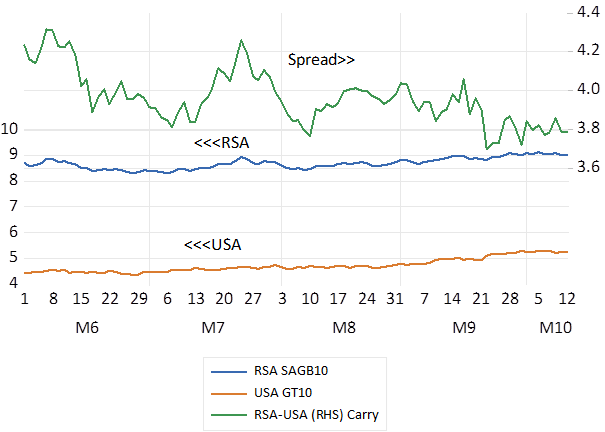
One important recent consolation for investors in RSA bonds is that while RSA yields have risen, they have risen by less than US bond yields. The carry- the extra reward for holding RSA bonds – has declined rather than widened. And as discussed, by implication of interest parity, the ZAR is expected to depreciate at a lower rate which implies less pressure from the rand prices of imports and exports on the SA CPI than before.
Fig.5; RSA and USA 10 year Bond Yields and their Spread (Daily Data June – October 2026)
Source; Bloomberg and Investec Wealth & Investment
Measuring sovereign risks of default.
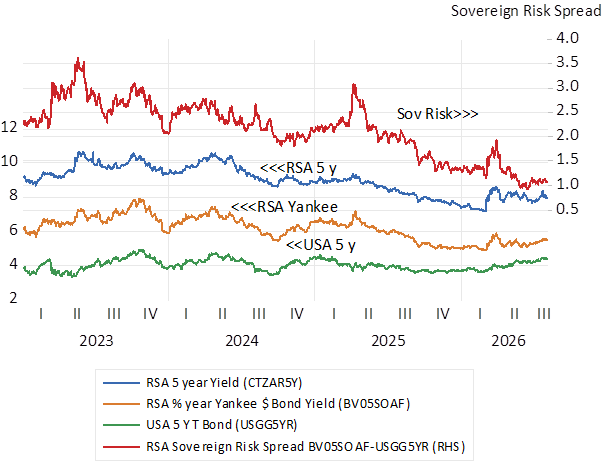
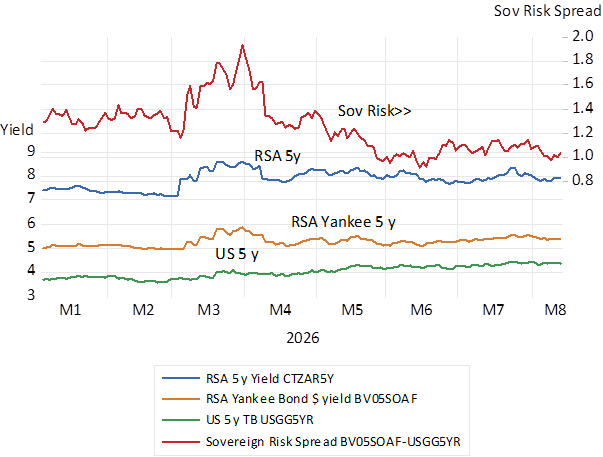
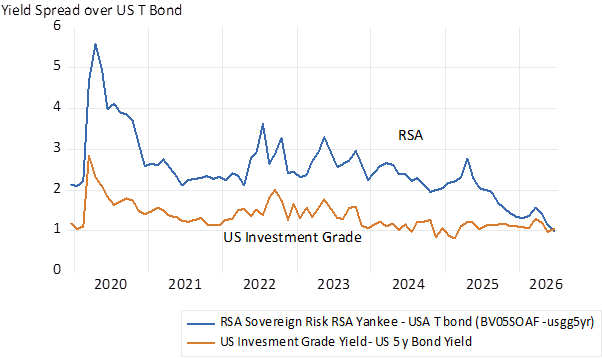
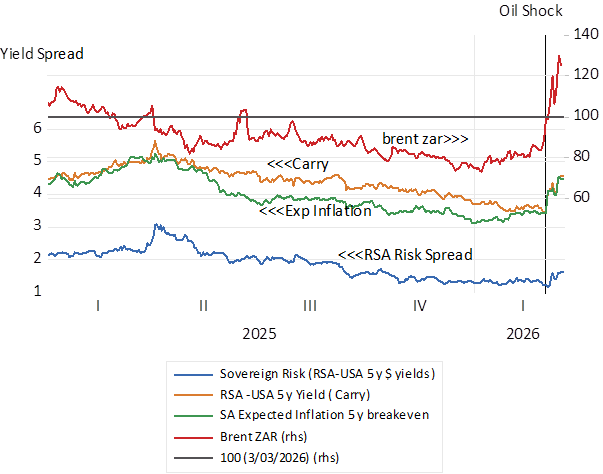
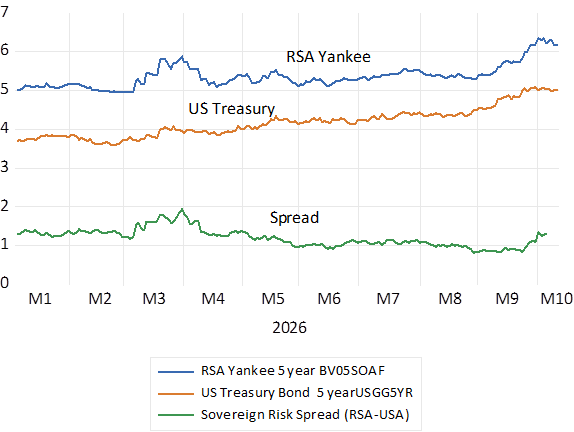
The difference between the yield on a same currency USD denominated RSA bond and a US Treasury Bond provides a less complicated view of sovereign risk. It carries default risk- but not currency risk. Thus this spread may be regarded as compensation for the risk that a government issuing the foreign currency denominated bond might not be able to pay the interest or capital repayment in the foreign currency. The difference in the yield offered by a RSA Yankee – dollar denominate RSA bond – and an equivalent US Treasury Bond therefore represents the risk of default. This interest rate spread may be regarded as a Sovereign Risk premium. The yield on the five-year RSA Yankee bond has widened recently in line with bond yields generally including dollar denominated debt issued by other emerging market issuers. As has the RSA spread over US Treasury Bond yields widened marginally, indicating more sovereign risk. But of some further consolation to investors in RSA Yankee bonds is that this sovereign risk spread is significantly lower than it was in early 2025.
Fig.6; RSA sovereign risk identified. Daily Data 2026.
Yield
Source; Bloomberg and Investec Wealth & Investment
[1] The correlation between daily per cent moves in the S&P 500 Index and a US Treasury Bond Index in 2026 is a positive (R=0.41) it was negative for much of 2025.